
Real-time Visualization of Sensor Data in Smart Manufacturing using
Lambda Architecture
Nadeem Iftikhar
1
, Bartosz Piotr Lachowicz
1
, Akos Madarasz
1
, Finn Ebertsen Nordbjerg
1
,
Thorkil Baattrup-Andersen
2
and Karsten Jeppesen
1
1
University College of Northern Denmark, Aalborg 9200, Denmark
2
Dolle A/S, Frøstrup 7741, Denmark
Keywords:
Industry 4.0, Real-time Visualization, Sensor Data, Smart Manufacturing, Lambda Architecture, Machine
Learning.
Abstract:
Smart manufacturing technologies (Industry 4.0) as solutions to enhance productivity and improve efficiency
are a priority to manufacturing industries worldwide. Such solutions have the ability to extract, integrate, ana-
lyze and visualize sensor and data from other legacy systems in order to enhance the operational performance.
This paper proposes a solution to the challenge of real-time analysis and visualization of sensor and ERP data.
Dynamic visualization is achieved using a machine learning approach. The combination of real-time visual-
ization and machine learning allows for early detection and prevention of undesirable situations or outcomes.
The prototype system has so far been tested by a smart manufacturing company with promising results.
1 INTRODUCTION
Manufacturing industry nowadays is looking to in-
crease productivity and enhance efficiency through
integration of new digital industrial technology (In-
dustry 4.0) within the production system. The pro-
duction system includes but is not limited to: enter-
prise resource planning (ERP), manufacturing execu-
tion system (MES), control and hardware. Hence, to
improve production performance it is critical to mon-
itor the entire production system and predict any fail-
ures in order to avoid unplanned machine stoppages.
This paper presents real-time production monitoring
techniques capable of providing a live perspective on
production performance using multiple data sources
including sensor data. Additionally and importantly,
the real-time sensor data is matched against predicted
sensor data to alert in case of anomalies. Real-time
production monitoring allows production managers
and machine operators to comprehend and master in-
cidents by taking timely actions.
To summarize, the main contributions in this pa-
per are as follow: proposing a lambda architecture to
analyze and visualize real-time and batch data, pro-
viding methodologies for real-time production moni-
toring, presenting a machine learning model to raise
alerts at real-time, and demonstration of the proposed
solution at a smart manufacturing company.
The paper is structured as follows. Section 2
describes the proposed approach to visualize sensor
data. Section 3 provides the details about real-time
production visualization methods. Section 4 intro-
duces the machine learning model. Section 5 illus-
trates the data visualization dashboards. Section 6
presents the related work. Section 7 concludes the
paper and points out the future research directions.
2 APPROACH
This section provides insight into the approach taken
to build a complete solution of relevant tools and tech-
niques to analyze and visualize real-time and histori-
cal data. In order to build this system, lambda archi-
tecture approach is chosen (Marz and Warren, 2015).
The main idea behind lambda architecture is to build
a system using a layered approach. Each layer has its
own set of properties, techniques and technologies,
and builds upon the functionality provided by the lay-
ers underneath it. The three layers of the lambda ar-
chitecture are: speed, batch and serving. The speed
layer processes recent data. The batch layer processes
all the data present in the master data storage and
the serving layer stores the real-time as well as batch
views for visualization and later analysis.
Iftikhar, N., Lachowicz, B., Madarasz, A., Nordbjerg, F., Baattrup-Andersen, T. and Jeppesen, K.
Real-time Visualization of Sensor Data in Smart Manufacturing using Lambda Architecture.
DOI: 10.5220/0009826302150222
In Proceedings of the 9th International Conference on Data Science, Technology and Applications (DATA 2020), pages 215-222
ISBN: 978-989-758-440-4
Copyright
c
2020 by SCITEPRESS – Science and Technology Publications, Lda. All rights reserved
215

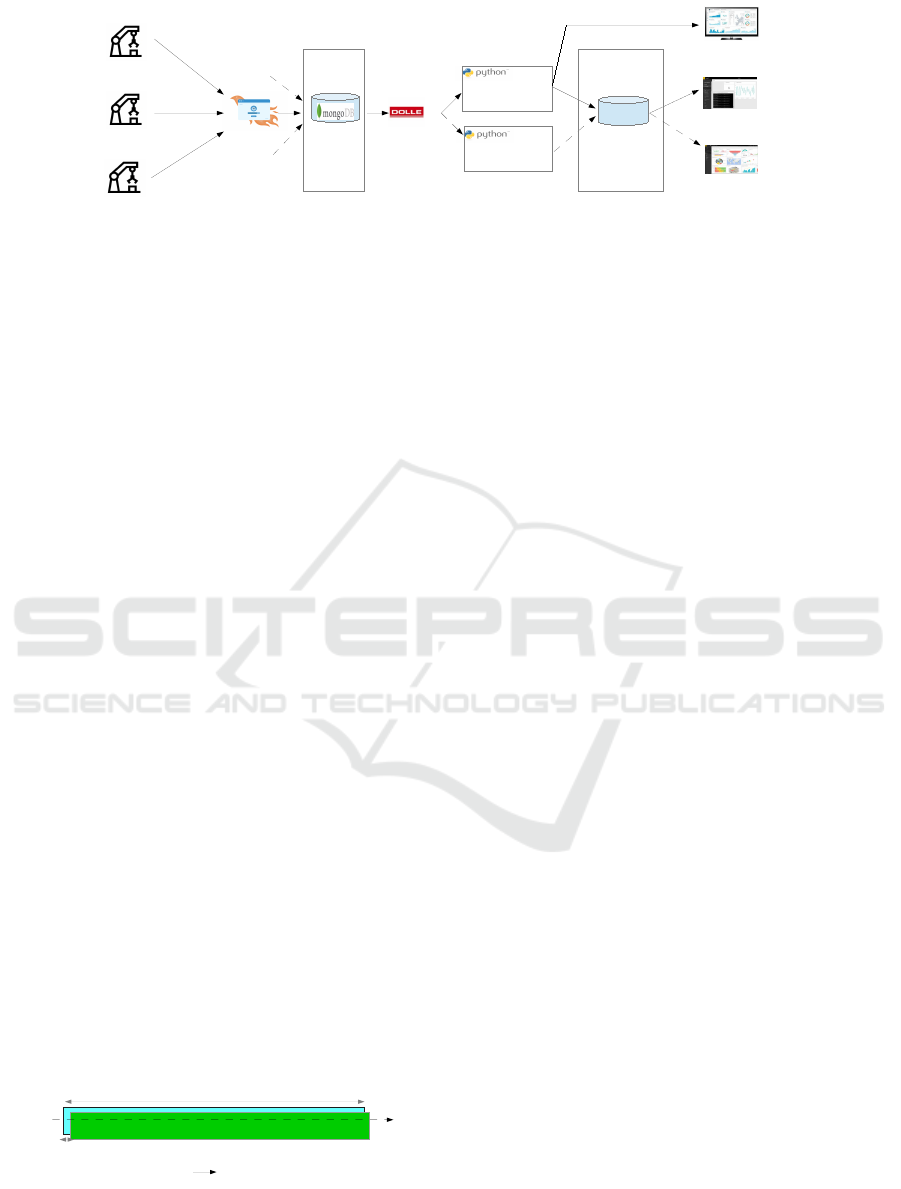
Figure 1: Conceptual lambda architecture.
Some of the benefits of the proposed solution
are listed below: Industry 4.0 (fourth industrial rev-
olution) connectivity by connecting production ma-
chines, sensors and ERP data in order to visualize
the entire production system; enhancing the business
process by minimizing downtime; boosting real-time
visibility by using dashboards for prompt alerts; and
providing end-users with unified views.
Most of the components of the proposed solution
are successfully deployed and tested in a manufac-
turing company (Dolle). Dolle is recognised as the
market leader in Europe for manufacturing timber loft
ladders.
2.1 Lambda Architecture
The conceptual lambda architecture is presented in
Fig. 1. The proposed architecture consists of six main
modules: a sensor network; ERP data integration;
integration of other external data, for example, in-
door/outdoor weather data; master data storage layer
for persistence; speed layer to process data streams
in real time; batch layer to perform extended time
analysis; and serving layer to store the output from
the speed and batch layers. The solid arrows both
in Fig. 1 and Fig. 2, represent streaming data, while
dashed arrows represent batch data. Further, Fig. 2
presents the concrete lambda architecture. The sensor
network consists of sensor nodes deployed through-
out the machines to measure the status of the ma-
chines such as, machine on/off, pace in, pace out and
fault/error. The ERP data contain details about prod-
ucts, job executions and work calendar. In addition,
other data may include indoor temperature, humid-
ity and so on. The data transmitted by the sensors is
streamed into the master data storage (MongoDB) by
Phoenix controller
1
. The Phoenix controller captures
data (ranging from 1 to 10 times per second) from the
1
https://hexdocs.pm/phoenix/Phoenix.Controller.html
sensor network and submits the data to MongoDB.
The controller submits the data of a sensor in Mon-
goDB, only if there is a change in the state of the sen-
sor. If there is no change in the state of the sensor
the value will not be stored. Further, the external data
such as ERP data, is also submitted to the master data
storage.
Sensor data snapshot:
[{‘timestamp’: ‘2020-02-03 08:45:30’,
‘value’: ‘true’,
‘port’: ‘0103’},
{..}, ..}]
ERP data snapshot:
[{‘planned_start’:‘2020-02-03 08:00:00’,
‘planned_stop’:‘2020-02-03 11:00.00’,
‘actual_start’:‘2020-02-03 08:15:00’,
‘actual_stop’:‘2020-02-03 11:45:00’,
‘item_id’:‘550583’,
‘machine_id’:‘1404’,
‘name’:‘SW365/3section/12threads/..’, ..}]
The sensor data snapshot provides a quick
overview of the data. The sensor data (JSON format)
contains three attributes. The data has varying granu-
larity as explained above. The first three rows in the
sensor data snapshot read as follows. Timestamp, rep-
resents the date and time of the sensor data acquisi-
tion. Value, corresponds to the state of the binary sen-
sor (either TRUE or FALSE) and port, indicates the
sensor number. For example, port = 103 represents
pace out sensor (rolling out of a ladder). Similarly,
the ERP data snapshot reads as follows. Planned start
and stop, represent the planned job execution date and
time. Actual start and stop, denote the actual job ex-
ecution data and time. Item-id, identifies the prod-
uct that is being produced. Machine-id, represents
the machine and finally name, represents the type of
product being produced. A custom-built web appli-
cation programming interface (Dolle API) allows for
access to the sensor and external data from the mas-
DATA 2020 - 9th International Conference on Data Science, Technology and Applications
216
Machine n
Machine 2
Machine 1
S
e
n
s
o
r
s
D
a
t
a
S
e
n
s
o
r
s
D
a
t
a
Phoenix Controller
API
Storm
based Script
(Real-time
Views)
Near Real-time
Data Visulatization
Historical
Data Visulatization
Sensors Data
ERP Data
Other Data
Map-Reduce
based Script
(Batch Views)
Real-time
Data Visulatization
Speed Layer
Batch Layer
Serving Layer
Master
Data Storage
SQLL DB
Figure 2: Concrete lambda architecture and the software platforms.
ter data storage by means of an HTTP GET request
to provide the data to the speed layer for processing.
The speed layer running on the Apache Storm plat-
form provides real-time views, while the batch layer
running on the Hadoop MapReduce platform delivers
precomputed batch results. The real-time views are
directly streamed to the dashboard(s) for real-time vi-
sualization using Dash, which is a Python framework
for building web applications. The real-time views
are also delivered to the serving layer with some la-
tency for near real-time visualization.
3 METHODOLOGY
3.1 Overview
This section describes the proposed real-time visual-
ization methods. Method 1 measures the productivity
in terms of the number of ladders produced during a
given period of time, whereas, method 2 calculates
the length of time elapsed since last ladder produced.
Both methods use a sliding window approach to get
the data from the master data storage at predefined in-
tervals (5 seconds in this case) and pass the data to
the speed layer. In Fig. 3, the first window (blue) con-
tains sensor data that arrives between the zeroth and
nine-hundredth second. The second window (green)
contains sensor data that arrives between the fifth and
nine-hundred and fifth second. Note that data from
fifth through nine-hundredth second is present in both
windows. When the second window (green) is exe-
cuted at time t = 5, data between the zeroth and fifth
second is dropped from the data queue.
window length = 900 seconds
sliding interval
= 5 seconds
fresh data read from the data storage
approximately every 5 seconds
…...............................................................................................
….
0 5 900 905
time in seconds
Figure 3: Sliding window.
3.2 Production Monitoring
The purpose of the production monitoring method is
to measure the productivity with respect to number of
ladders produced and display it as a live update ev-
ery time the method is executed (approximately every
5 seconds). The main idea behind the method is to
monitor the production process at real-time and to de-
tect errors/faults at earliest possible time in order to
take counter measures. Later in Section 5, this mon-
itoring method is combined with prediction models,
enhancing its ability to raise alerts at real-time.
The following outlines the four main steps of the
productivity measurement method:
1. Read the sensor data from the master data storage
every 5 seconds with a sliding window size of 900
seconds;
• The sliding window’s start time = (current time
- interval) and end time = current time. Where,
the interval is 900 seconds.
2. The data is then fed to the speed layer;
3. The speed layer performs the following function-
ality:
• The data is filtered by selecting the values,
where port equals to TRUE and ignoring the
values, where port equals to FALSE;
• The values of the port are aggregated in key-
value pairs;
• The aggregated results are displayed on dash
board;
• The aggregated data for real-time views are
stored in the serving layer every 300 seconds
for near real-time visualization;
• The key-pairs are reset to zero.
4. GOTO step 1.
The following example will help in understanding
how the sensor data is being processed by the speed
layer. For this example, port/sensor 103 (pace out)
is considered. The sliding window technique is used
to visualize sensor data at real-time. The proposed
Real-time Visualization of Sensor Data in Smart Manufacturing using Lambda Architecture
217
method divides the data in slices of constant length
of 900 seconds. Further, the algorithm writes to the
SQL database every 300 seconds for near real-time vi-
sualization. After executing the real-time processing
method at 2020-02-24 14:15:00 (current date/time), it
is of interest to see the snapshot of the data in the sen-
sor data table (Table 1). As, the predefined window
size is 900 seconds for that reason the start of window
date/time is (2020-02-24 14:15:00 - 900 seconds) =
2020-02-24 14:00:00 and end of window date/time is
2020-02-24 14:15:00. In this table, the granularity of
each rows differs. This is due to the fact that the sen-
sor value for a specific port is only registered when
it changes (different from the previous value). Each
row in this table represents the state of the pace out
sensor either TRUE or FALSE. TRUE means that the
pace out sensor detects the rolling out ladder section
and FALSE means vice-versa.
Table 1: Sensor data.
Timestamp Port Value
2020-02-24 14:00:00 103 TRUE
2020-02-24 14:00:01 103 FALSE
2020-02-24 14:00:17 103 TRUE
2020-02-24 14:00:19 103 FALSE
. . .
2020-02-24 14:01:19 103 FALSE
2020-02-24 14:01:42 103 TRUE
2020-02-24 14:01:43 103 FALSE
2020-02-24 14:02:01 103 TRUE
. . .
2020-02-24 14:14:29 103 TRUE
2020-02-24 14:14:31 103 FALSE
2020-02-24 14:14:46 103 TRUE
2020-02-24 14:14:47 103 FALSE
Table 2: Key-Value pair.
Port Value
103 42
Further, the count of TRUE’s is saved in a key-
value pair of which port is the key and the count of
TRUE’s is the value (Table 2). This table shows that
in the last 900 seconds 42 ladder sections were pro-
duced. Moreover, the data also posts live to the dash-
board. The tachometers in Fig. 4 shows two readings
at 15 minutes and hourly levels.
180
6
14
[82 %]
56
[82 %]
0
25 50
12
75
15 Minutes Hourly
(a) (b)
Figure 4: The pace of rolling out ladder.
The tachometer in Fig. 4(a) shows that 14 ladders
of type SW365/3section/12threads were produced in
the last 15 minutes and that the average number of
ladders of this type are produced during this time is
17, so the performance is approximately 82%. The
formula to calculate the pace out per 15 minutes is
number of ladder sections / number of sections = 42
/ 3 = 14. The number of ladder sections are divided
by three since the finished product (ladder) is a three
section ladder (Fig. 5).
section
3 –
s
ec
tio
n
la
dd
er
Figure 5: Three section ladder.
Similarly, the tachometer in Fig. 4(b) shows that
56 ladders are expected to be produced in an hour and
the hourly capacity for the specific type of the lad-
der is 68, so the performance is approximately 82%.
The formula to calculate the hourly production rate
(the number of items produced per hour) is (num-
ber of ladder sections * 4) / number of sections =
(42 * 4) / 3 = 168 / 3 = 56 ladders per hour. The
number of ladder sections are multiplied by four is
for the reason that there are four quarters in an hour
and it is divided by three since the finished product
(ladder) consists of three sections.
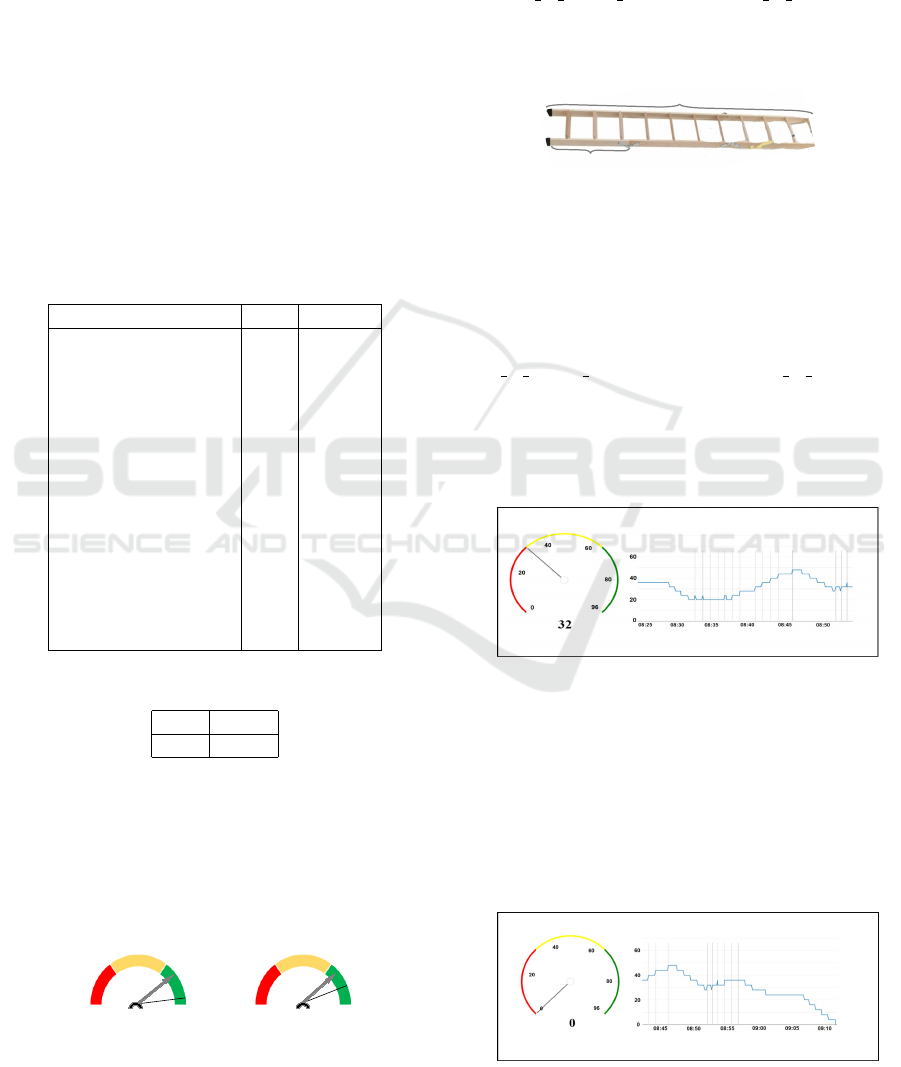
Figure 6: Hourly production rate (below average).
Further, a below average production situation is
shown in Fig. 6. It shows an hourly production rate
of 32 ladders against an expected average hourly pro-
duction rate of 68 ladders. The grey lines represent
the ladder output. In this case the rolling out ladder
pace is 47%. A fault situation is shown in Fig. 7. The
tachometer shows an hourly production rate of zero
ladders. The reason is that current time is 09:12 and
Figure 7: Hourly production rate (fault).
DATA 2020 - 9th International Conference on Data Science, Technology and Applications
218

the last ladder was produced at 08:56. As a result
no ladders were produced within the last 15 minutes
dropping the hourly production rate of ladders to zero.
3.3 Time Elapsed
The purpose of the time elapsed method is to keep
track of when the last time the sensor triggered and
display it as a live update every 5 seconds. The idea is
to be able to follow the sensor triggering pattern and
see how many seconds have elapsed since the sen-
sor was last triggered. This value is then compared
to the expected range of the patterns. The method
works as follows. First, the Dolle API gets the sen-
sor data from the master data source in a sliding win-
dow size of 900 seconds. Following this, the acquired
data is passed to the speed layer. The initial data for-
mat is JSON, which is then transformed into inter-
pretable variables, such as integers and real numbers.
Finally, calculations on the data are performed, only
considering timestamps where the port value is TRUE
and directly followed by a value of FALSE. Each
time the method is executed it calculates the differ-
ence between the last timestamp of TRUE to FALSE
transition and the current timestamp (time elapsed =
current time - last output time). For example, if the
value of port 103 was TRUE at 2020-02-24 14:14:01
and at 2020-02-24 14:14:04 it became FALSE, then,
if the method is executed at 2020-02-24 14:14:53 in
that case it will show time elapsed since last ladder
was produced = 2020-02-24 14:14:53 - 2020-02-24
14:14:01 = 52 seconds. In addition, the method resets
the time elapsed to zero if the machine turns off. This
ensures that the time elapsed value is displayed only
if the machine is running and expected active in the
production.
The following outlines the five main steps of the
time elapsed method:
1. Read the sensor data in the sliding window size of
900 seconds from the master data storage approx-
imately every 5 seconds;
2. Filter the data where the values are TRUE and
transitioning to FALSE;
3. Get the time stamp for the last transitioning event
for the specific port;
4. Calculate the time elapsed that is by subtracting
the last timestamp from the current timestamp;
5. GOTO step 1.
Furthermore, the tachometers in Fig. 8 demon-
strate the time elapsed. In Fig. 8(b), it can be seen that
the time elapsed for port 103 (rolling out ladder) is 52
seconds, whereas, the average rolling out time of this
(a) (b)
Figure 8: Time elapsed.
ladder type is 40 seconds. An alert situation (in red) is
shown in Fig. 8(a). The tachometer shows an elapsed
time of 176 seconds. That means that there were no
ladders produced in the last 176 seconds. This indi-
cates a need for immediate action as could be caused
by a fault in the machine.
4 MACHINE LEARNING
This section introduces the real-time pattern detec-
tion machine learning model. To detect abnormal pat-
terns is an important feature of smart manufacturing.
For example, if the performance of the machine is di-
verging from the standard pattern then it could cause
an unwanted stop to the whole production system.
Hence, to achieve production efficiency it is vital to
detect errors/faults or abnormal patterns in real-time
in order to take early and appropriate actions to keep
the production running without unwanted stops. The
incoming real-time sensor data is compared to stan-
dard patterns by using machine leaning models and
an alert could be triggered when some abnormal event
is predicted to happen such as, the machine is going
to stop. Further, Fig. 9 describes the pattern detec-
tion machine learning algorithm in detail. As men-
tioned in Fig. 2, the speed layer and batch layer based
on Python Storm and MapReduce, respectively. The
serving layer consists of a SQL Server. The proposed
algorithm uses batch layer (MapReduce) to train the
model to detect abnormal patterns. The MapReduce
job runs at predefined intervals and updates the coef-
ficients of the pattern detection models in the serving
layer (SQL Server). Further, the speed layer reads
the incoming streaming data from the MongoDB and
detects abnormal patterns by applying the pattern de-
tection algorithm. The pattern detection algorithm dy-
namically uses the latest calculated model coefficients
obtained from the serving layer. In Fig. 9, the solid
arrows represent streaming data, while dashed arrows
represent batch data.
Several forecasting models are available, in this
paper Auto-regressive model (AR) is chosen. An AR
model is a widely used linear model that works on
stationary time series. AR models use the dependent
relationship between a value y and some number of
Real-time Visualization of Sensor Data in Smart Manufacturing using Lambda Architecture
219
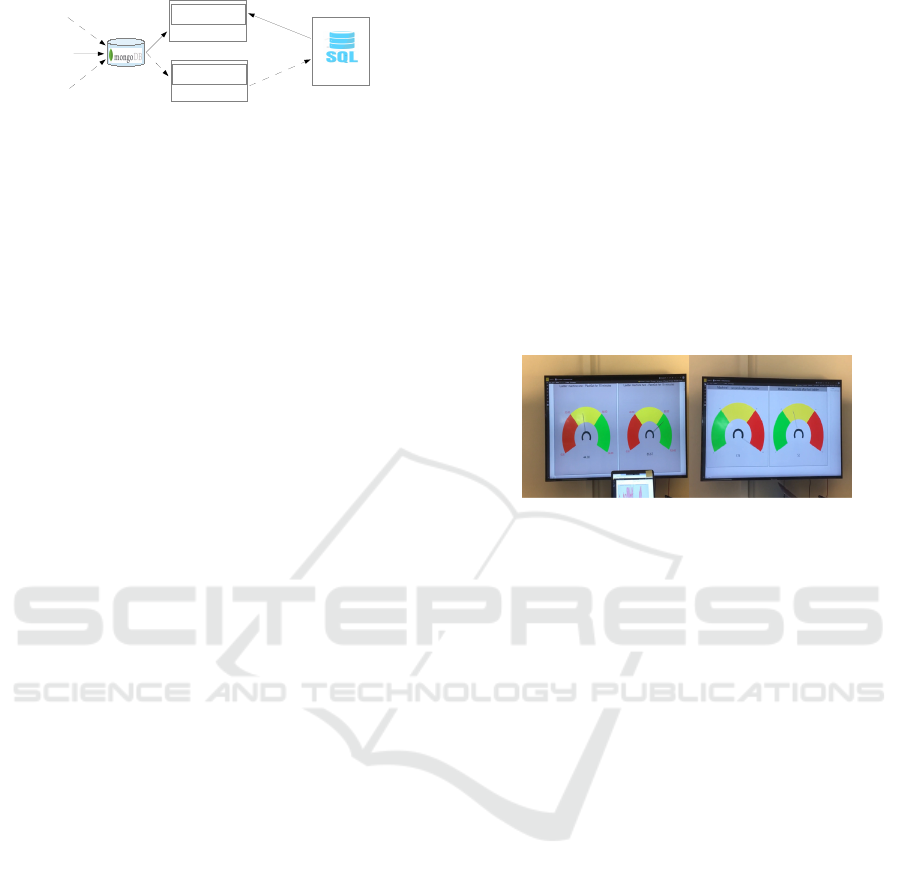
ERP Data
Other Data
Machine Learning (ML)
Models
A
p
p
l
y
M
L
M
o
d
e
l
s
U
p
d
a
t
e
M
L
M
o
d
e
l
s
Speed Layer
Batch Layer
Pattern Detection
Algorithm
Sensor Data
Serving Layer
Figure 9: Pattern detection machine learning method.
lagged values y (Black, 2011). The regression coeffi-
cients in the standard AR models do not vary, while
in the proposed model the regression coefficients may
vary with the ladder type. For this reason, regression
coefficients are calculated for each ladder type, sepa-
rately. In other words, it means that for each ladder
type a separate model will be trained. The value of t
indicates the ladder type. As, there are approximately
30 different main ladder types, the time index param-
eter will be i
t
, where t = 1, .., n and n is the number
of ladder types (n = 30). The proposed AR model of
order P can be written as follows, Equation 1.
ˆy
i
t
= c
t
+
P
∑
λ=1
α
t,λ
y
i
t
−λ
+ ε
i
t
(1)
where c
t
is the intercept with the y − axis (a con-
stant), α
t,λ
is the regression coefficient, ε
i
t
is the value
of the white noise.
The following outlines the six main steps of the
pattern detection algorithm:
1. Compute the AR model for the specific ladder
type at the batch layer;
2. Update the coefficients of the model to the serving
layer every 15 minutes;
3. Read the sensor data with a window size of 900
seconds from the master data storage every 5 sec-
onds and predicts the reading for each sensor us-
ing the AR model;
4. Calculate the distance between the predicted and
the actual sensor reading;
5. If the distance is above a certain threshold then
raise an alert;
6. GOTO step 1.
5 DATA VISUALIZATION
DASHBOARDS
The section describes the use case to deploy the pro-
posed prototype system at Dolle (a smart manufactur-
ing company in Frøstrup, Denmark). Dolle has de-
ployed 14 sensors on two machines to collect pro-
duction related data. The prototype system is demon-
strated from the perspective of production managers
and machine operators. The system uses real-time
data collected from the deployed sensors from both
the machines as well as ERP data. The sensor data
consists of machine status, alarm, pace of side rails
and wood rungs, pace of output products (ladders),
faulty side rail, screwing machine error and so on.
The ERP data consists of machine-id, job-id, ladder
type, planned job start and stop date/time, actual job
start and stop date/time, number of ladders produced,
down time and so on. The sensor data is acquired with
an interval of every five second, while the ERP data
is acquired at the start of each new job. Wall mounted
dashboards reporting the hourly production rate and
elapsed time since the last ladder was produced are
presented in Fig. 10.
Figure 10: Real-Time production monitoring dashboards.
Further, Fig. 11 shows the hourly production rate
(the pace of number of items produced per hour) in
real-time. It is important to monitor the hourly pro-
duction rate in order to keep the production running.
Fig. 11, displays the hourly production rate or pace
that has dropped to zero (tachometer on the left) also
visible on the graph (right) that no ladders were pro-
duced in the last 15 minutes. The last ladder was
produced at 08:57. The grey lines in the graph rep-
resents the exit of an ladder from the machine. The
dashboard also displays the ERP data such as, job-
id, ladder type, machine number, planned start and
stop, actual start and predicted stop. In addition, the
dashboard displays the planned and actual number of
ladder produced, time since last error as well as er-
ror type and machine downtime in the last hour. It
is interesting to observe that the date/time for the pre-
dicted stop is automatically adjusted depending on the
remaining number of ladders to produce and the ma-
chine downtime for the current job.
Moreover, machine learning models depending on
the ladder type are applied to predict hourly produc-
tion rates. The difference between the predicted and
actual data is measured against thresholds and the
presence of significant anomalies automatically trig-
ger alerts, such as changing the color coding of the
line in the graph (Fig. 11). The changing of color
from blue to yellow and later to red triggers warning
so that the situation can be actioned.
DATA 2020 - 9th International Conference on Data Science, Technology and Applications
220
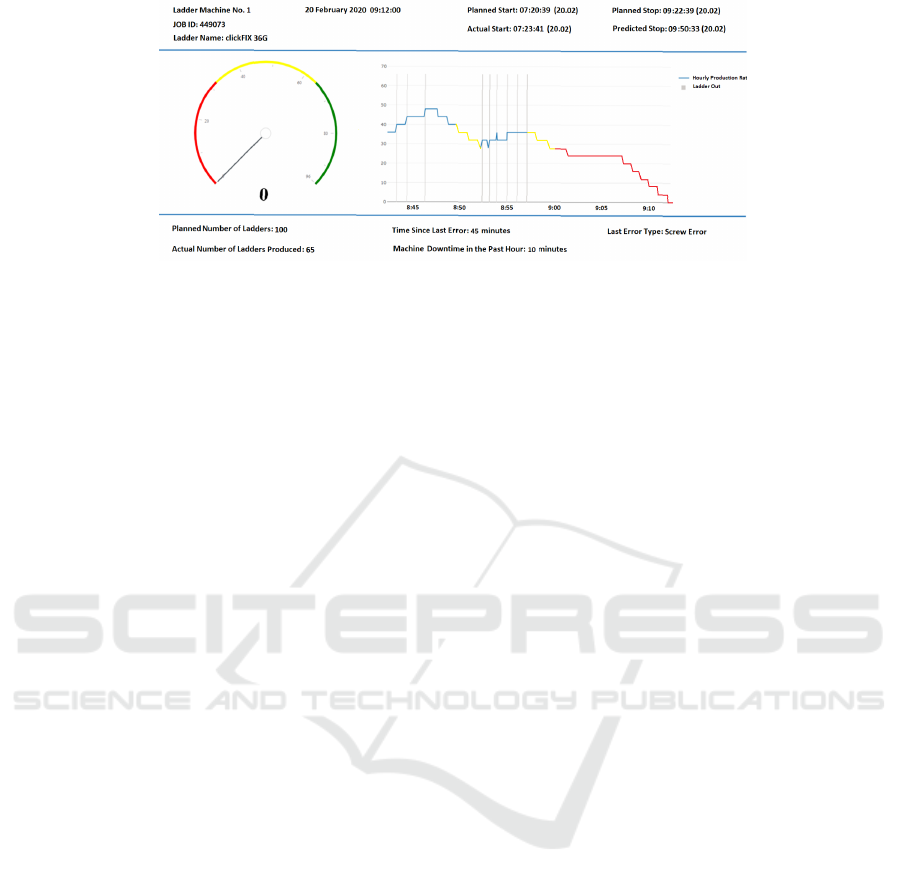
Figure 11: Real-Time visualization of hourly production rate with machine learning.
6 RELATED WORK
This section mainly concentrates on previous work
done in relation to data analysis, data visualization
and machine learning in smart manufacturing.
A near real-time and easy to use operational pro-
cess dashboard designed for the machine operators
to monitor the information about the products and
the performance of the manufacturing process is pre-
sented by (Gr
¨
oger et al., 2013). A state-of-the-art re-
view by (Bordeleau et al., 2018) indicated that real-
time monitoring and analysis are the major areas of
research in the context of Industry 4.0. Similarly a
comprehensive study by (Zheng et al., 2018) exam-
ined smart manufacturing systems for Industry 4.0
and presented some scenarios for production monitor-
ing. In addition, (Tokola et al., 2016) suggested mul-
tiple dashboards for end-users in manufacturing in-
dustry based on different hierarchy levels to visualize
operational, tactical and strategical data. These pre-
vious works focus on various conceptual aspects and
recent advancements of data visualization and analy-
sis in medium and large-sized manufacturing compa-
nies. The work presented in this paper builds upon the
ideas presented in those previous works, however, the
focus of this paper is to provide practical application
of data analysis and visualization technologies in rela-
tion to data from operational and production systems
in small and medium-sized (SME) enterprises.
Furthermore, a real-time monitoring system that
utilizes IoT-based sensors, big data processing and
various prediction models is proposed (Syafrudin
et al., 2018). The main focus of this work is to visu-
alizer indoor climate data at real-time and classify the
values for fault prediction. In contrast to this work,
the work presented in this paper emphases on real-
time operational and production data analysis and vi-
sualization.
In connection with machine learning in smart
manufacturing. A state-of-the-art review of deep
learning techniques for machinery fault diagnosis,
predictive analysis and defect prognosis is presented
by (Wang et al., 2018). Predicting the bottlenecks
in a production system by using ARIMA model is
proposed by (Subramaniyan et al., 2018). Further,
(Shin et al., 2017) presented a model for predicting
energy consumption of manufacturing machinery. A
generic solution in environment monitoring that is ca-
pable of detecting anomalies and displaying the re-
cent situation is proposed by (Trilles et al., 2015). Fi-
nally, (Iftikhar et al., 2019) described the basic build-
ing blocks to construct a complete solution for data
analysis and visualization.
To the best of our knowledge, this paper is one of
very few to deal with the practical aspects of produc-
tion monitoring and machine learning at real-time in
order to enhance operational efficiency in manufac-
turing industry.
7 CONCLUSIONS AND FUTURE
WORKS
This paper has presented the possibilities of real-time
production monitoring based on a real world case
study in the manufacturing industry. The proposed
solution is quite flexible and salable to develop con-
crete prototype system for real-time, near real-time
and historical data analysis and visualization. To en-
hance the operational efficiency real-time visualiza-
tion dashboards were developed. Moreover, regres-
sion based machine learning technique was also used
to detect anomalies. The effectiveness of the produc-
tion monitoring dashboards and the performance of
the prediction method were tested at the premises of
a manufacturing company with promising results.
For the future work, a real-time interactive dash-
board based on the idea of predictive maintenance
will be developed. Further, it will be investigated how
Real-time Visualization of Sensor Data in Smart Manufacturing using Lambda Architecture
221

the real-time dashboards help the smart manufactur-
ing companies in general, in order to enhance their
operational efficiency and productivity. Finally, the
accuracy of the machine learning model will be tested
to see how well it can predict the likelihood of devel-
oping anomalies in a machine.
REFERENCES
Black, K. (2011). Business Statistics: For Contemporary
Decision Making. John Wiley & Sons, 9th edition.
Bordeleau, F. E., Mosconi, E., and Santa-Eulalia, L. A.
(2018). Business intelligence in industry 4.0: State
of the art and research opportunities. In 51st Hawaii
International Conference on System Sciences, pages
3944–3953. AIS e-Library.
Gr
¨
oger, C., Hillmann, M., Hahn, F., Mitschang, B., and
Westk
¨
amper, E. (2013). The operational process dash-
board for manufacturing. Procedia CIRP, 7:205–210.
Iftikhar, N., Baattrup-Andersen, T., Nordbjerg, F. E.,
Bobolea, E., and Radu, P. B. (2019). Data analytics
for smart manufacturing: A case study. In 8th In-
ternational Conference on Data Science, Technology
and Applications, pages 392–399. SCITEPRESS Dig-
ital Library.
Marz, N. and Warren, J. (2015). Big Data: Principles and
Best Practices of Scalable Real-time Data Systems.
Manning Publications Co., New York.
Shin, S. J., Woo, J., and Rachuri, S. (2017). Predictive ana-
lytics model for power consumption in manufacturing.
Procedia CIRP, 15:153–158.
Subramaniyan, M., Skoogh, A., Salomonsson, H., Banga-
lore, P., and Bokrantz, J. (2018). A data-driven algo-
rithm to predict throughput bottlenecks in a produc-
tion system based on active periods of the machines.
Computers & Industrial Engineering, 125:533–544.
Syafrudin, M., Alfian, G., Fitriyani, N. L., and Rhee, J.
(2018). Performance analysis of iot-based sensor, big
data processing, and machine learning model for real-
time monitoring system in automotive manufacturing.
Sensors, 18(9):2946.
Tokola, H., Gr
¨
oger, C., J
¨
arvenp
¨
a
¨
a, E., and Niemi, E. (2016).
Designing manufacturing dashboards on the basis of
a key performance indicator survey. Procedia CIRP,
57:619–624.
Trilles, S., Schade, S., Belmonte, O., and Huerta, J. (2015).
Real-time anomaly detection from environmental data
streams. In AGILE’15 Geographic Information Sci-
ence as an Enabler of Smarter Cities and Communi-
ties, pages 125–144. Springer, Cham.
Wang, J., Ma, Y., Zhang, L., Gao, R. X., and Wu, D. (2018).
Deep learning for smart manufacturing. Journal of
Manufacturing Systems, 48:144–156.
Zheng, P., Sang, Z., Zhong, R. Y., Liu, Y., Liu, C., Mubarok,
K., Yu, S., and Xu, X. (2018). Smart manufacturing
systems for industry 4.0: Conceptual framework, sce-
narios, and future perspectives. Frontiers of Mechani-
cal Engineering, 13(2):137–150.
DATA 2020 - 9th International Conference on Data Science, Technology and Applications
222
