
Classification of Products in Retail using Partially Abbreviated
Product Names Only
Oliver Allweyer
1
, Christian Schorr
2
, Rolf Krieger
2
and Andreas Mohr
1
1
retailsolutions GmbH, Campus, Saarbruecken, Germany
2
Institute for Software Systems, Trier University of Applied Sciences, Environmental Campus Birkenfeld,
Birkenfeld, Germany
Keywords: Machine Learning, Automatic Product Classification, Product Data.
Abstract: The management of product data in ERP systems is a big challenge for most retail companies. The reason lies
in the large amount of data and its complexity. There are companies having millions of product data records.
Sometimes more than one thousand data records are created daily. Because data entry and maintenance
processes are linked with considerable manual effort, costs - both in time and money - for data management
are high. In many systems, the product name and product category must be specified before the product data
can be entered manually. Based on the product category many default values are proposed to simplify the
manual data entry process. Consequently, classification is essential for error-free and efficient data entry. In
this paper, we show how to classify products automatically and compare different machine learning
approaches to this end. In order to minimize the effort for the manual data entry and due to the severely limited
length of the product name field the classification algorithms are based on shortened names of the products.
In particular, we analyse the benefits of different pre-processing strategies and compare the quality of
classification models on different hierarchy levels. Our results show that, even in this special case, machine
learning can considerably simplify the process of data input.
1 INTRODUCTION
Product data is of central importance in retail
companies. A product data record in a enterprise
resource plannig (ERP) system consists of a large
number of descriptive and process-controlling
attributes. There are companies having millions of
product data records. Sometimes more than one
thousand data records are created daily. Hence, the
management of product data is associated with
considerable effort and high costs and many
companies do research for automating the data entry
and maintenance.
An essential step in the entry of product data in
every ERP system - like in SAP for Retail for example
- is the classification of the product which assigns the
product to a product category. Correct classification
has a decisive influence on data quality, the execution
of follow-up business processes and on a seamless
data exchange between business partners. There may
even be health risks if a food product is missclassified
in a group containing no allergens when in fact it does
for example.
In addition, many attributes of a product depend
on its product category. Food products differ in many
attributes from electronic devices, clothing from
music instruments and beverages from body care
products. Hence, it is of utmost importance to know
the membership of a product to a specific category at
the time of data entry. The very first step in this
process is entering the product name, which is often
abbreviated due to system limitations to a certain
number of characters. Predicting the product
classification at this step is a crucial time and cost
saving task. In our application scenario the
classification is done semi-automatically, meaning
the user has to confirm the classification proposed by
the algorithm.
The categories and the hierarchical relations
between them are defined by classification systems.
A well-known product classification standard is the
Global Product Classification (GPC) described in
GS1 (2018). This standard defines a hierarchical
classification system consisting of hundreds to
thousands of product categories and is often used by
retail companies. In many cases standard
classification systems coexists with company-
Allweyer, O., Schorr, C., Krieger, R. and Mohr, A.
Classification of Products in Retail using Partially Abbreviated Product Names Only.
DOI: 10.5220/0009821400670077
In Proceedings of the 9th International Conference on Data Science, Technology and Applications (DATA 2020), pages 67-77
ISBN: 978-989-758-440-4
Copyright
c
2020 by SCITEPRESS – Science and Technology Publications, Lda. All rights reserved
67

specific ones that have a similar number of categories
and hierarchical levels. Consequently, consistent
classification is a complex, time-consuming and
error-prone task. Wrong product classification
reduces data quality causing additional costs as
mentioned above. Much research is undertaken to
solve this problem using machine learning (Sun
(2014), Cevahir (2016), Kozareva (2015)).
The challenge of product data classification has
multiple aspects. If a product is created in an ERP-
system and is not assigned to a category initially, the
user has to decide to which category it should belong
to. As explained before, this decision depends on
different criteria like the set-up of the classification
system in use, the nature of the product or certain
business processes. Often, little information is
available at the time of data entry. The information
available depends on the business processes. In
general, however, at least the product name is known.
Usually, it is shortened to the number of characters
permitted by the system during data entry. The main
contribution of our paper is an analysis and discussion
of the problem of classifying food products based on
short product names using different approaches of
machine learning. In our experiments the length of
almost all product names is less than 36 characters.
This paper is organised as follows: We start with
a brief review of the related work for product
classification based on machine learning and explain
the differences to the classification problem
considered in this paper. Section 3 describes the
product data set that we use in our experiments and
the structure of the hierarchical Global Product Data
Classification (GPC). Subsequently, we present the
results of a descriptive analysis of our data set.
Section 4 describes our experimental results,
introducing the feature engineering and related pre-
processing steps performed for the text attributes of
our product data set. Then, we describe the
experiments for analysing the impact of these pre-
processing steps on classification results. Afterwards
we compare different machine learning algorithms
for multi-class product classification at different
hierarchical classification levels. Section 5
summarizes our conclusions and suggests some
avenues for further research.
2 RELATED WORK
In the following, we give an overview of current
approaches to multi-class product classification.
Most algorithms use the name of the products and
their description. Sometimes additional text,
categorical or numeric attributes or even product
images are also considered. A recent and
comprehensive comparison of classification
algorithms for product data can be found in
Chavaltada (2017). A framework for product
description classification especially for e-commerce
is suggested by Vandic (2018). In Yu (2012) the
authors propose to separate the classification of
products names from the classification of texts. They
focus on the effects of text pre-processing on the
classification of categories with less than 100 classes.
Stemming and removing stopping words have a
negative influence on the classification of product
names and should not be used. Bigrams and feature
transformation with a polynomial kernel work better
for text classification than expected, probably due to
the shorter length of product names compared to full
texts. A similar problem is investigated by Shankar
(2011). Two data sets with 21 and 24 categories of
different vendors are classified using naïve Bayes and
a bag-of-words model. The analysis of pre-processing
steps shows that the removal of stopping words using
the Porter stemmer and cleaning punctuation marks
result in the biggest positive influence on accuracy.
Lower-casing, stemming and the removal of numerals
show no or negative influence.
Several classification methods on a UNSPSC-
categorised data set of product descriptions are
studied by Ding (2002). A naïve approach transforms
both the product names and the descriptions of the
UNSPSC categories into word vectors and computes
the combination with the highest cosine similarity. A
hierarchical classification approach using the
UNSPSC categories leads to a significantly worse
result, contrary to intuition. Cevahir and Murakami
(2016) propose a classification model assigning
products to one of 28.338 possible categories on a
five-tier taxonomy using 172 million Japanese and
English product names and descriptions. The model
combines deep belief nets, deep auto-encoders and k-
Nearest Neighbour-classification (kNN). Yu (2018)
also employs a hierarchical taxonomy and Deep
Learning. They use fasttext to represent product
names with 100-dimensional word embeddings based
on bigrams and observe that any pre-processing like
stemming, removing stopping words and extracting
substantives has a negative impact on the
classification results.
An overview of short text classification can be
found in Song (2014). The authors state the
sparseness of short texts as a main challenge, making
them difficult to standardize also due to spelling
mistakes and noise. Their definition of short text
includes online chat records, mobile short messages
DATA 2020 - 9th International Conference on Data Science, Technology and Applications
68
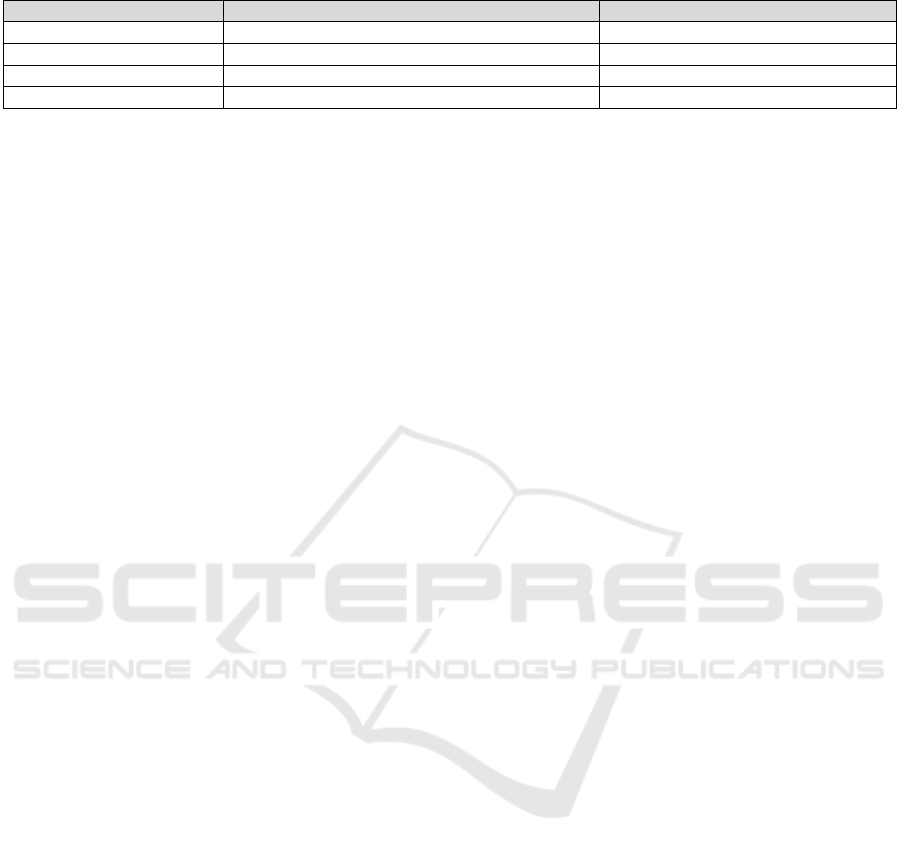
Table 1: GPC Classification Hierarchy Levels.
Hierarch
y
level Descri
p
tion Exam
p
le
Se
g
ment Industr
y
se
g
mentation or vertical Food, bevera
g
es, clothin
g
Famil
y
Broad division of a se
g
ment Milk, butter, crea
m
Class Group of like categories Milk, Milk substitutes
Bric
k
Categories of like products Milk (perishables)
and news titles, all with up to 200 characters and
following a certain grammatical and syntactical
structure lacking in our product names and thus not
applicable to our task. Kozareva (2015) has worked
on product classification with Yahoo! product data.
They compared several classifiers and 5 kinds of
features, and showed that a neural network
embedding representation performed best for their
data with over 300 categories in their category
taxonomy. Chen (2013) uses multi-class-SVM with a
cost-sensitive function and 1073 categories from the
UNSPSC taxonomy. To predict these categories over
one million products with product name, description
and manufacturer are utilized. Ha (2016) propose a
deep learning-based strategy for product
classification utilizing multiple recurrent neural
networks (RNNs). Beside product names they use
brand, manufacturer and the top level category among
other attributes. Their data encompasses more than 94
million products with 4016 low-level categories. The
length of product names – which are in Korean
characters - is not given in the paper. Sun (2014)
suggests an interesting hybrid approach called
Chimera. It uses a mixture of crowd outsourced
manual classification, machine learning and data
quality rules formulated by in-house analysts. They use
it to classify several tens of millions of products into
more than 5000 categories based on product name,
product description and several other attributes.
All these approaches share the assumption that
both product names and product descriptions in more
or less natural language are available. In our case, the
classification has to be computed on very short and
partially abbreviated product names without further
detailed product descriptions. Consequently, we
expect that models based on the exploitation of syntax
and structure of natural language like most deep
learning approaches are not suited for our task.
3 PRODUCT DATA SET
3.1 Product Data Specification
Product data is modelled in different ways. Generally,
a product is uniquely identified by its product ID and
assigned to a product category of a multi-level
hierarchy. Furthermore, there are many additional
descriptive and process-related attributes. Mostly,
product attributes are classified in ERP systems
thematically. The basic data record of a product
includes the product description, packaging units,
dimensions, volumes, gross and net weights, hazardous
substance codes etc. Logistic data include safety stock,
service level, delivery time, etc. Purchasing and sales
data include prices, minimum order quantities, delivery
periods etc. These product attributes are referenced by
many processes in purchasing, material requirements
planning, inventory management and sales. The
attributes that have to be maintained for a specific
product item depend on its category mainly.
Usually the classification of the product has to be
done before the attribute of a specific product can be
maintained. Especially in case of a manual data entry
process the classification of a product should be done
based on a minimal data input, e.g. the product name.
For that reason, we investigate different classification
algorithms based on the product name as a single
feature.
3.2 Global Product Classification
Beside company-specific classification systems there
are general standards for product classification like
eCl@ss, UNSPSC or eOTD as described by Hepp
(2007). One such standard is the Global Product
Classification (GPC) which is maintained by the GS1
organization. It is used by 60.000 German companies
and over 1.5 million companies world-wide. GPC is
four-layer hierarchy consisting of segment, family,
class and brick codes to describe products as shown
in Table 1. Every product can be assigned to exactly
one brick which is uniquely identified by an 8 digit
brick code. A brick identifies a category incorporat-
ing products “that serve a common purpose, are of a
similar form and material, and share the same set of
category attributes“ (GS (2018)). The product Farmer
Milk 1,5% for example is assigned the brick Milk
(Perishable) with code 10000025. This brick is
situated in the GPC hierarchy below the class
Milk/Milk Substitutes which in turn is filed under the
family Milk/Butter/Cream/Yogurts/Cheese/Eggs/
Classification of Products in Retail using Partially Abbreviated Product Names Only
69
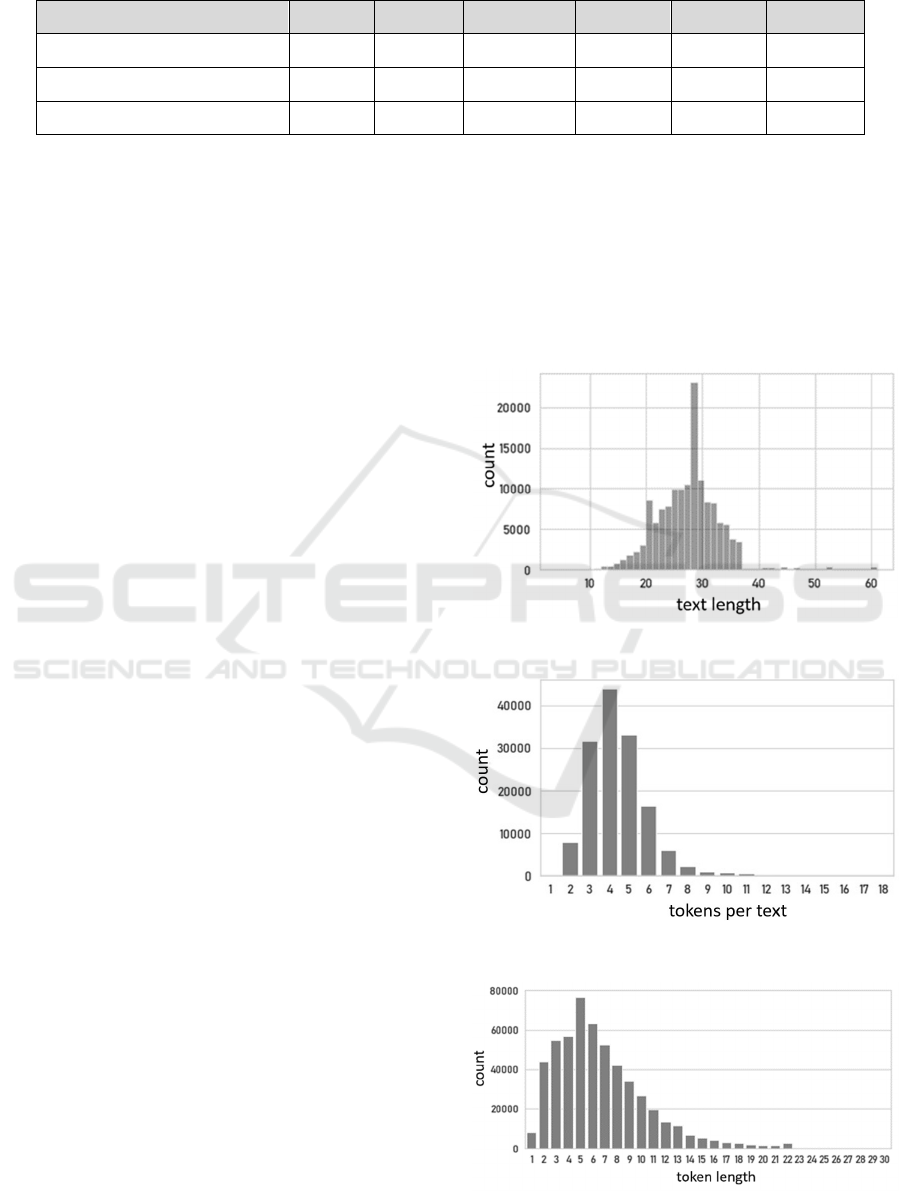
Table 2: Descriptive analysis of product name and tokens.
Min Q
0.25
Median Q
0.75
Max Mean
Tokens per product name 1 3 4 5 18 4.42
Product name length 4 24 28 31 61 27.74
Token length 1 4 6 9 30 6.74
Substitutes in the segment Milk/Butter/
Cream/Yogurts/ Cheese/Eggs/Substitutes.
The GPC hierarchy and its underlying logic are
intended to be conclusive and comprehensive. All
products of the supply chain should be covered and
the hierarchy should be as balanced as possible. In the
brick category, products which can be described by
the same attribute, are grouped by their physical
nature. Their intended use should not be a grouping
criterion. Their naming follows standardised
conventions and definitions are formulated
comprehensively. The GPC system in version 2018
consists of 38 different segments, 118 families, 823
classes and 4226 bricks. The bricks themselves may
also have attributes in the GPC specification, but
these are not considered in this paper.
3.3 Data Set Statistics
The data set we tested our algorithms on was provided
by a major German retail company with over 1000
stores throughout the country. It only contains
products from the food sector with product name and
additional textual and numeric attributes as well a the
corresponding Global Product codes (GPC). Of
further interest is the product brand which is given for
9.8% of the data and the product description - a much
more detailed and longer version of the product name
- which is maintained for 21.3% of the data. This
information is only used to generate a normalization
dictionary as described in section 4.1, though. Prior
to classification we conducted an explorative data
analysis to determine necessary pre-processing steps.
Our data set consists of product names with a length
of 4 to 61 characters, as depicted in Figure 1. Most of
the names encompass 20 to 36 characters with only a
few deviant names with more. In our experiments we
assume the separator symbols in our data set to be
spaces. Splitting the product name into separate
tokens, we see that most product names are made of
2 to 7 tokens, as shown in Figure 2. This suggests that
each product name is built of only a few words.
Figure 3 depicts the distribution of the token length in
characters. It varies between 1 and 30 characters with
a typical length of 2 to 9 characters. Abbreviations are
determined heuristically by using dots as signifiers. A
representative sampling of our data set has shown this
to be a sensible approach. As a result 21% of all
product names contain one abbreviation. The nature
of our product names means that there is no natural
language as such to process, only agglomerations of
partially abbreviated nouns without syntax or
grammar. Therefore we assume that algorithms which
Figure 1: Product name (text) length in characters.
Figure 2: Tokens per product name (text).
Figure 3: Token length in characters.
DATA 2020 - 9th International Conference on Data Science, Technology and Applications
70
heavily exploit the structure of natural language as
occurring in coherent sentences - like most deep
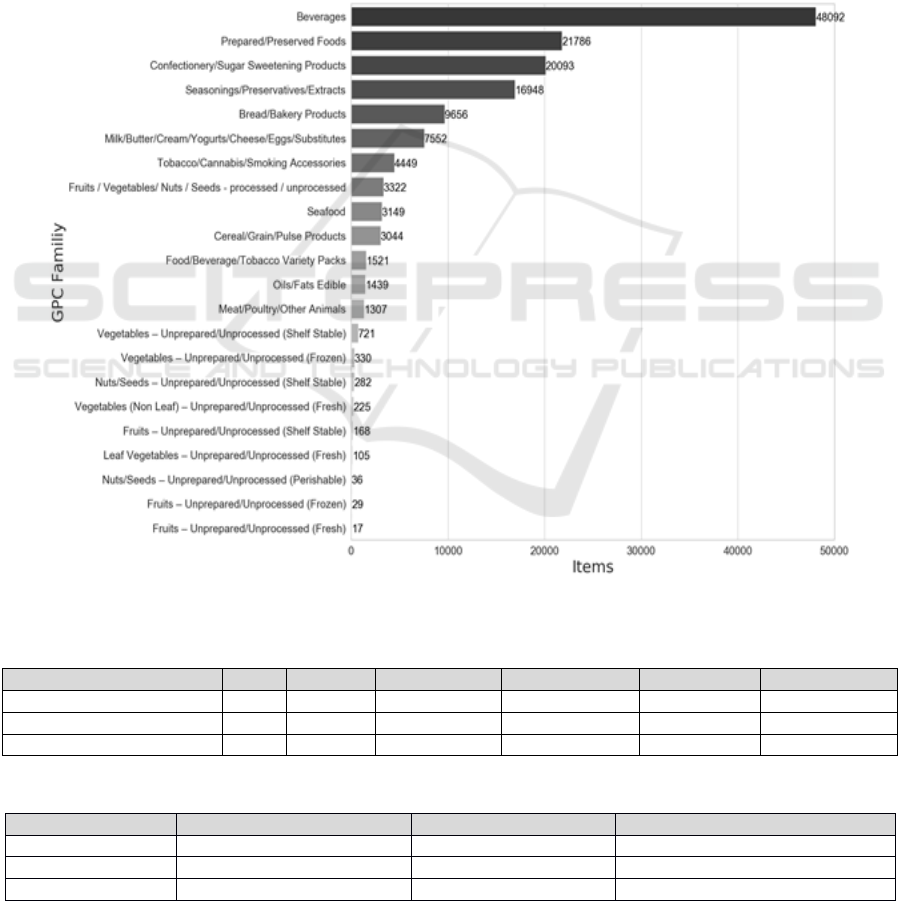
learning approaches - are not suited to our data. The
available data set exhibits an unbalanced distribution
of products to categories, as can be seen in detail in
Figure 3 and Table 3. Very small categories like
Nuts/Seeds – Unprepared/Unprocessed (Perishable)
with only 36 products are therefore excluded from
classification, because the probability of predicting
them correctly is tiny due to the miniscule amount of
corresponding training data. A category is excluded if
it contains less than 0.1% of the entries of the biggest
category - in our data set 48 products. The choice of
the 0.1% threshold was chosen based on the goal to
exclude as few categories as possible with as few
products as possible. This leads to the exclusion of 3
GPC families containing only 82 of the entire 144.000
products of the data set and is thus of no significant
concern.
4 EXPERIMENTS
First, we introduce pre-processing algorithms and text
representations (4.1) as well as the metrics and
classification algorithms (4.2) we use in the
subsequent experiments. We investigate the impact of
Figure 4: Number of products per family level in final data set.
Table 3: Product to hierarchy level distribution in final data set.
Min Q
0.25
Median Q
0.75
Max Mean
Products / family 17 239.25 1480 6776.25 48092 6557.77
Products / class 1 17.75 207.50 1170 28922 1442.71
Products / bric
k
1 6 37 228.50 13661 366.17
Table 4: Final data set size.
Level Cate
g
ories Test data Trainin
g
data
Famil
y
19 9930 134256
Class 72 10008 134067
Bric
k
245 9829 133728
Classification of Products in Retail using Partially Abbreviated Product Names Only
71
Table 5: Used machine learning algorithms and hyper-parameter settings.
Algorithm Parameter 1 Parameter 2 Parameter 3
Naïve Bayes alpha = 0.1 - -
Single-Layer Perceptron alpha = 0.001 max_iter = 500 -
Multi-Layer Perceptron alpha = 0.001 max_iter = 500 layer_size = 25
Lo
g
arithmic Re
g
ression al
p
ha = 0.001 max
_
iter = 500 -
Su
pp
ort Vector Machine C = 1.0 max
_
iter = 500 -
Decision Tree max
_
de
p
th = 1000 max
_
leaf
_
nodes = 1000 -
Random Forest max_depth = 1000 max_leaf_nodes = 1000 n_estimators = 100
text pre-processing on classification quality (4.3).
Then we use these results and classify the produc
names according to GPC family with different
classification algorithms and text-representations
(section 4.4). Using the best model we subsequently
predict all three hierarchy levels – family, class and
brick code (section 4.5).
4.1 Pre-processing and Representation
of Text Attributes
The product name and brand contain a high amount
of information. It is often intuitively possible to
assign a product to the correct category using only its
name and brand. The baseline is given by the
classification based on product names that are
maintained for all data using Naïve Bayes. Texts can
be represented in a multitude ways. We compare the
bag-of-words representation and the TF-IDF (term
frequency - inverse document frequency) developed
by Jones (1972) with the Word2vec model by
Mikolov (2013) and measure their impact on the
classification. The impact of lower casing and the
cleaning of interpunctions, numerals, special
characters and umlauts is investigated in section 4.3.
Using all cleaning steps the short description
VEGETBL.M.MIREPOIX 2,5KG ONIO.DCD/-
CEL.DCD/CAROT.DCD. is transformed to “vegetb
m mirepoix kg onio dcd cel dcd carot dcd“ for
example.
Product names often contain abbreviations as
already mentioned. To get a uniform representation a
normalisation dictionary based on brand and product
descriptions is required. In case of our data set,
product descriptions are only available for 21.3% of
the products. This means that for the majority of
products, no direct correspondences between
abbreviated product name and full product
description are given. Since most abbreviations are
not limited to a single product, normalisation is still
possible, though. A simple approach is to assign the
full brand name to each abbreviated token or to search
for a corresponding description in the product
description and use this pair as a dictionary entry.
Depending on the specific abbreviation, multiple
meanings are possible, though. The common German
abbreviation gem. can represent gemahlen (ground),
gemischt (mixed), Gemenge (mixture) or Gemüse
(vegetables) for example. In order to differentiate
between these cases, the context of the abbreviation
has to be included. We implemented a method using
3-grams to create the normalisation dictionary
automatically. The result contains 24.807 entries with
6.666 normalisations.
4.2 Metrics and Algorithms
In the case of imbalanced classes in a classification
problem, special consideration has to be given to the
choice of meaningful metrics. Accuracy is not a
reasonable metric in this case. If there are two classes
with a 98% to 2% ratio of members for example, a
model predicting the prevalent class in every case
would reach an impressive but meaningless accuracy
of 98%. Precision, recall and especially the F
1
score
are better suited in this case. Since we consider a
multi-class classification task with several thousand
possible classes we compute micro- and macro-
averaged metrics and combine them into a weighted
metric to measure the results of our algorithms.
Micro-averaged methods sum up the individual true
positives and true negatives for all different sets and
then divide the sum by the total number of samples.
This approach weights individual decisions equally,
therefore large classes will dominate small ones.
Macro-average methods, on the other hand, calculate
the metrics separately for each class, and then average
them to get a single number. Thus equal weight is
given to every class, which measures the
effectiveness on small classes. By using weighted
metrics we can judge the performance of our
algorithms for multi-class classification. We use the
implementation of the Python library Scikit-Learn
(2019) which defines the weighted metrics as follows:
Be 𝑦 the set of predicted tuples (label,sample), 𝑦
the set of true tuples (label,sample), L the set of all
DATA 2020 - 9th International Conference on Data Science, Technology and Applications
72
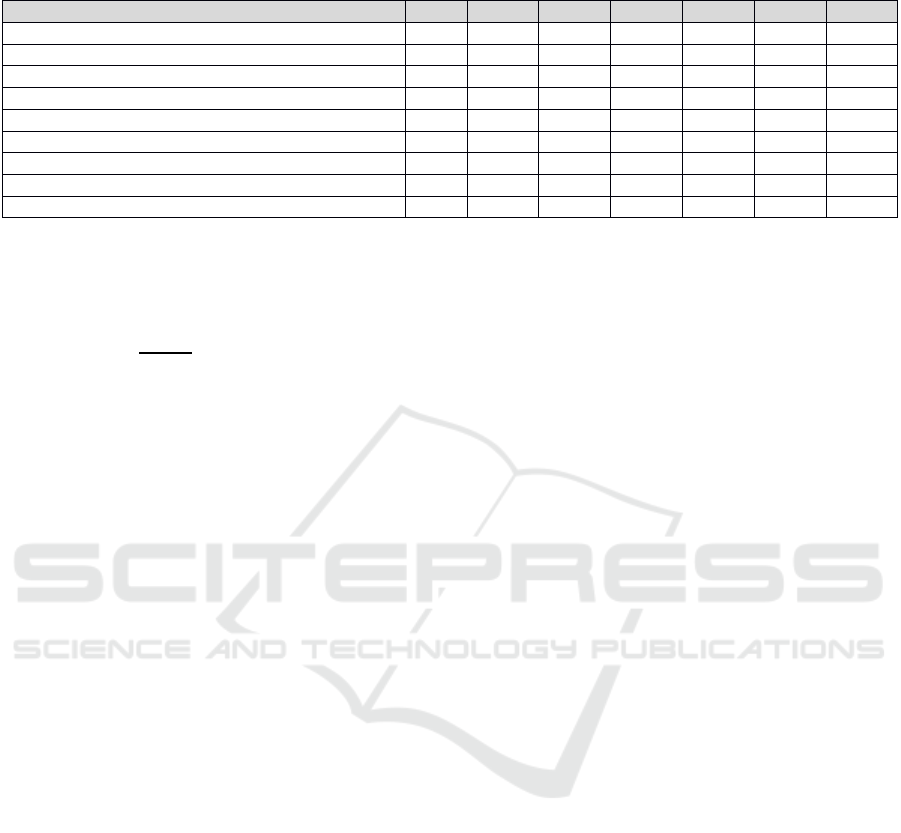
Table 6: Results of classification (feature: product name / label: family code) depending on text pre-processing strategies,
Naïve Bayes (NB), CV x5.
Pre-
p
rocessing algorith
m
P
r
Wg
P
r
Ma
Re
Wg
Re
Ma
F
1Mi
F
1Wg
F
1Ma
no_text_preprocessing 0.918 0.766 0.920 0.627 0.920 0.918 0.656
conversion_to_lowercase 0.921 0.770 0.923 0.631 0.923 0.920 0.659
removal
_
s
p
ecials 0.919 0.768 0.920 0.629 0.920 0.918 0.659
removal
_
umlauts 0.919 0.766 0.920 0.629 0.920 0.918 0.658
removal
_
numerals 0.916 0.761 0.918 0.629 0.918 0.915 0.658
lowercase_removal_specials 0.921 0.771 0.923 0.634 0.923 0.921 0.661
lowercase_removal_specials_umlauts 0.921 0.768 0.923 0.634 0.923 0.921 0.661
lowercase_removal_non_letters 0.919 0.767 0.921 0.633 0.921 0.919 0.661
lowercase
_
removal
_
non
_
letters+normalize 0.918 0.764 0.919 0.632 0.919 0.917 0.659
labels and 𝑦
⊆ 𝑦 with label 𝑙∈𝐿 and 𝑦
⊆𝑦 with
label 𝑙∈𝐿. Then the weighted metric M
Wg
(1) is
defined as follows:
𝑀
∑|
|
∈
∑|
𝑦
|
∈
𝑀
𝑦
,𝑦
(1)
Substituting the general metric M with the binary
classification problem definition of precision, recall
or F
1
score leads to weighted versions Pr
Wg,
Re
Wg
and
F
1Wg
suitable for multi-class classification.
All steps from data pre-processing to the
evaluation of the classifiers are implemented in
Python 3.6.6. Apart from the usual standard modules
several specialized libraries are used: Pandas and
NumPy for data processing and Scikit-Learn for the
machine learning algorithms. The Scikit-Learn class
Pipeline is used as a framework for the classification
pipelines. It allows to encapsulate multiple
transformers and one estimator in order to run all
transformations on both training and test data
automatically.
We use several popular easy-to-use classification
algorithms for the actual prediction. The baseline
standard method is a simple Naïve Bayes estimator
(NB) (Maron (1961)). In addition to logistic
regression with stochastic gradient descent
(SGD_log) (Taddy ( 2019)), support vector machines
(SVM) (Cortes (1995)), a single-layer perceptron
(Rosenblatt (1958)) (SLP) and a simple multi-layer
perceptron with a hidden layer of 25 neurons (MLP)
are tested on the data. Both a basic decision tree
(Tree) as well as the ensemble method RandomForest
(RandForest) (Ho (1995)) are also used for the
classification. The choice of hyper-parameters for
each algorithm was optimized using grid search. The
resulting parameters are given in Table 5. We set
aside 20% of our data set containing a balanced class
representation for evaluation purposes and used the
remaining data for training and testing to determine
the best text pre-processing and classification
algorithm combination. All computations were run
with five-fold cross-validation (CV x5) using a
stratified k-fold strategy after prior shuffling (Kohavi
(1995)). Tests with finer partitioning did not improve
the results significantly, increasing computation time
only.
4.3 Impact of Text Pre-Processing on
Classification
In order to determine the best text pre-processing
strategy, several options and combinations thereof are
compared. A useful overview can be found in Song
(2005) or Uysal (2014). A common feature of text
pre-processing is the removal of stop-words. Since
our data does not consist of grammatically correct
sentences but only of names, stop-words are not
present and thus not considered. Likewise pre-
processing by stemming (Porter (1980)) is not
applicable since no inflected verbs are contained in
the data and many words are already abbreviated.
The text is represented as a bag-of-words model
consisting of unigrams. Metrics are computed on the
classification of family code with a Naïve Bayes
algorithm using only the product name as a feature.
Other classification algorithms were not used because
we want to focus on the text pre-processing first in
order to reduce the number of possible pre-processing
/ classification algorithm combinations in the actual
experiments to a manageable level. We assume that
the results of the pre-processing step analysis with
Naïve Bayes are also valid for other classifiersWe
consider the following pre-processing algorithms:
no_text_preprocessing: use of the original
product names without any changes
conversion_to_lowercase: conversion of all
uppercase to lowercase letters
removal_specials: remove all special characters
removal_ umlauts: remove all German umlauts
removal_numerals: remove all numerals
Classification of Products in Retail using Partially Abbreviated Product Names Only
73
lowercase_removal_specials_umlauts:
lowercase and remove of all special characters
and umlauts
lowercase_removal_non_letters: lowercase
and remove of all non letters including umlauts
lowercase_removal_non_letters+normalize: a
more sophisticated pre-processing strategy
implementing the normalization dictionary
introduced in section 4.1
Our baseline is using the original product names
without any changes. The best values for each metric
are highlighted in bold script. The results in Table 6
show almost no difference in quality regarding pre-
processing. Removing special characters (and
umlauts) combined with the conversion to lowercase
letters returns the highest weighted F
1
score of 0.921.
Normalization even minimally worsens the results
compared to the baseline approach without pre-
processing. This can probably be explained by our
heuristic normalization procedure and the quality of
the normalization dictionary that was generated
automatically. Adding more entries and checking
them manually could improve the results but would
require considerable effort due to the very large
amount of possible abbreviations and varities thereof.
The normalization method also eliminates numerals
which has a detrimental effect on the classification
quality. Hence, in the following experiments we make
no use of the normalization procedure. Of note is the
much lower macro F
1
score in comparison with the
weighted F
1
score. This is caused by the imbalance of
the data set which causes small categories with only a
few products to be predicted less succesfully than large
categories containing many products. Experiments in
sections 4.4 and 4.5 confirm this discrepancy.
4.4 Evaluation of Classification
Algorithms
To determine the best text representation method the
bag-of-words (BoW) model is compared to the TF-
IDF representation and the Word2vec (Mikolov,
2013) embedding. Different parameters were used for
all three text representations. For bag-of-words and
TD-IDF n-grams from (1,2) – using 1- and 2-grams -
to (4,4) – using only 4-grams - were investigated.
Regarding the distribution of tokens in Figure 1 with
a typical token amount of at most 6 for the majority
of products, we deemed 4-grams to be a reasonable
upper limit. For the Word2vec representation we used
dimensions 100, 200 and 300. Mikolov (2013)
compared 50, 100, 300 and 600 and found only a very
small difference between using 300 and 600 with a
data set of 24 million words. Since our data set is
significantly smaller we chose to set the upper limit
at 300. The data was pre-processed by lower casing
and removal of all special characters and umlauts,
then classified on family level by different machine
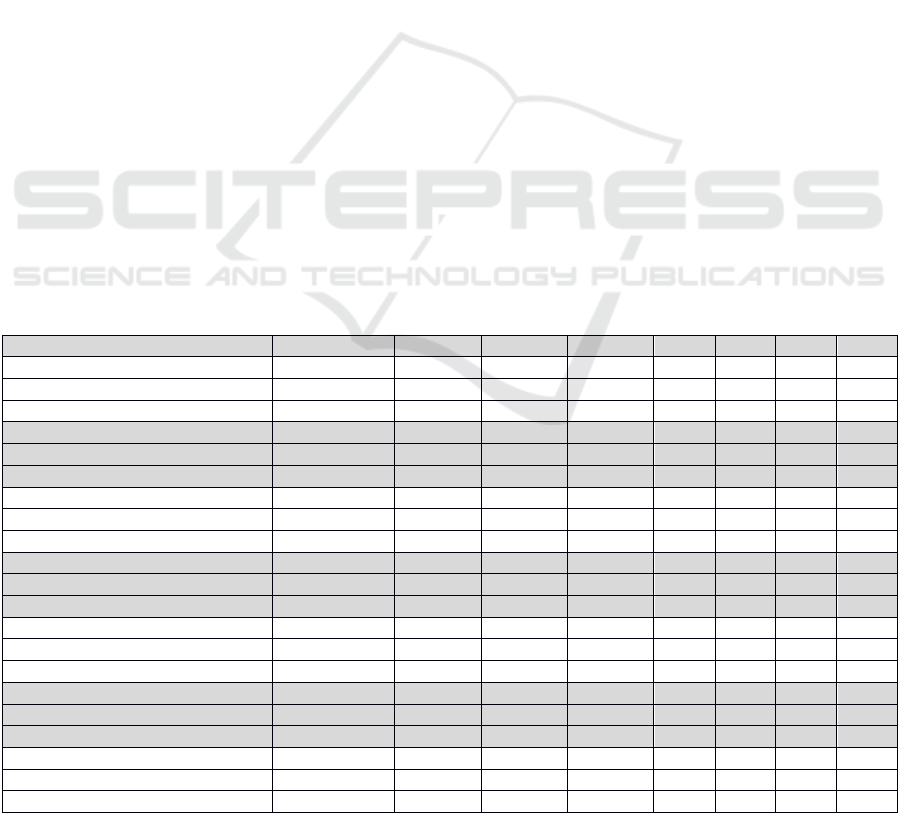
Table 7: Results of classification of products (feature: product name / label: family code) depending on machine learning
algorithms, CV x5.
Text Representation Algorith
m
P
r
Wg
P
r
Ma
Re
Wg
Re
Ma
F
1Mi
F
1Wg
F
1Ma
BoW, ngrams=(1, 2) NB 0.927 0.829 0.928 0.623 0.928 0.926 0.665
TF-IDF, n
g
rams=
(
1, 2
)
NB 0.918 0.687 0.920 0.516 0.920 0.913 0.554
Word2vec, dim=300 NB 0.676 0.385 0.672 0.381 0.672 0.667 0.369
BoW, ngrams=(1, 2) SLP 0.934 0.657 0.917 0.684 0.917 0.925 0.648
TF-IDF, ngrams=(1, 2) SLP 0.929 0.709 0.930 0.704 0.930 0.930 0.702
Word2vec, dim=300 SLP 0.761 0.523 0.721 0.430 0.721 0.709 0.433
BoW, n
g
rams=
(
1, 2
)
MLP 0.931 0.800 0.933 0.665 0.933 0.931 0.708
TF-IDF, n
g
rams=
(
1, 2
)
MLP 0.934 0.784 0.936 0.690 0.936 0.934 0.721
Word2vec, dim=300 MLP 0.807 0.579 0.813 0.468 0.813 0.806 0.492
BoW, ngrams=(1, 2) SGD log 0.749 0.474 0.728 0.256 0.728 0.690 0.278
TF-IDF, ngrams=(1, 2) SGD log 0.449 0.143 0.371 0.060 0.371 0.220 0.040
Word2vec, dim=300
SGD log 0.747 0.485 0.757 0.335 0.757 0.739 0.365
BoW, n
g
rams=
(
1, 2
)
SVM 0.933 0.797 0.935 0.697 0.938 0.934 0.734
TF-IDF, n
g
rams=
(
1, 2
)
SVM 0.938 0.803 0.939 0.692 0.938 0.938 0.730
Word2vec, dim=300 SVM 0.779 0.609 0.787 0.444 0.791 0.776 0.482
BoW, ngrams=(1, 2) Tree 0.936 0.605 0.938 0.445 0.790 0.937 0.492
TF-IDF, ngrams=(1, 2) Tree 0.936 0.596 0.938 0.446 0.788 0.936 0.487
Word2vec, dim=300 Tree 0.779 0.419 0.791 0.325 0.720 0.780 0.349
BoW, n
g
rams=
(
1, 2
)
RandForest 0.824 0.621 0.790 0.450 0.833 0.794 0.497
TF-IDF, n
g
rams=
(
1,2
)
RandForest 0.821 0.625 0.788 0.452 0.830 0.792 0.498
Word2vec, dim=300 RandForest 0.710 0.581 0.720 0.352 0.784 0.709 0.389
DATA 2020 - 9th International Conference on Data Science, Technology and Applications
74

Table 8: Classification of products (feature: product name / label: family, class and brick code), SVM with TF-IDF,
ngrams=(1,2), CV x5.
Label Pr
Wg
Pr
Ma
Re
Wg
Re
Ma
F
1Wg
F
1Ma
Family code 0.938 0.803 0.939 0.692 0.938 0.730
Class code 0.911 0.697 0.914 0.602 0.912 0.631
Brick code 0.860 0.664 0.865 0.545 0.860 0.580
learning algorithms using only the product name as a
feature. Entries with null values, meaning without
product names, were not present in the data.
The bag-of-words and TF-IDF representation do
not differ perceptibly regarding the results. The
impact of n-grams is likewise similar for most
algorithms. Using intervals (1,2), (1,3) or (1,4) leads
to the best results for both bag-of-words and TF-IDF.
Omitting unigrams causes a significant reduction of
prediction quality, though. To improve readability,
only the figures for the n-gram choice of (1,2) giving
the best results are displayed in Table 7. In general,
the Word2vec embedding is worse than the bag-of-
words and TD-IDF. Using higher embedding
dimensions increases the classification quality greatly.
Again, only the parameter choice of 300 giving the best
results is shown to improve readability.
The results show that both linear and decision-tree
based models perform better on simpler text
representations than on Word2vec. In summary the
model with the highest weighted F
1
score of 0.938
uses support vector machine algorithms combined
with a TF-IDF model using uni- and bigrams.
4.5 Classification on Different
Hierarchical Levels
After determining the best text representation strategy
in section 4.3 and the highest scoring machine
learning algorithm on family level in section 4.4 we
now apply the resulting method combination on the
lower hierarchy levels class and brick. We use the
entire data set for training and testing with five-fold
cross validation. Compared to the balanced validation
data set used in sections 4.3 and 4.4, the full data set
is partially unbalanced regarding the families and
classes as shown in figure 3 and table 3.. As can be
expected the metrics are decreasing with each
hierarchy level as depicted in Table 8. The step from
family to class level increases the possible codes from
19 to 72 as can be seen in Table 4, reducing the
weighted F
1
score slightly by 0.026. On the lowest
level there are 245 brick codes leading to a total
decrease of 0.078 from the weighted F
1
score of the
family code level.
5 DISCUSSION AND OUTLOOK
As our experiments show, our approach leads to a
model based on support vector machines which is
able to classify the given company data set with
weighted F
1
scores of 0.860 on GPC brick, 0.912 on
GPC class and 0.938 on family level. Further
experiments not reported here have shown that if the
top 3 prediction is considered - meaning that the
correct GPC code is among the three predictions with
the highest confidence - our model can achieve 95%
precision on brick level (Allweyer (2019)). For text-
based classification a simple learning algorithm
(SVM) with text representation (TF-IDF) was found
to be better than more complex algorithms and
representations. Lowercasing and removing special
characters improves the result, while omitting
numerals has a detrimental impact. Note that text pre-
processing has to be customer-specific, though.
Separator and abbreviation symbols may differ or
even overlap for other product data thus causing
additional challenges. The greatest potential for
increasing classification quality lies in using a bigger
set of training data. In this paper the data set consists
of about 150.000 products with a rather
heterogeneous structure which is not much compared
to most natural language processing approaches in
literature. Special consideration should be paid to
balancing categories regarding their member product
amount. Extracting attributes from product names
using named entity recognition and the impact of their
use as additional features is another avenue of
research which should be followed. Adding an
improved abbreviation dictionary in order to expand
abbreviations into full words could also help.
For the embedding of an automated classifier in a
retail environment, other factors such as training and
test duration, memory demands, maintainability and
interpretability are also aspects to consider. In order
to provide a reliable and comprehensible software,
the classifier should not be used as a black box but
rather be integrated in a system containing a reference
data base with verified products, a list of known
exceptions and special cases and a quality monitor.
Another point is the question which level of precision
Classification of Products in Retail using Partially Abbreviated Product Names Only
75

the customer requires and whether omitting
categories with only a few member products is
acceptable. In order to investigate the real-world
relevance more closely, we suggest using the model
first in a semi-automated process where categories are
proposed to the user. Based on the user decisions, the
model can then be further optimized and the degree
of automation can be increased. Apart from
classifying new products, our approach can also be
used for reclassification an already classified product
data base into a different classification system.
In summary, our results have shown that the
classification of food products can be carried out
during the initial product data generation step using
only the product name. Standard algorithms are
capable of achieving satisfying results without the
need for hyper-specialized and difficult to optimize
models. Our work can be extended to products from
other segments like clothing or consumer electronics.
Further research is needed to answer the question
whether a model covering products from all segments
is better than a compartmentalized approach with one
separate model for each segment.
ACKNOWLEDGEMENTS
The authors would like to thank the German Federal
Ministry of Education and Research for supporting
their work through the KMU-innovativ programme
under grant number 01—S18018.
REFERENCES
Allweyer, O. (2019). Entwicklung maschineller Lern-
verfahren zur Klassifizierung von Produktdatensätzen
im Einzelhandel, Master thesis, University of Applied
Sciences Trier.
Cevahir, A. and K. Murakami (2016). Large-scale Multi-
class and Hierarchical Product Categorization for an E-
commerce Giant. Proceedings of COLING 2016, 525–
535.
Chavaltada, C., K. Pasupa and D. R. Hardoon (2017). A
Comparative Study of Machine Learning Techniques
for Automatic Product Categorisation. Advances in
Neural Networks - ISNN 2017.
Chen, J. and D. Warren (2013). Cost-sensitive Learning for
Large-scale Hierarchical Classification of Commercial
Products. Proceedings of the CIKM 2013.
Cortes, C. and V. N. Vapnik (1995). Support-vector
networks. Machine Learning. 20 (3): 273–297.
Ding, Y., M. Korotkiy, B. Omelayenko, V. Kartseva, V.
Zykov, M. Klein, E. Schulten and D. Fensel (2002).
GoldenBullet: Automated Classification of Product
Data in E-commerce. Proceedings of BIS 2002.
GS1 Germany, Global Product Classification (GPC)
(2018). https://www.gs1-germany.de/ (02.03.20).
Ha, J. W., H. Pyo and J. Kim. (2016). Large-scale item
categorization in e-commerce using multiple recurrent
neural networks. Proceedings of the 22nd ACM
SIGKDD.
Hepp, M. and J. Leukel and V. Schmitz (2007). A
quantitative analysis of product categorization
standards: content, coverage, and maintenance of
eCl@ss, UNSPSC, eOTD, and the RosettaNet
Technical Dictionary, Knowledge and Information
Systems 13.1, 77–114.
Ho, T.K. (1995). Random Decision Forests. Proceedings of
the 3rd ICDAR, 278–282.
Jones, K. S. (1972). A statistical interpretation of term
specificity and its application in retrieval. Journal of
documentation, 28(1), 11–21.
Kohavi, R. (1995). A study of cross-validation and
bootstrap for accuracy estimation and model selection".
Proceedings of the 14th International Joint Conference
on Artificial Intelligence. 2 (12): 1137–1143.
Kozareva, Z. (2015). Everyone Likes Shopping! Multi-
class Product Categorization for e-Commerce.
Proceedings of the HLTC 2015, 1329–1333.
Maron, M. E. (1961). Automatic Indexing: An
Experimental Inquiry. Journal of the ACM. 8 (3).
Mikolov, T.; et al. (2013). Efficient Estimation of Word
Representations in Vector Space, arXiv:1301.3781.
Porter, M. F. (1980). An algorithm for suffix stripping.
Program, 14, 130–137.
Rosenblatt, F. (1958): The perceptron: a probabilistic
model for information storage and organization in the
brain. Psychological Reviews 65 (1958) 386–408.
Shankar, S. and I. Lin (2011). Applying Machine Learning
to Product Categorization. http://cs229.stanford.edu/
proj2011/LinShankar-Applying Machine Learning to
Product Categorization.pdf (02.03.20).
Scikit-Learn (2019). https://scikit-learn.org/ (02.03.20).
Song F., Liu S. and Yang J. (2005) A comparative study on
text representation schemes in text categorization
Pattern Anal Applic 8: 199–209.
Song, G.; et al. (2014). Short Text Classification: A Survey.
Journal of Multimedia.
Sun, C., Rampalli, N., Yang, F., Doan, A.. (2014) Chimera:
Large-Scale Classification using Machine Learning,
Rules, and Crowdsourcing. Proceedings of the VLDB
Endowment,Vol. 7, No. 13.
Taddy, M. (2019). Stochastic Gradient Descent. Business
Data Science: Combining Machine Learning and
Economics to Optimize, Automate, and Accelerate
Business Decisions. McGraw-Hill. 303–307.
Uysal, A. K., and Gunal, S. (2014). The impact of
preprocessing on text classification. Information
Processing & Management, 50(1), 104-112.
Vandic, D., F. Frasincar and U. Kaymak (2018). A
Framework for Product Description Classification in E-
Commerce. Journal of Web Engineering. 17, 1–27.
DATA 2020 - 9th International Conference on Data Science, Technology and Applications
76

Yu, H.-F., et al (2012). Product name Classification versus
Text Classification.
Yu, W., Z. Sun, H. Liu, Z. Li and Z. Zheng (2018). Multi-
level Deep Learning based E-commerce Product
Categorization. Proceedings of the SIGIR 2018.
Classification of Products in Retail using Partially Abbreviated Product Names Only
77
