
Evaluating Self-Service BI and Analytics Tools for SMEs
Antonio Oliveira
1a
and Jorge Bernardino
1,2 b
1
Polytechnic of Coimbra – ISEC, Rua Pedro Nunes, Quinta da Nora, 3030-199 Coimbra, Portugal
2
CISUC - Centre of Informatics and Systems of University of Coimbra, Pinhal de Marrocos, 3030-290 Coimbra, Portugal
Keywords: Self-Service Business Intelligence and Analytics, Business, Business Intelligence, Analytics, Metabase,
Pentaho Community, Power BI Free, QlikView, Tableau Public.
Abstract: In the vast Data Science domain, Business Intelligence (BI) and Data Analytics are two of the most relevant
topics nowadays. Regardless of the data type an end-user needs to work on, data visualization and/or analytics
can be a valuable support for a successful decision-making process in management. For that, free and open-
source business intelligence and analytics solutions are on the market as an indispensable opportunity for
companies to start benefiting from data analytics at no cost. In addition, that task has been currently eased by
a group of BI and Analytics tools named as “Self-service”, which is an Advanced Analytics topic and designed
to enable users with no IT background to perform analyses of data and find business opportunities themselves
with minimal or no assistance from IT technicians. Considering that, to help Small and Medium-sized
Enterprises (SMEs) decide on a free self-service data tool according to their needs, we compare in this paper,
on a functionality basis, 5 popular Self-Service BI and Analytics tools: Metabase, Pentaho Community, Power
BI Free, QlikView, and Tableau Public.
1 INTRODUCTION
Self-Service Analytics Software allows business
users to analyse data to find business opportunities
without an IT background. These technological
applications are an approach to advanced analytics.
They ensure that users can easily benefit a lot from
their business data without necessarily possessing
statistical or technological background. Many
organizations have recognized the importance of
Self-Service Analytics Software, as they have been
using these computer tools for their processes (Pat
Research, 2019b).
Self-service Analytics belongs to the Business
Intelligence (BI) field and empowers line-of-business
professionals to build reports and queries on their
own with minimal support from IT specialists.
Additionally, Self-Service Analytics is represented
by BI tools, which have a slight learning curve and
offer uncomplicated data access through basic
Analytics and simplified underlying data models
(Gartner, 2020).
a
https://orcid.org/0000-0002-0078-1033
b
https://orcid.org/0000-0001-9660-2011
There are many features that makes Self-Service
Analytics Software important to organizations, and
some of them are: Data Gathering, Filters,
Visualizations, Reporting, Collaboration, Data
Analysis, Dashboards, Predictive and Real-time
Analytics, high ease-of-use for lower-skilled users,
Integration of Data, Natural Language Processing,
and Security. All that naturally in addition to the
software capabilities designed for the high-skilled or
more technical users (Pat Research, 2019b).
The most visible benefits of the features
mentioned above are predictive power for project
future trends and events to plan as soon as possible
for their effects. Thus, it is possible to discover
business opportunities which stimulates insights that
are invisible in not-yet-analysed data. Additionally,
urgent issues can be addressed with help of real-time-
analysis, and easier access to data about customers, as
the business will possess and analyse the data of their
customers itself, with no need to wait for industry
reports or other third-party sources of data
(Bernardino, 2011).
The more end-users can do BI and Analytics on
their own by performing, for instance, drill-
Oliveira, A. and Bernardino, J.
Evaluating Self-Service BI and Analytics Tools for SMEs.
DOI: 10.5220/0009820400890097
In Proceedings of the 17th International Joint Conference on e-Business and Telecommunications (ICETE 2020) - Volume 3: ICE-B, pages 89-97
ISBN: 978-989-758-447-3
Copyright
c
2020 by SCITEPRESS – Science and Technology Publications, Lda. All rights reserved
89

throughs/downs, customizable reports/ dashboards,
and ad-hoc calculations, the more decreases the IT
resource drain in the company freeing up then the IT
department for more strategic duties.
Self-Service BI and Analytics brings several
gains for companies (Greengard, 2015). Thus,
organizations can deal with decision-making by
empowering users with no IT skills to produce
valuable information through data science software.
Considering that, we have decided to search for the
most popular free and open-source Self-Service BI
and Analytics tools and evaluate them according to
criteria based on the available relevant features.
This work aims to make a comparative analysis of
existing functionalities in Self-Service BI and
Analytics solutions to help small and medium
enterprises adopt a software solution adequate to their
needs and budget. We also believe it is beneficial to
promote information about BI and Analytics
solutions, focusing on their great associated benefits.
The rest of this paper is organized as follows.
Section 2 contains Related Work. Section 3 describes
the five of most popular BI and Analytics tools.
Section 4 explains the Evaluation Criteria used in our
study. Section 5 presents a Comparative Analysis of
the tools. Finally, Section 6 presents the conclusions
and future work.
2 RELATED WORK
In 2016, McCafferty mentioned that through 2020,
according to the industry research, investment on
acquiring Self-service data tools would grow 2,5
faster than on traditional data tools, as those tools
were already helping significantly businesses adopt
the Do-it-yourself Analytics approach which enables
organizations to boost and improve the speed, ease-
of-use and quality of analytics efforts (McCafferty,
2016).
In 2015, Greengard concluded that over the last
decade Self-service BI and Analytics tools had
become a critical resource to help firms of all shapes
and sizes operate faster and smarter (Greengard,
2015).
3 ANALYTICS TOOLS
The initial idea of this work was to evaluate
preferably only open-source solutions rather than
proprietary ones. Then, we started by doing
exhaustive search on websites which list Self-Service
BI and Analytics solutions to build our top 5 tools for
evaluation. Curiously, that research revealed an
indeed reduced number of open source solutions. In
addition, almost all found open-source tools were not
recommended or well rated by distinguished research
companies such as Gartner or Predictive Analytics
Today, which base their reviews not only on customer
ratings but also on an unbiased methodology (Pat
Research, 2019a).
Considering the low number of found open-
source tools and to not evaluate only proprietary
solutions, we decided to build our top 5 solutions
including three most popular free but non-open
source solutions and two open-source ones, so that we
could check ourselves if there was no highly
competitive open-source alternatives. Thus, the
proprietary ones were Power BI Free, Qlik View and
Tableau Public. In addition, the open-source ones
were Metabase and Pentaho. The first one is free,
completely open source, referred as promising, and
has a good review on the Predictive Analytics
webpage (Pat Research, 2019c). The latter is highly
recommended by Gartner, but it is not totally free.
It is also worth highlighting that we could not
consider several of the various curated lists of top
Self-Service BI and Analytics found on the web.
Those lists tended to be of dubious value for self-
service solutions, as they indicated, for instance,
JavaScript libraries for adding interactive charts to a
website, what may not be of straightforward
implementation for end-users who need to visually
query data without having the specific IT skills.
In the following sections, we describe the main
characteristics of each solution. Besides that, major
advantages and limitations of each one are outlined.
3.1 Metabase
Metabase is a web-based, open-source visual query
and BI tool designed visualizations released in 2015
(Metabase, 2020b). It releases updates frequently and
is intended for companies of all sizes.
It is built and packaged as a Java jar file and can
be run anywhere if Java is available. It also provides
a binary Mac OS X application for installation or can
run on Docker (Metabase, 2020a). It is a server
application accessible to the entire company.
This platform is available under three types of
licences: Affero General Public License (AGPL),
which is free of costs, and other two versions,
Premium Embedding and Enterprise with acquisition
costs.
It addresses the vital, but less complex questions
that make up most day-to-day data analytics
ICE-B 2020 - 17th International Conference on e-Business
90
operations. In addition, it can organize information in
a central place and connects various interaction points
to perform data storytelling.
This software allows filter and/or group data,
without resorting to Structured Query Language
(SQL). Furthermore, it monitors questions created by
users to provide insights on the available data. These
questions can produce graphs and charts, and these
visualizable results can be saved and organized in
dashboards (Santos et al., 2019).
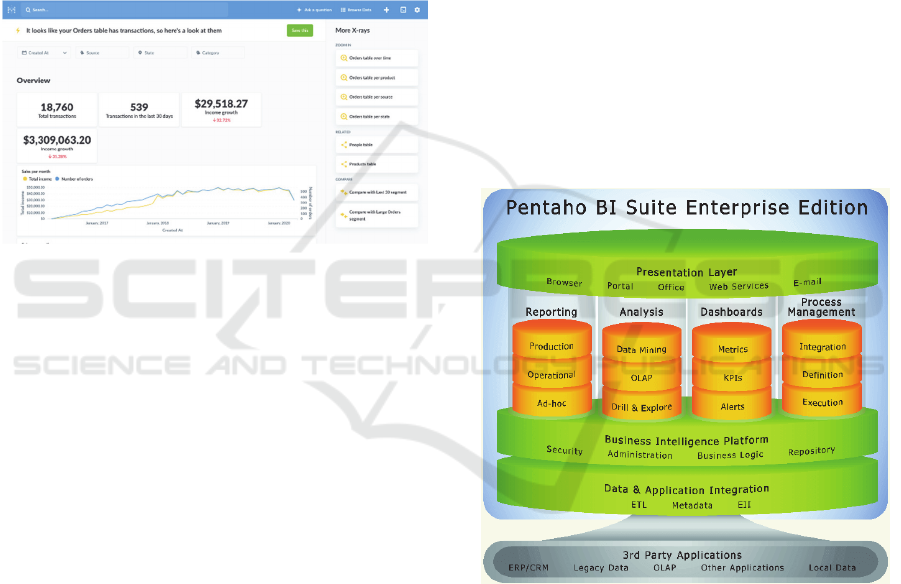
We can see in Figure 3 that the platform has a
clean user interface, where it is shown a screen related
to a feature which suggests some automated
explorations for newly connected data.
Figure 1: Metabase User Interface. (Source: https://www.
metabase.com/docs/latest/users-guide/images/x-rays/x-
rays-browse.png).
The most expensive license includes features such
as white labelled embedding, row level permissions,
and auditing tools. Following we have some strengths
and weaknesses of it (Pat Research, 2019c) (Do,
2018).
Advantages:
Rich dashboards with auto refresh and full
screen;
Clean user interface;
Supports numerous standard data sources;
Large choice of visualizations.
Limitations:
A server is necessary to maintain the
infrastructure;
Only Mac OS users can deploy it quickly
using a binary application;
Limited variety of charts and settings;
Weak permission control.
Metabase provides different ways to be deployed
anywhere, is constantly improving due a strong
community behind it for support and development.
3.2 Pentaho Community Edition
Pentaho is an open source suit of tools for Business
Analytics released in 2009 (Pentaho, 2015). It is one
of the first open source solutions of its type and it is
frequently updated. It runs on Windows, Linux or
Mac OS and is designed for companies of all sizes.
It provides analytics for several user roles, from
visual data analysis for business analysts to tailored
dashboards for executives. It features ad-hoc analysis
and visualization, data visualization, On-line
Analytical Processing (OLAP) services, custom
dashboard creation, data mining and report designer.
Furthermore, it supports multiple Big Data
integration/analytics and offers mobile business
analytics (Pentaho, 2013).
As can be seen in Figure 1, the platform has an
architecture divided into two main layers:
Presentation and ETL. The first one contains tools for
reporting, analyses, dashboards and process
management, whereas the ETL is designed for
Extraction, Load and Transformation of data.
Figure 2: Architecture of the Pentaho Open BA Suite.
(Source: https://pt.slideshare.net/nvvrajesh/pentaho-bi-
suite-overview-presentation/8?smtNoRedir=1.).
Pentaho has a community and an enterprise
version, which are free and paid, respectively. The
key differences are the free version does not allow
mobile features, interactive reporting, and dashboard
designer. Moreover, it restricts access to some more
advanced functionalities within the free available
features for data integration and big data [13]. A few
advantages and limitations of Pentaho are mentioned
next.
Evaluating Self-Service BI and Analytics Tools for SMEs
91

Advantages:
Mature data access and data transformation
features;
Reporting is fast due to in-memory caching
techniques;
Easy integration with third party
applications, such as Google Maps;
It runs on almost all platforms: Android,
iPhone, iPad, Mac, Web-based, Windows.
Features regarding predictive analyses and
big data sources are present at no cost.
Limitations:
The type of graphs and layouts proposed for
some diagrams and charts are limited and
partly outdated.
One of the key Pentaho’s differentiators is the
strength of being supported by a large community,
due to its strong open source software roots.
Moreover, its mobile data discovery functionality
ensures users are productive no matter where they are.
SMEs with lots of different types of data and big data
sources are highly recommended to use Pentaho.
3.3 Power BI Free
Power BI is a free desktop proprietary Microsoft
platform released in 2011 (Wikipedia, 2019). It works
in conjunction with a cloud application that makes
possible to publish reports throughout the business.
Power BI can only be installed on Windows OS and
is updated every month. It is intended for small to
midsize organizations.
It has connections to several data source types,
interactive/sharable reports and dashboards for web
or mobile, and real-time data. Furthermore, it has the
same rich visualizations and filters as the paid
version, such as auto-detect to find and create data
relationships between tables, Python support, and a
natural language query feature. Additionally, it is
possible to save, upload and publish reports to the
web with a storage limit of 10 GB per user
(Techtarget, 2020).
As can be seen in Figure 2, the platform works in
an architecture divided into three layers: Business
Analyst tools (Excel and Power BI designer),
Microsoft Cloud to host reports and datasets, and
visualization media, which includes computer web-
browsers and mobile devices.
Figure 3: Power BI Architecture Overview. (Source:
https://yodalearning.com/tutorials/power-bi-architecture-
power-bi-security/).
It is worth mentioning that its other two types of
license, Pro and Premium, which are not free. These
licenses allow the ability to collaborate reports with
other Power BI users, analyse data in Excel, direct
query, more advanced analytics features, and the use
of the Power BI Report Server (Microsoft, 2020a).
Advantages:
Inexpensive to upgrade;
Wide range of custom visualizations;
Seamless integration with Excel;
Fast learning curve for basic functionalities.
Limitations:
Rigid about relationships between tables;
Bulky user interface;
Upload limit of 1GB per dataset;
Need to learn several Microsoft interrelated
solutions to take full advantage of it;
On-line report must be public to the Internet;
A few options to configure visualizations;
It uses DAX, a hard language to work with.
Power BI Free has available a huge number of
learning resources spread on the web. It has an active
community, over 70 numerous integrations and data
sources (Microsoft, 2020b). In addition, it is attached
to Microsoft, which is always investing resources into
it and working for new features and updates.
3.4 QlickView Free
QlikView is a robust proprietary desktop platform for
business discovery which offers a powerful free
version in terms of features. It was released in 2012
and is frequently updated (Qlik, 2020). Besides that,
it is suitable for companies of all sizes, allowing
installation only on Windows OS.
ICE-B 2020 - 17th International Conference on e-Business
92
This software is one of the major Tableau
platform competitors. Its free version has no
limitations in terms of time or functionality compared
with its paid edition.
It supports visual data discovery, reporting, ad-
hoc queries, dashboards, shareable reports, guided
model creation, mapping data, reporting and
scalability with data integration, various forms of data
presentation, and predictions with historical data.
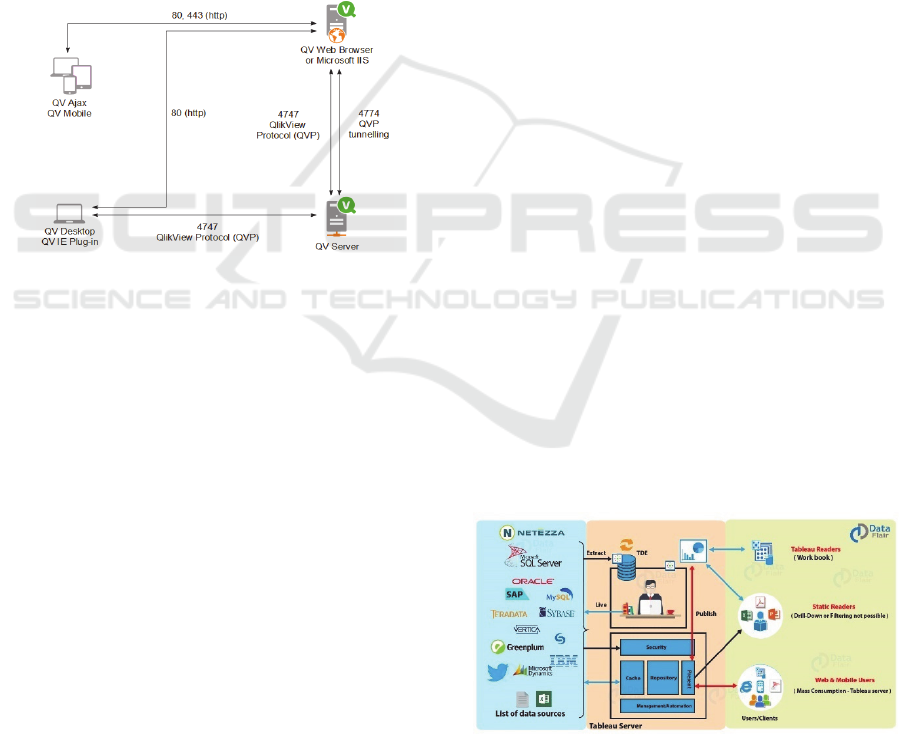
As can be seen in Figure 4, the platform’s
architecture is based on three main components: QV
Server (provides functionality to the client and must
run on a Windows OS), Client (web browser or an
application shell that provides a container for the
client code), and a Web Server (http server for pages,
user authentication, and communication between QV
Server and Client).
Figure 4: QlikView Architecture. (Source:
https://help.qlik.com/en-US/qlikview/November2017/pdf/
Deploying%20QlikView.pdf).
However, the files/documents created by a free-
license user cannot be opened on another computer or
shared with a user who has a paid license.
Advantages:
Fast user experience due to be a memory-
resident application;
Transparent reporting and scalability with
data integration;
Fast implementation.
Limitations:
Need of macros, duplication, and
maintenance of the QlikView objects for
formatted report;
It runs only on Windows OS;
Reloading can take a significant amount of
time as it loads most data into the system
RAM.
Qlikview is excellent in visually analysing data
relationships. Its in-memory engine recognizes
patterns in data that we are not normally able to do it
by using SQL alone (Kumar, 2019).
3.5 Tableau Public
Tableau is one of the oldest and most famous “self-
service” analytics platforms on the market. It was first
released in 2010. It is not open source, but it has a
commercially free platform and releases updates
frequently.
It must be installed on Windows or Mac OS to be
used in conjunction with the web free version. It
allows anyone to analyse data, create and publish
interactive data visualizations in the cloud.
It offers many of the same powerful visualization
capabilities as its paid desktop and server versions. It
has a variety of analytical methods, inspection and
manipulation of data in a variety of ways and even
analysis template creation. Interactive and shareable
dashboards can be distributed, depicting trends,
changes and densities in graphs and charts. In
addition, it allows data mixing, real-time
collaboration and data-analyses.
Data Analyse is possible from sources such as
Excel sheets for geographical visualizations, Gantt
charts, tree maps and other templates. The free
version has a limitation of 15.000.000 data rows per
workbook (Tableau, 2016).
As can be seen in Figure 3, the platform’s
architecture is categorized into two main segments:
Tableau server and Tableau desktop. There is a server
application to receive, treat, analyse, transform and
publish data and the desktop one to send data. Besides
that, the web and mobile clients to visualize analytics
outputs.
However, it is possible only to connect to Excel
sheets, text file formats, statistical files, Google
sheets, and web data connectors, which must be
uploaded to the cloud.
Figure 5: Tableau Architecture. (Source: https://data-
flair.training/blogs/tableau-architecture/).
Evaluating Self-Service BI and Analytics Tools for SMEs
93

Advantages:
Quick responsiveness;
Extensive training resources available for
free on the Tableau Public site;
Very intuitive user interface;
Dashboards can be viewed on multiple
devices like tablet, mobile and laptops;
Extensive community documentation.
Limitations:
To keep workbooks private, a paid
subscription is required;
Complex visualizations require time and
cost-intensive training.
Tableau Public is a very sophisticated and
advanced system. It surpasses other tools mostly in
data visualization. It provides an all-inclusive and
user-friendly data visualization experience (Tableau,
2020).
4 EVALUATION CRITERIA
First, we needed to create a list of essential
functionalities for a high-quality Self-Service BI and
Analytics solution. For that, we consulted the 15
Critical Capabilities of an Analytics and BI Platform
according to Gartner (Howson, Richardson, Sallam,
& Kronz, 2019).
However, we did not utilize criteria related to
Metadata Management, Scalability and Data Model
Complexity, Embedding of Analytic Content, and
Advanced Analytics for Citizen Data Scientists, once
they do not fit exactly the “Self-Service” concept
addressed in this paper, which relates mainly to basic
Analytics. Besides that, for the non-technical end-
users these capabilities will probably not weight when
they must decide themselves on a tool, considering
they require more than basic background in Analytics
to be properly explored.
Moreover, the functionalities/criteria list relates
to the capabilities recommended by Gartner, but it is
written in a way intended to be of more
straightforward understanding and reference. To
confirm the relevance of the chosen features, we also
checked the criteria list present on the Predictive
Analytics Today Research website (Pat Research,
2019b). We explain the selected features ahead.
As self-service analytics deals sometimes with
confidential data, Access Control and Security is an
essential feature through the implementation of user
permission levels.
Following we have Ad-hoc Reporting, which
allows reports to be created by end users by adding or
removing dimensions/expressions from the datasets.
Ad-hoc query is useful when end users need to create
queries on their own for questions that cannot be
solved by predefined queries. Cloud Services refers
the capability to perform data analysis using a cloud
version of the software.
When it comes to visualize data, the more we can
visualize data in different ways, the more data
visualization becomes interesting and attractive.
Thus, we chose the Data Visualization variety
feature.
Data Integration refers the capability to integrate
with several different data sources. The higher the
number of supported data sources, the better.
Dashboard Designer is the functionality for creation
of customized business dashboards from scratch.
Those panels will contain the graphs and charts
selected by the end-user.
Interactive visualization enables data
exploration manipulating chart images, colour,
brightness, size, shape and motion of visual objects in
BI dashboards.
Mobile capabilities are a great advantage, as by
making use of mobile devices capabilities, it is
possible to perform Data Analytics anywhere and
anytime, increasing consequently productivity.
Natural language queries are a trend and mean
that software can query data also by semantics and
natural language inputs.
OLAP stands for Online Analytical Processing. It
enables us to perform quick queries and calculations
from different measures/dimensions such as, sales
figures, budgets and quantities sold. That in different
degrees of detail and according to the end user needs.
Predictive Analytics ensures the tool can analyse
data and forecast trends and events.
Real-time Analytics is related to performing
analyses on data in real time, as data streams are
arriving.
Real-time collaboration allows team members
to share dashboards and reports not just for
visualization but also for edition.
Report customization allows the generation of
formatted and interactive reports. With Report
Scheduling we can schedule the generation and
distribution of reports.
5 COMPARATIVE ANALYSIS
Based on the technical specifications of the
Self-Service BI and Analytics platforms available on
ICE-B 2020 - 17th International Conference on e-Business
94

the market and analysed according to the criteria
defined in Section 4, we built a comparative table on
the availability of respective capabilities, taking into
account their characteristics.
The following table is intended as an aid to
selecting the most suitable “Self-Service” platform to
an organization, depending on its needs. It reveals
what each tool can perform and shows an option that
fits into the particularities of organizations. It is worth
mentioning that we focused on the free versions of
each tool. Thus, the paid capabilities are not checked
in the table.
Table 1: Functionalities considered to be essential for a BI
and Analytics solution.
Functionalities / Criteria
Self-Service BI and
Analytics Platforms
Pentaho
Power BI Free
Metabase
QlikView
Tableau Public
Access Control and
Security
Ad-hoc reporting
Ad-hoc query
Cloud Services
Data Visualization variety
Data Integration
Dashboard Designer
Interactive Visualization
Mobile capabilities
Natural Language Query
OLAP
Predictive Analytics
Real-time Analytics
Real-time Collaboration
Report customization
Report Scheduling
We can see in Table 1 that all tools are able to
deliver “Data Visualization” and “Access Control and
Security”. However, Security, depending on the
required data confidentiality degree, is compromised
for Power BI Free and Tableau Public, as all the
visualization works must be published and public to
the entire web. We should clarify that they remain
checked in Table 1 for the referred tools because the
access to the Self-service BI software and its original
workbooks remain restricted to the user who created
the project.
Pentaho is a consolidated open-source product on
the market. However, it lacks most free features when
compared to the other tools here under evaluation.
Power BI showed to be the most complete free
option, not offering just “Real-time collaboration”. In
addition, the “Real-time Analytics” feature refreshes
the data visualization only every 30 minutes.
Metabase revealed to be more for data
visualization and lacks many features, but the tool has
seamless connection to third party tools to
compensate those missing capabilities.
Qlikview also presents a very complete set of free
features and misses just “Cloud Services”, “Natural
Language Query”, “Real-time Analytics”, and “Real-
time Collaboration”.
Tableau Public lacks just in three free features.
Among them is “Report customization and
scheduling”, what causes surprise, as such
functionality, except for the scheduling feature, is
easily found at no cost in several other free tools.
All the solutions work at least in 8 different
languages, can connect to at least 11 types of data
sources, and none of them offers scheduling for the
Report Customization and Schedule functionality.
The cloud services offered by the free versions of
Power BI and Tableau are designed to allow mainly
visualizations of the work done locally on a desktop.
As for “Mobile capabilities”, Power BI Free offers
a mobile application for visualizations, while
QlikView and Tableau Public allow the same but just
through mobile web-browsers and the dashboard
and/or reports need some pre-configuration to be
displayed correctly on mobile devices.
From the tree tools with more functionalities
checked in Table 1, Power BI Free stands out in
features such as “Ad-hoc Reporting” and “Predictive
Analytics” due to its higher easy-of-use compared to
the other tools, being the only one to feature “Natural
Language Query” at no cost. Tableau is overall so
powerful as Power BI, but its user interface is less
intuitive. QlikView seems to be less “self-service”,
once it looks more traditional and technical than the
other two mentioned tools, being so naturally less
intuitive and requiring end users already more used to
Data Analytics.
6 CONCLUSIONS AND FUTURE
WORK
We can conclude Self-Service BI and Analytics tools
can cause a significant positive impact inside SMEs
by empowering line-of-business end users to take
important decisions based on queries and data
analyses made by themselves. Further, it also saves
time for the organization’s Information Technology
Evaluating Self-Service BI and Analytics Tools for SMEs
95

(IT) teams, who would have otherwise to still spend a
considerable length of time with basic Analytics for
the referred end users. Instead, these teams can focus
on other tasks that will permit the organization to
achieve more strategic goals.
The selection process of the best suited “Self-
Service” platform to an organization will depend on
many factors like the available financial, human and
material resources. However, the vision that the top
managers have to the organization will be also
essential for that, once the SMEs should understand
that the investment of time to learn how to use those
platforms means higher likelihood of new business
opportunities and profits, even if they have to pay for
training resources, consulting and licenses.
From our analysis, we conclude that Self-Service
BI and Analytics are gaining more and more space on
the market as they have evolved in features and
quality. From the 5 tools analysed, we cannot define
which one exactly occupy the first position in our top
5, because that also depends on an enterprise’s
requirements.
Considering just the number of free features, we
could conclude that Power BI Free, QlikView and
Tableau Public are ahead and have more to offer at no
cost for SMEs. However, if we had considered paid
capabilities, that tool ranking would naturally change,
as all tools, except for Metabase, would have nearly
all functionalities checked in our comparative table.
As future work, we intend to perform a
comparative analysis of other relevant Self-Service
BI and Analytics solutions to make available a wider
set of them for choice by the SMEs according to their
requirements. Additionally, an experimental
evaluation by watching them in production in a real
enterprise environment.
REFERENCES
Bernardino, J. (2011). Open source business intelligence
platforms for engineering education. In SEFI Annual
Conference 2011 (pp. 693–698). European Society for
Engineering Education (SEFI).
Do, A. T. (2018). Top 5 Free or Affordable SQL Reporting
and Dashboard Tools. Retrieved November 25, 2019,
from https://www.holistics.io/blog/top-5-free-or-
affordable-sql-reporting-and-dashboard-tools/
Gartner. (2020). Self-service Analytics. Retrieved January
11, 2020, from https://www.gartner.com/en/
information-technology/glossary/self-service-analytics
Greengard, S. (2015). Self-Service BI and Analytics Help
Firms Succeed. Baseline, 1. Retrieved from
http://search.ebscohost.com/login.aspx?direct=true&d
b=bth&AN=111935098&site=eds-live
Howson, A. C., Richardson, J., Sallam, R., & Kronz, A.
(2019). Magic Quadrant for Analytics and Business
Intelligence Platforms. Retrieved February 19, 2020,
from https://www.gartner.com/doc/reprints?id=1-
68720FP&ct=190213&st=sb
Kumar, A. (2019). Comparison of Tableau Vs QlikView |
QlikView Tableau Differences. Retrieved January 22,
2020, from https://www.knowledgehut.com/blog/
business-intelligence-and-visualization/tableau-vs-
qlikview
McCafferty, D. (2016). How Business Benefits From Self-
Service Analytics. CIO Insight. Retrieved from
http://search.ebscohost.com/login.aspx?direct=true&d
b=bth&AN=116225273&site=eds-live
Metabase. (2020a). Installing Metabase. Retrieved
December 2, 2019, from https://www.metabase.com/
docs/latest/operations-guide/installing-metabase.html
Metabase. (2020b). Metabase. Retrieved February 13,
2020, from https://www.metabase.com/releases
Microsoft. (2020a). Comparing Power BI Report Server
and the Power BI service - Power BI | Microsoft Docs.
Retrieved February 18, 2020, from https://docs.
microsoft.com/en-us/power-bi/report-server/compare-
report-server-service
Microsoft. (2020b). Data sources in Power BI Desktop -
Power BI | Microsoft Docs. Retrieved January 22, 2020,
from https://docs.microsoft.com/en-us/power-bi/
desktop-data-sources
Pat Research. (2019a). About PAT RESEARCH - PAT
RESEARCH: B2B Reviews, Buying Guides & Best
Practices. Retrieved December 14, 2019, from
https://www.predictiveanalyticstoday.com/about/
Pat Research. (2019b). How to Select the Best Self Service
Analytics Software for Your Business - Compare
Reviews, Features, Pricing in 2019 - PAT RESEARCH:
B2B Reviews, Buying Guides & Best Practices.
Retrieved November 25, 2019, from
https://www.predictiveanalyticstoday.com/self-
service-analytics-software/
Pat Research. (2019c). Metabase - Compare Reviews,
Features, Pricing in 2019 - PAT RESEARCH: B2B
Reviews, Buying Guides & Best Practices. Retrieved
November 25, 2019, from https://www.predictive
analyticstoday.com/metabase/
Pentaho. (2013). Pentaho Business Analytics. Retrieved
December 6, 2019, from https://www.utensio.com/wp-
content/uploads/2019/06/pentaho-business-analytics-
platform-datasheet.pdf
Pentaho. (2015). Pentaho Release Product Version Matrix -
Pentaho Engineering - Pentaho Wiki. Retrieved
February 13, 2020, from https://wiki.pentaho.com/
display/PEOpen/Pentaho+Release+Product+Version+
Matrix
Qlik. (2020). Released QlikView versions including build
number. Retrieved February 13, 2020, from
https://support.qlik.com/articles/000003216
Santos, B., Serio, F., Abrantes, S., Sa, F., Loureiro, J.,
Wanzeler, C., & Martins, P. (2019). Open source
business intelligence tools: Metabase and redash. IC3K
2019 - Proceedings of the 11th International Joint
ICE-B 2020 - 17th International Conference on e-Business
96

Conference on Knowledge Discovery, Knowledge
Engineering and Knowledge Management, 1, 467–474.
https://doi.org/10.5220/0008351704670474
Tableau. (2016). Tableau Public Frequently Asked
Questions |Tableau Community Forums. Retrieved
January 5, 2020, from https://community.tableau.com/
docs/DOC-9135#subhead20
Tableau. (2020). What is data visualization? A definition,
examples, and resources. Retrieved January 22, 2020,
from https://www.tableau.com/learn/articles/data-
visualization.
Techtarget. (2020). What is Microsoft Power BI? -
Definition from WhatIs.com. Retrieved February 18,
2020, from https://searchcontentmanagement.tech
target.com/definition/Microsoft-Power-BI
Wikipedia. (2020). Power BI – Wikipédia, a enciclopédia
livre. Retrieved February 13, 2020, from
https://pt.wikipedia.org/wiki/Power_BI.
Evaluating Self-Service BI and Analytics Tools for SMEs
97
