
Human Factors Assessment of Scenario-driven Training in
Web-based Simulation
Bharvi Chhaya
1
, Shafagh Jafer
1
and Stephen Rice
2
1
Department of Electrical, Computer, Software, and Systems Engineering, Embry-Riddle Aeronautical University,
1 Aerospace Boulevard, Daytona Beach, U.S.A.
2
Department of Human Factors and Behavioral Neurobiology, Embry-Riddle Aeronautical University,
1 Aerospace Boulevard, Daytona Beach, U.S.A.
Keywords: Simulation Training, Usability Testing, Subjective Workload Measures.
Abstract: Usability testing of products has commonly been used to test desktop applications, websites, online tools, and
various types of learning platforms. This paper discusses usability and workload testing for a portable training
simulation technology for Air Traffic Control (ATC) trainees. The NASA-TLX (Task Load Index) was
developed for the purpose of measuring user subjective workload, and is useful for a variety of tasks, including
online or computer-based training sessions such as the one being described in this paper. This
multidimensional assessment tool rates users’ perceived workload, which is then correlated with other aspects
of performance such as accuracy, speed, response times, etc. At the conclusion of the human factors
experiment, the data indicated that participants found the simulation software to be relatively easy to learn
and use, and did not experience high workload while using it.
1 INTRODUCTION
Usability testing of products has commonly been used
to test desktop applications, websites, online tools,
and various types of learning platforms. It has
traditionally been conducted in the restricted setting
of the laboratory, where potential external variables
and other confounds can be controlled for in order to
prevent loss of internal validity. This allows the
developers to maintain stable environmental factors
and restrict the amount of social influences that might
impact users and their performance.
Scenario-based training and particularly scenario-
oriented exercising is highly valuable in training
professionals who will operate under sensitive and
risky environments. Pilot and air traffic controller
training programs highly benefit from modeling and
simulation where trainees are provided with realistic
but simulated scenarios to master their knowledge
and learn in a risk-free environment (Updegrove &
Jafer, 2017). While scenario-based training is
currently used in full fidelity simulators for trainees,
this technology is not readily available in a portable
environment, so studies on the usability and
advantages of such scenario-driven training are
limited.
This paper aims to describe a case study detailing
the human factors assessment of the use of a web-
based scenario-driven simulation training
environment for air traffic control (ATC).
2 BACKGROUND
The training technology used as the tool for the case
study has been described in detail in this section along
with the measures being used to determine usability
as well as stress and workload undertaken.
2.1 ATC Scenario Training Technology
(ASTT)
Simulation-based training and particularly scenario-
oriented exercising is highly valuable in training
professionals who will operate under sensitive and
risky environments. The performance and realism of
any simulation requires a clearly-defined scenario
articulated with all involved factors. Any aviation
related simulation scenario must be defined with clear
expression of the specification of initial and terminal
conditions, aircraft specifications, airport and
Chhaya, B., Jafer, S. and Rice, S.
Human Factors Assessment of Scenario-driven Training in Web-based Simulation.
DOI: 10.5220/0009820301890196
In Proceedings of the 10th International Conference on Simulation and Modeling Methodologies, Technologies and Applications (SIMULTECH 2020), pages 189-196
ISBN: 978-989-758-444-2
Copyright
c
2020 by SCITEPRESS – Science and Technology Publications, Lda. All rights reser ved
189

airspace configurations, significant events, failure
modes (if any), instructions, clearances, and the
environment, as well as the major actors, their
capabilities, behaviour and interactions over time
(Moallemi et al., 2018).
To develop training scenarios, domain experts
and software developers collaborate closely to bridge
the gap between the domain and the simulation world
(Chhaya, Jafer, Coyne, Thigpen, & Durak, 2018).
This often requires tremendous amount of effort and
manual work. One of the main challenges that
scenario-oriented training programs face is the lack of
diverse pool of scenarios. Limited variety of training
scenarios put trainees at the risk of unprepared
circumstances that might arise in the actual field. On
the other hand, the underlying simulation
infrastructure (bot software and hardware) hinders
trainees’ exposure to the training material, since
training could only take place in specialized
laboratories equipped with necessary technologies
and only under supervision/mentoring of an
instructor/lab technician (Cummings, 1970). The
above capabilities were recently developed for a
funded project for the FAA Academy En-route
Controller Training Program.
The ATC Scenario Training Technology (ASTT)
tool has been developed as a portable training
platform for ATC trainees (Shannon et al., 2018).
ASTT provides an online environment allowing
trainees to practice Air Traffic Control (ATC)
concepts at their own pace without the need to utilize
instructional lab space and instructor’s time. It
involves development of a training tool that emulates
En Route Automation Modernization (ERAM) and en
route lab interfaces. ASTT provides “instructor” and
“student” modes of operation, allowing for instructors
to monitor student performance, and providing
students with an on-demand training environment to
practice various en route scenarios. This technology
allows trainees to respond to a given scenario using
their acquired skills and receive feedback on their
performance (B. N. Chhaya et al., 2019). ASTT is a
high-fidelity web-based simulation tool for practicing
ATC en route scenarios utilizing interactive
computer-based system replicating the actual En
Route Automation Modernization or ERAM ATC
system.
The ERAM system requires coordination between
two controllers managing the same space and looking
at two different monitors: (1) the Radar-Position (R-
Position) which contains an interface with a radar
display, and (2) the Radar Associate-Position (RA-
Position) which has an interface to the ERAM
Decision Support Tool (EDST) (Richard et al., 2019).
The R-Position interface shows the data blocks of
all flights within the sector airspace and in its
immediate surroundings, as well as trailing lines. An
image of this interface screen can be seen in Figure 1.
The data blocks can be expanded if needed and show
details such as the aircraft ID, speed, sector control
and other remarks.
Figure 1: View of ASTT R-Position interface. It shows the
radar screen with the airspace and aircraft within it along
with flight properties.
The RA-Position lets the radar associate look at
several screens, including the radar screen pictured in
Figure 1, along with a list of all flights, altitudes,
directions, routes and remarks. EDST warns the
associate in the event of potential issues such as an
Inappropriate Altitude for Direction of Flight
(IAFDOF) or varying levels of conflict alerts. It also
gives the controller the option to edit any of the fields
or to trial plan a change in altitude or route (Richard
et al., 2019). An image of this interface screen can be
seen in Figure 2.
Figure 2: View of ASTT RA-Position Interface. It allows
the controller to see the radar screen, a list of flights and to
communicate changes to the flight plan.
The controller interacts with the screen using a
virtual keyboard that is identical to the ERAM
keyboard to avoid confusion because the keys are
different from those on a standard keyboard attached
to the computers running ASTT. This virtual
keyboard can be seen in Figure 3.
SIMULTECH 2020 - 10th International Conference on Simulation and Modeling Methodologies, Technologies and Applications
190
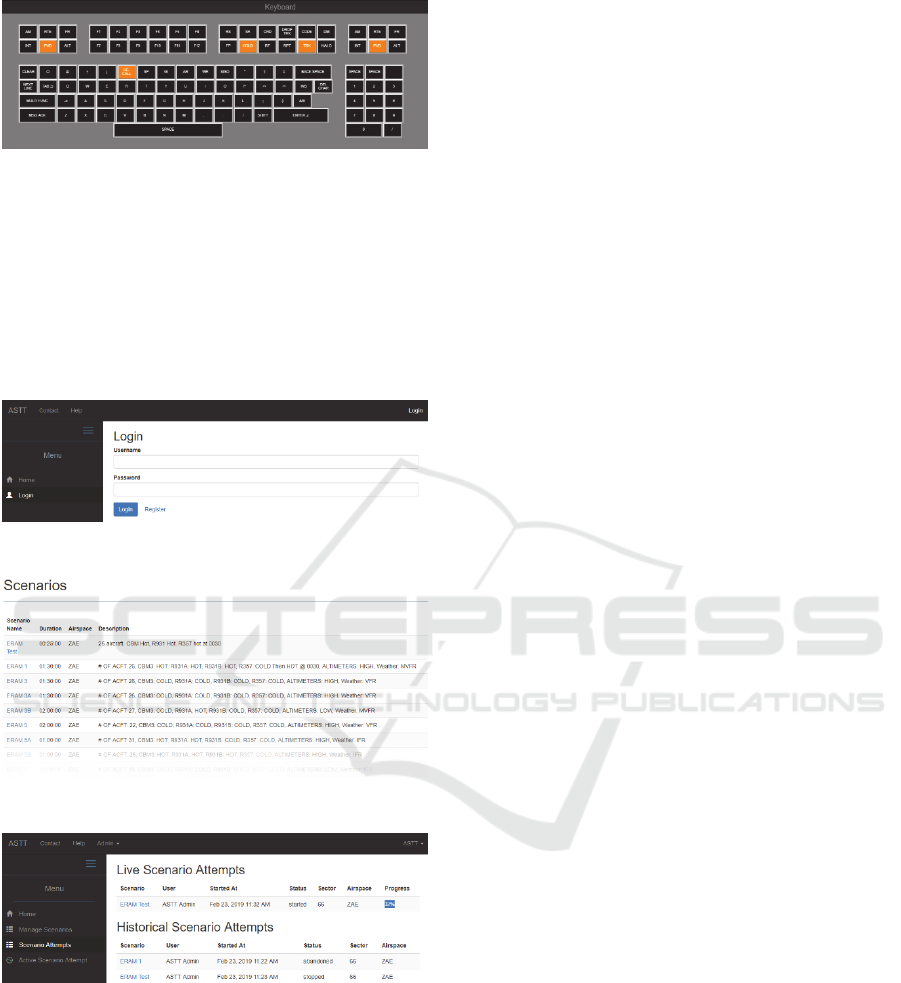
Figure 3: View of ASTT virtual keyboard.
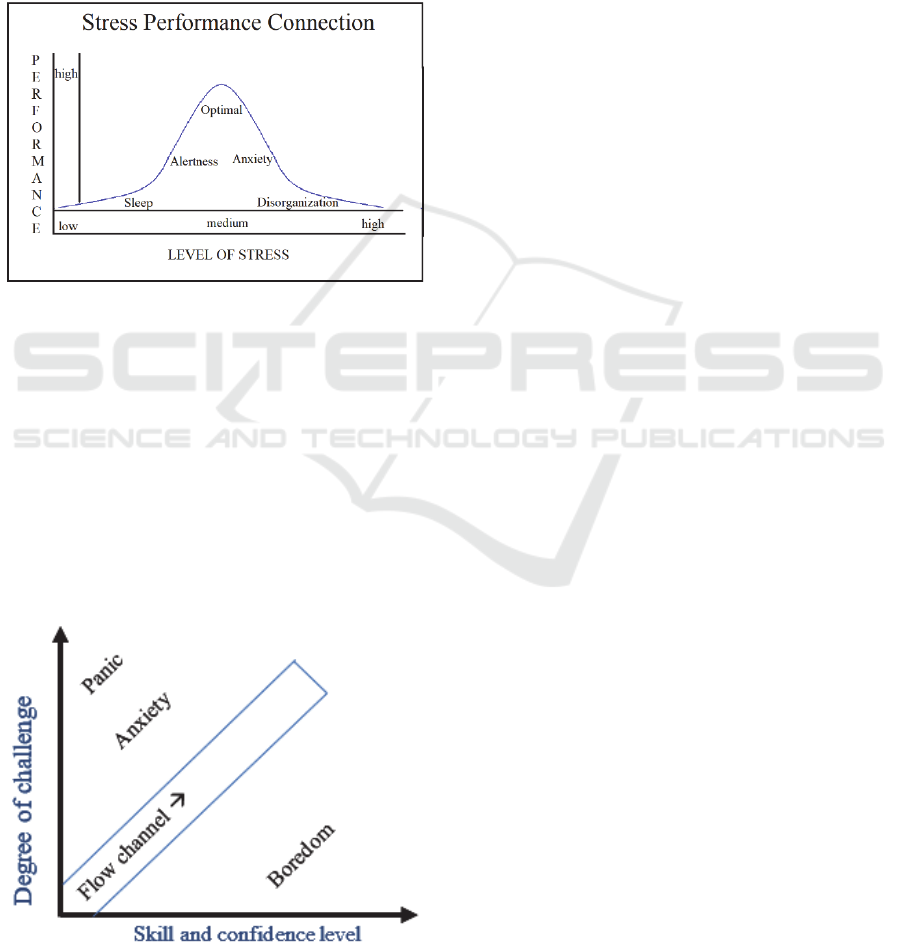
Upon navigating to the tool through the web, the
users are first greeted with a login screen as seen in
Figure 4. Once their credentials have been
authenticated, they can access a list of scenarios they
are able to run as seen in Figure 5. At the conclusion
of any attempt, they can check their attempt history in
order to get feedback on their attempt. This screen is
shown in Figure 6.
Figure 4: ASTT login screen.
Figure 5: ASTT scenario selection screen.
Figure 6: ASTT scenario attempt history screen.
In order to simulate real-time air traffic for the
scenarios, ASTT uses accurate Flight Dynamic
Models of several aircraft, each of them including
simulated Flight Management System (FMS) and
autopilot capable of steering the aircraft per the
aircraft published flight profile (Richard et al., 2019).
The simulated FMSs are capable of storing flight
plans using 4D waypoint trajectories (latitude,
longitude, altitude, and time constraints).
2.2 Usability Testing
There are several types of usability tests that can be
conducted. The most common type is the problem
discovery test, where the goal is to uncover (and
potentially fix) all the usability problems that are
detected at this stage. This test should be done early
on in the development process, but can also be done
later in the process. Once the problems are found and
the new design is developed, then a benchmark study
can be used to determine if those changes actually
made the interface easier to use. Once it is determined
that the interface is easier to use, then a competitive
test can be conducted to compare the new product to
existing ones. Most usability studies assess first-time
use, so a follow-up learnability study might be useful
to ensure that users can easily learn how to use the
product and can accomplish certain long-term tasks.
This is particularly useful for training platforms,
where users may log in repetitively over time during
the training course.
For these assessment tests, there are typically a
combination of methods employed. Some of these
methods are designed to capture physical
measurements, and can include, but are not limited to,
video recording, logged keystrokes, mouse
movements, body movements, etc. Other methods
might include physiological measures, including
pupil dilation, heart rate, cortisol levels, O2 levels,
etc. Another approach is to collect performance
measures such as time to complete a task, number of
errors, number of navigations needed, number of false
starts, etc. Lastly, measures of subjective workload
are important in order to capture how much stress and
workload the user is experiencing while interacting
with the product. This paper will be focusing on this
last measure.
2.2.1 Stress and Workload
Stress is a state of mental or emotional strain or
tension resulting from adverse or very demanding
circumstances (Roscoe, 1978). Stress and workload
typically correlate during training periods. Users feel
under a certain amount of stress from the training
itself, and workload can be unnecessarily increased
by poor design. Additional stress can also be
generated by environmental factors, such as heat,
cold, motion, air quality, etc. Psychological stressors
may include cognitive appraisal (a person’s
understanding or interpretation of the situation), level
of arousal (often measured by heart rate, pupil
diameter, hormonal chemistry, etc.), and tunneling (a
user’s tendency to focus solely on one task).
Human Factors Assessment of Scenario-driven Training in Web-based Simulation
191
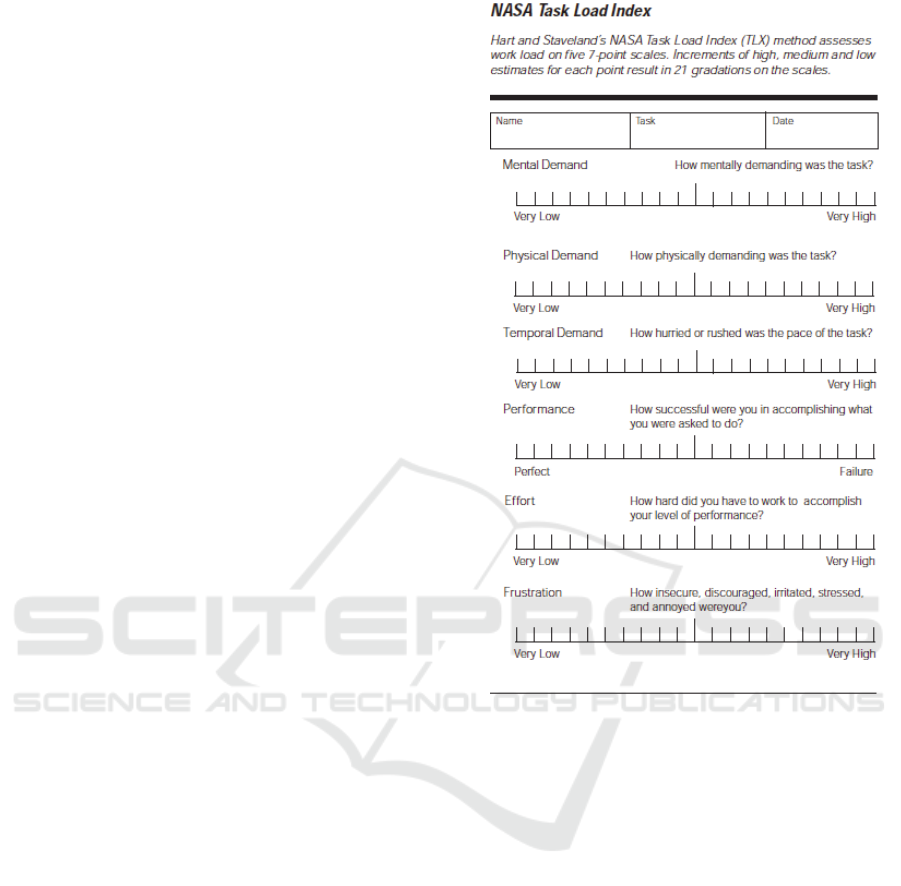
While some stress is advisable, having too little or
too much stress can lead to poor performance. Figure
7 shows the Yerkes-Dodson Law (Teigen, 1994),
which posits that the ideal amount of stress is
somewhere in the middle of the user’s potential stress
levels. Having too much stress can lead to anxiety and
disorganization, while having too little stress can lead
to loss of alertness and even sleepiness due to
boredom. It is important to note that when the task is
difficult, the stress levels need to be somewhat higher
than they would be if the task is easy.
Figure 7: Graphical depiction of Yerkes-Dodson Law
(Teigen, 1994).
When stress is at its optimal level, then workload
is not adversely affected, and users will tend to put
forth their best effort. The amount of workload that
users should be under depends largely on the task;
however, it is critical to note that a good design does
not necessarily attempt to eliminate workload. In fact,
Csikszentmihalyi (1990) has shown that it is
important to match a user’s workload level with that
user’s skill level.
Figure
8 shows a graphical representation of this
concept.
Figure 8: Csikszentmihalyi’s (1990) flow model.
Here we see that when the user does not have the
skills necessary for the task, then a challenging task
will result in anxiety and frustration, and can lead to
a user quitting the task prematurely. On the other
hand, when the user’s skills exceed the workload
required, the user can become bored and apathetic.
The goal is to make sure the user has the skills
necessary for the task, and that the task generates
enough workload to engage the user and keep the
flow channel open. This is similar to the concept of
athletes being “in the zone”.
2.2.2 NASA-TLX Subjective Workload
Measure
There are many ways of measuring workload,
including physiological measures such as hormonal
levels, pupil diameter, heart rate, sweat rate, etc.;
however, many of those measures do not capture
subjective workload as reported by the users
themselves. The NASA-TLX (Task Load Index) was
developed at NASA's Ames Research Center by the
Human Performance (Hart & Staveland, 1988;
NASA, 1986). This workload measure was developed
precisely for the purpose of measuring user subjective
workload, and is useful for a variety of tasks,
including online or computer-based training sessions
such as the one being developed at Embry-Riddle
Aeronautical University (ERAU). This
multidimensional assessment tool rates users’
perceived workload, which is then correlated with
other aspects of performance such as accuracy, speed,
response times, etc. It is one of the most well-known
and used self-report workload measures (Moroney et
al., 1995; Noyes & Bruneau, 2007). The
psychometric characteristics of the NASA-TLX are
well documented (Yurko et al., 2010), and it has been
used previously as a tool for subjective evaluation of
individual's workload in flight simulation (Nygren,
1991) and air traffic control studies (Metzger &
Parasuraman, 2005).
The NASA-TLX is composed of two parts. In the
first part, participants respond to six subscales that are
presented on a single page. These subscales include:
• Mental Demand. What is the required level of
mental and perceptual activity? How easy,
difficult, simple or complex was the task?
• Physical Demand. What is the required level
of physical activity? How slack or strenuous
was the task?
• Temporal Demand. How much time pressure
is felt by the user? Was the pace too slow or
too fast?
SIMULTECH 2020 - 10th International Conference on Simulation and Modeling Methodologies, Technologies and Applications
192
• Performance. How well does the user feel
that she or he did on the task? How satisfied is
the user with his or her performance?
• Effort. How hard did the user need to work in
order to accomplish the task? This can be both
physical and mental.
• Frustration. How much irritation, stress, or
annoyance was perceived by the user?
Prior to responding to the scale questions,
participants read the description for each subscale.
They then provide a score for each subscale by
choosing one of the gradations that range from Very
Low to Very High. The scores can range from 0 to
100 in 5-point gradations. Upon completion of the
NASA-TLX, user scores are then combined into an
overall score that measures perceived subjective
workload. Figure 9 provides the actual survey that is
given to users.
As with all measures of workload, and
particularly with subjective workload, there are some
caveats. First, the NASA-TLX relies on users
accurately giving their responses, and it assumes that
the users are being honest with themselves and with
the experimenter. Second, it relies on the users’
memory in order to accurately assess their workload.
This can be problematic, especially if the survey is
given some time after the task has ended. Third, the
survey cannot be given while a user is doing the task
in question, or else it becomes a dual-task situation.
This can be problematic if the user suddenly feels a
release of stress and frustration when the task is
placed to the side while they fill out the survey. They
may misperceive this reduction of stress as being part
of the task and provide an inaccurate assessment of
their subjective workload.
In order to avoid these issues, the NASA-TLX
was given to some participants immediately after
each task, and not just at the end of the overall
session. Participants were carefully instructed that
they should be rating their perceived workload during
the task itself and not their perceived workload of
taking the survey. Participants were also encouraged
to provide honest and well-thought out responses in
order to ensure validity.
3 CASE STUDY
This section details the case study for human factors
assessment of the subject workload of using a web-
based simulation tool for ATC. The methodology is
described first, followed by the results obtained along
with discussion.
Figure 9: NASA Task Load Index (NASA, 1986).
3.1 Methodology
The human factors approach to evaluating the
software comprises of measuring subjective
workload via the NASA-TLX survey. The NASA-
TLX is designed to capture subjective workload
measures and was used in our usability analysis. The
study was approved by ERAU’s Institutional Review
Board for the Protection of Human Subjects in
Research (IRB).
Participants: Eight ERAU students in the Air
Traffic Management (ATM) program were recruited.
These volunteers had an age range from 20 to 22.
Each volunteer had successfully passed en route
training in the ATM program. A one-time monetary
compensation was provided for participating in the
study.
Materials: The NASA Task Load Index shown
in Figure 9 was used for this study. Specifically, the
raw score values were collected and analyzed.
Human Factors Assessment of Scenario-driven Training in Web-based Simulation
193
Procedure: Participants were first given a
consent form to sign and were then provided with
instructions about the procedures of the study.
Following this, they were given a training session on
the new software that lasted about one hour. The
purpose of this training session was to ensure that the
participants understood what they were being asked
to do, and to give them time to become familiar with
the software. This was meant to represent the typical
training that they would receive at the Academy if
they were asked to use this software later in their own
spare time. All questions were answered prior to the
completion of the training session.
In the second part of this study, participants were
given a list of nine tasks that they were then to
complete using the new software. These tasks are
listed below:
[1] Log in to the ASTT system (Figure 4)
[2] Accessing available scenarios (Figure 5)
[3] Run any scenario
[4] Access the R (Figure 1) and RA (Figure 2)
positions on two separate windows
[5] Access the soft controller keyboard (Figure
3) on a separate device
[6] Understand and approve a departure request
[7] Understand and approve a pilot request
[8] End scenario attempt
[9] Access the scenario history page (Figure 6)
Five of the participants were asked to complete all
nine tasks prior to filling out the NASA-TLX form.
The purpose of this was to get a sense of the overall
subjective workload, and to avoid disrupting the tasks
until they were all completed. The other three
participants were asked to complete the NASA-TLX
after each task. The purpose of this was to determine
the subjective workload of each task, and participants
were asked to stop after each task and fill out the
subjective workload scale. While the scenarios
selected by the students were not the same and
covered different areas of training, they were all of a
similar duration which would be completed within a
single class period. All tasks required of the student
controllers were those they would be familiar with, so
while the comparison is not direct due to the nature of
the scenarios being different, the level of difficulty
and time taken is expected to be reasonably similar
for each of the scenarios offered to the students.
Upon completion of the study, participants were
debriefed, compensated and dismissed.
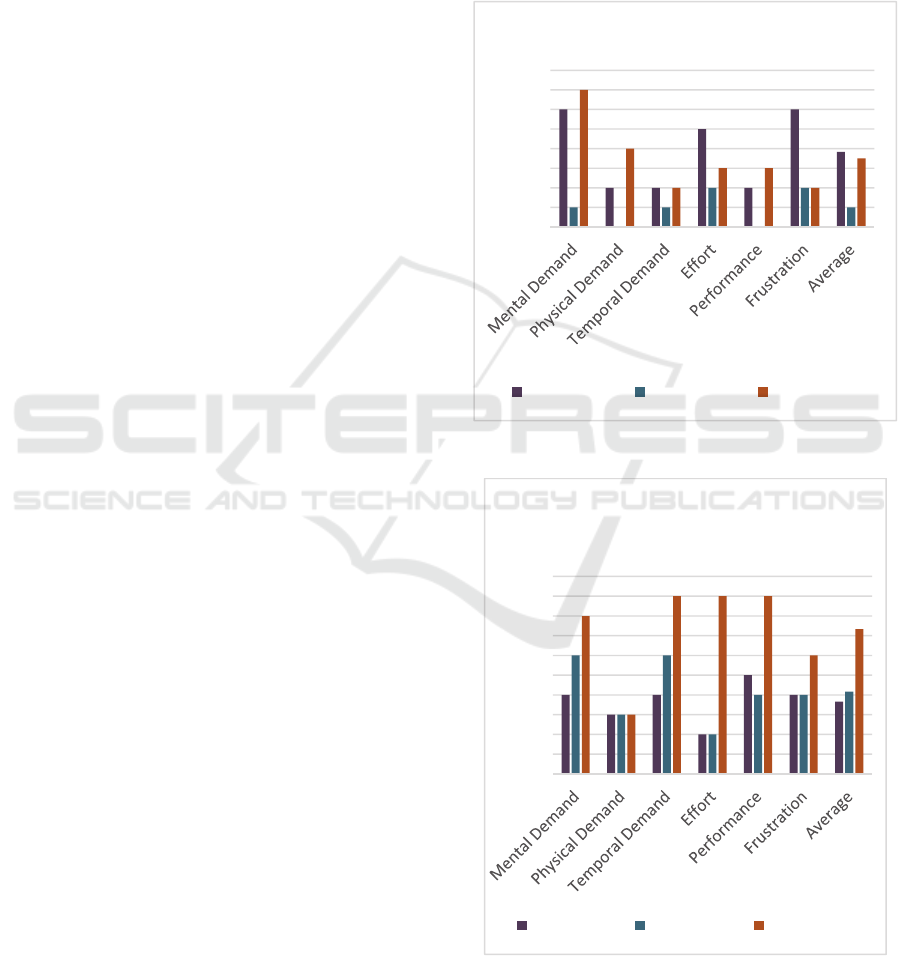
3.2 Results
The results of the subjective workload reports for the
three participants who completed the scale after each
task can be found in Figure 10 to Figure 13. These are
“Raw TLX” score values with a minimum value of 0
and a maximum value of 100. Lower scores indicate
lower perceived workload.
Figure 10: Raw TLX Data for Task 1.
Figure 11: Raw TLX Data for Task 4.
0
5
10
15
20
25
30
35
40
Participant1 Participant2 Participant3
0
5
10
15
20
25
30
35
40
45
50
Participant1 Participant2 Participant3
SIMULTECH 2020 - 10th International Conference on Simulation and Modeling Methodologies, Technologies and Applications
194
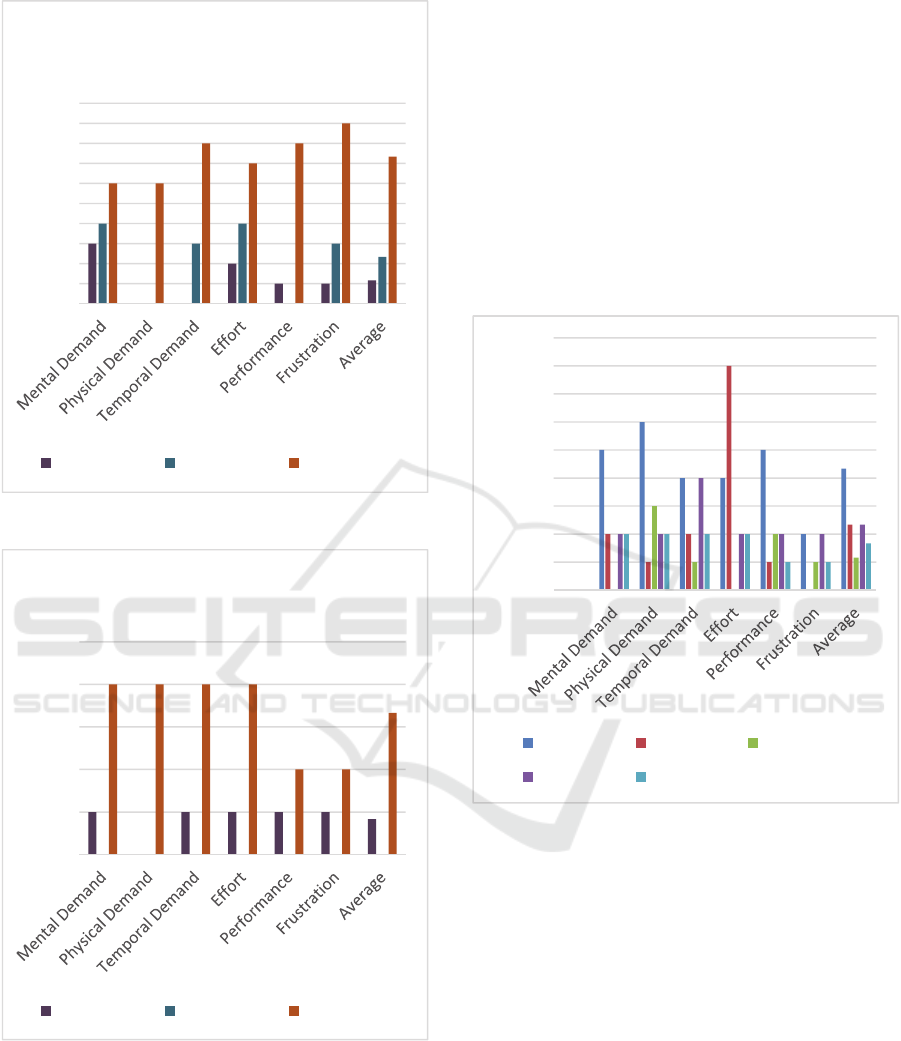
Figure 12: Raw TLX Data for Task 7.
Figure 13: Raw TLX Data for Task 9.
The overall average score for all nine tasks was
14.63, which is very low compared to the possible
highest score of 100. These scores ranged from 7.22
for Participant 2 to 25.37 for Participant 3. Thus, even
the highest score was in the bottom quartile for
subjective workload. The task with the highest
subjective workload appeared to be Task 6, with two
of the participants reporting scores over 35/100. Even
in this case, these scores seem very reasonable given
that participants only had one hour of training prior to
completing the assigned tasks.
The results of the subjective workload reports for
the five participants who completed the scale after
finishing all nine tasks can be found in Figure 14.
Here, we see that the average is 11.83, with a
range of 5.83 for Participant 6 to 21.67 for Participant
4. These scores indicate that the participants all
experience reasonably low subjective workload when
completing the assigned tasks, which is an indicator
that they found the software easy to learn and use.
Figure 14: TLX Results of Participants after Completing
Tasks.
4 CONCLUSIONS
Simulation-based training is highly valuable in
training professionals who will operate under
sensitive and risky environments. For this purpose,
the ATC Scenario Training Technology (ASTT) tool
was developed. This paper used the NASA-TLX tool
to understand users’ perceived workload for
computer-based training sessions using ASTT in
order to assess the human factors aspect of web-based
simulation training. The data from this study are
straightforward. When completing all nine sub-tasks,
participants then reported reasonably low subjective
workload on the NASA-TLX. When completing one
task at a time, participants also reported very low
0
5
10
15
20
25
30
35
40
45
50
Participant1 Participant2 Participant3
0
5
10
15
20
25
Participant1 Participant2 Participant3
0
5
10
15
20
25
30
35
40
45
Participant4 Participant5 Participant6
Participant7 Participant8
Human Factors Assessment of Scenario-driven Training in Web-based Simulation
195

subjective workload for most of the tasks. The highest
report workload score was for Task 6, with an average
score of 29.72.
These data indicate that participants found the
software to be relatively easy to learn and use, and did
not experience high workload while using it. They all
commented on the usefulness of the tool and how it
can actually aid them in learning the en route concepts
more effectively. They were mostly very excited
about the fact that the tool is available online and
allows them to practice at their own pace at any time
and from anywhere.
REFERENCES
Chhaya, B., Jafer, S., Coyne, W. B., Thigpen, N. C., &
Durak, U. (2018, January 8). Enhancing Scenario-
Centric Air Traffic Control Training. 2018 AIAA
Modeling and Simulation Technologies Conference.
https://doi.org/10.2514/6.2018-1399
Chhaya, B. N., Jafer, S., & Moallemi, M. (2019, January 7).
Evaluation of Scenario-Centric Training in ATC
Simulators. AIAA Scitech 2019 Forum. https://doi.org/
10.2514/6.2019-1483
Csikszentmihalyi, M. (1990). Flow: The Psychology of
Optimal Experience. Harper Perennial.
Cummings, R. J. (1970). Air Traffic Controller Training at
the FAA Academy. Training Technol.
Hart, S. G., & Staveland, L. E. (1988). Development of
NASA-TLX (Task Load Index): Results of Empirical
and Theoretical Research. Advances in Psychology,
52(C), 139–183. https://doi.org/10.1016/S0166-
4115(08)62386-9
Metzger, U., & Parasuraman, R. (2005). Automation in
future air traffic management: Effects of decision aid
reliability on controller performance and mental
workload. Human Factors, 47(1), 35–49.
https://doi.org/10.1518/0018720053653802
Moallemi, M., Jafer, S., & Chhaya, B. (2018, January 8).
Scenario Specification Challenges for Next Generation
Aviation Technology Demonstrations. 2018 AIAA
Modeling and Simulation Technologies Conference.
https://doi.org/10.2514/6.2018-1396
Moroney, W. F., Biers, D. W., & Eggemeier, F. T. (1995).
Some Measurement and Methodological
Considerations in the Application of Subjective
Workload Measurement Techniques. The International
Journal of Aviation Psychology, 5(1), 87–106.
https://doi.org/10.1207/s15327108ijap0501_6
NASA. (1986). TASK LOAD INDEX (NASA-TLX) v 1.0.
https://ntrs.nasa.gov/search.jsp?R=20000021488
Noyes, J. M., & Bruneau, D. P. J. (2007). A self-analysis of
the NASA-TLX workload measure. Ergonomics, 50(4),
514–519. https://doi.org/10.1080/00140130701235232
Nygren, T. E. (1991). Psychometric Properties of
Subjective Workload Measurement Techniques:
Implications for Their Use in the Assessment of
Perceived Mental Workload. Human Factors: The
Journal of the Human Factors and Ergonomics Society,
33(1), 17–33. https://doi.org/10.1177/0018720891033
00102
Richard, K., Shannon, C., Moallemi, M., Chhaya, B., Patel,
K., & Jafer, S. (2019). Smart web-based air traffic
control training technology. Integrated Communica-
tions, Navigation and Surveillance Conference, ICNS,
2019-April. https://doi.org/10.1109/ICNSURV.2019.
8735329
Roscoe, A. H. (1978). Stress and workload in pilots.
Aviation, Space, and Environmental Medicine, 49,
630–636. https://psycnet.apa.org/record/1980-26622-
001
Shannon, C., Jafer, S., Vardhan Raja, A., Moallemi, M., &
Thigpen, N. C. (2018). Software Challenges of a Web-
based Air Traffic Control Training Tool. 2018
IEEE/AIAA 37th Digital Avionics Systems Conference
(DASC), 1–8. https://doi.org/10.1109/DASC.2018.
8569233
Teigen, K. H. (1994). Yerkes-Dodson: A Law for all
Seasons. Theory & Psychology, 4(4), 525–547.
https://doi.org/10.1177/0959354394044004
Updegrove, J. A., & Jafer, S. (2017). Optimization of Air
Traffic Control Training at the Federal Aviation
Administration Academy. Aerospace, 4(4), 50.
https://doi.org/10.3390/aerospace4040050
Yurko, Y. Y., Scerbo, M. W., Prabhu, A. S., Acker, C. E.,
& Stefanidis, D. (2010). Higher Mental Workload is
Associated With Poorer Laparoscopic Performance as
Measured by the NASA-TLX Tool. Simulation in
Healthcare: The Journal of the Society for Simulation
in Healthcare, 5(5), 267–271. https://doi.org/10.1097/
SIH.0b013e3181e3f329
SIMULTECH 2020 - 10th International Conference on Simulation and Modeling Methodologies, Technologies and Applications
196
