
Toward a New Quality Measurement Model for Big Data
Mandana Omidbakhsh
and Olga Ormandjieva
Department of Computer Science and Engineering, Concordia University, Montreal, Canada
Keywords: Big Data V’s, Goal-driven Hierarchical Quality Modeling, Big Data Standards.
Abstract: Along with wide accessibility to Big Data, arise the need for a standardized quality measurement model in
order to facilitate the complex modeling, analysis and interpretation of Big Data quality requirements and
evaluating data quality. In this paper we propose a new hierarchical goal-driven quality model for ten Big
Data characteristics (V’s) at its different levels of granularity built on the basis of: i) NIST (National Institute
of Standards and Technology) definitions and taxonomies for Big Data, and ii) the ISO/IEC standard data
terminology and measurements. According to our research findings, there is no related measurements in
ISO/IEC for important Big Data characteristics such as Volume, Variety and Valence. As our future work we
intend to investigate theoretically valid methods for quality assessment of the above-mentioned V’s.
1 INTRODUCTION
It has been more than seventy years since the
“information explosion”, the term used to represent
the extensive growth rate of the volume of data
(Press, G., 2013). Through the time, storing,
retrieving and interpreting the large amount of data
which overwhelmed the storage devices, networks
and retrieval systems have been challenging.
However, recently the term Big Data has been coined
and with the advancement in data generation and the
increase of availability of data storage, Big Data
computing has been considered as one of the
prominent innovations in the last decade. The fruit of
this is promising in different aspects of life such as
detecting and preventing health problems,
individualization of precision medicine, spotting
business trends, determining quality of research,
determining real-time roadway traffic conditions and
etc. This allows Federal governments, business
leaders, and health care organizations to analyze and
visualize data effectively to make decisions. (Singh,
N. et al, 2013) (Agbo, B. et al, 2018).
In this paper, we focus on Big Data quality
measurement. In section 2, we first review the notion
of Big Data and its quality, the quality characteristics
of Big Data and the existing standards for Big Data,.
Then, in section 3, we introduce our hierrachical
quality measurement model for Big Data and in
section 4, we merge our model with the existing
ISO/IEC standards 25012 and 25024. Finally we
conclude and discuss our future work directions.
2 BACKGROUND AND RELATED
WORK
2.1 Notion of Big Data and its Quality
Big Data is defined in different ways. Some refer to it
as any collection of data which is difficult to be
managed. Some define it as the data that is too large
to process on a single server. However, “big”
(elusive) is not only referred to the size itself. “Big
Data” is an umbrella term referring to the overflow of
mostly unstructured digital data from millions of
heterogeneous sources,
such as ubiquitous sensors,
health records, etc. Big Data’s volume and
heterogeneity contribute
extensively to the
complexity of its engineering processes (Oussous, A.,
et al., 2018).
The above complexity makes it challenging for
data engineers to keep track of all sources of potential
data quality flows. In particular, Big Data modeling,
analysis and interpretation require standardized
quality measurement models of data. For many
emerging Big Data domains these do not exist
(Lodha, R., et. al., 2014). Quality of Big Data affects
many societal sectors since it is known to be the root
cause for many vital difficulties in the lack of
Omidbakhsh, M. and Ormandjieva, O.
Toward a New Quality Measurement Model for Big Data.
DOI: 10.5220/0009820201930199
In Proceedings of the 9th International Conference on Data Science, Technology and Applications (DATA 2020), pages 193-199
ISBN: 978-989-758-440-4
Copyright
c
2020 by SCITEPRESS – Science and Technology Publications, Lda. All rights reserved
193

appropriate data analysis techniques (Ajami, S.,
Bagheri-Tadi, T., 2013) The challenges of data
quality and data quality assessment in Big Data are
surveyed in (Chen, C. P., Zhang, C. Y., 2014).
2.2 NIST Taxonomy of Big Data
NIST (National Institute of Standards and
Technology) has stimulated collaboration among
professionals to secure the effective adoption of Big
Data techniques and technology, and developed Big
Data standards roadmap to this aim. NIST clarified
the definitions and taxonomies for Big Data
interoperability framework that we will adopt in our
study. The taxonomy consists of a hierarchy of
roles/actors and activities that visits the
characteristics of data at different levels of
granularity, namely, element, record which is a group
of related elements, dataset which is a group of
records and subsequently multiple datasets, as
depicted in Figure 1.
Figure 1: NIST Taxonomy (NIST, 2018).
In section 3 of this paper, NIST Taxonomy will
be used as a foundation for building the proposed new
hierarchical measurement model of Big Data’s
quality at its different levels of granularity (that is,
elements, records, datasets and multiple datasets) in
section 3. The characteristics of Big Data and its
quality are surveyed next.
2.3 Characteristics of Big Data
For characterizing the Big Data, 3 V’s coined by
Doug Laney of Gartner, which are defined as follows
(Laney, D., 2001):
Volume: refers to the vast amounts of data that is
generated every second/minute/hour/day in our
digitized world.
Velocity: refers to the speed at which data is being
generated and the pace at which data moves from
one point to the next.
Variety: refers to the ever-increasing different
forms that data can come in, e.g., text, images,
voice, geospatial.
Furthermore, almost a decade later there are the rise
of the 4 V's of Big Data, then 7 V's, and then 10 V's
(notwithstanding the 5Vs, 6Vs and 8Vs) (Gupta, U.,
Gupta, A., 2016) (Demchenko, Y., et al., 2013)
(Soupal, V., 2015) (Staff, B., 2013) (Normandeau, K.,
2013) (Maheshwari, R., 2015) Some additional V’s
are defined as below:
Veracity: refers to the quality of the data, which
can vary greatly.
Valence: refers to how Big Data can bond with
each other, forming connections between
otherwise disparate datasets.
The characteristics volume, velocity, variety, veracity
and valence are the main characteristics that construct
value “heart” of the Big Data.
Furthermore, the list of recognized V’s includes:
Value: Processing Big Data must bring about
value from insights gained.
Volatility: the fact that how long the data is valid
and how long it should be stored. (Normandeau,
K., 2013)
Vitality: implies to criticality of the data which is
very crucial (Maheshwari, R., 2015).
Validity: the fact the data is accurate and correct
for the purpose of usage. (Demchenko, Y. et al.,
2013)
Vincularity: refers to connectivity and linkage of
data. (Maheshwari, R., 2015)
We aim at assessing quantitatively the ten V’s by
tracing them to the NIST taxonomy levels (data
element, record, dataset and multiple dataset, see
section 2.2) and to the existing international data
quality measurement summarized below.
2.4 Big Data Quality Characteristics
Quantitative assessment of Big Data V’s requires an
establishment of data quality characteristics that must
be considered when specifying Big Data quality
requirements and evaluating data quality.
Comprehensive data quality characteristics are
proposed in the ISO/IEC international standard
ISO/IEC 25012 (ISO/IEC 25012:2008). The data
quality model defined in the standard ISO/IEC 25012
is composed of 15 characteristics that reflect two
Mutiple
Dataset
Dataset
Record
Element
DATA 2020 - 9th International Conference on Data Science, Technology and Applications
194
points of view: i) inherent data quality (refers to the
degree to which data quality characteristics satisfy
data requirements), and ii) system dependent data
quality (degree to which data quality is reached and
preserved when data is used under specified
conditions) (ISO/IEC 25012:2008).
From this point of view data quality depends on
the technological domain in which data are used; it is
achieved by the capabilities of computer systems’
components. For example, the Canadian
Institute for
Health Information (CIHI) developed an integrated
framework for measuring health data quality (Long
J., et al., 2002).
However, no specific guidelines or models exist
for characterizing the quality of Big Data. In the next
section, we propose a model that can be used for
assessing the quality of Big Data
3 OUR HIERACHICAL MODEL
FOR BIG DATA QUALITY
MEASUREMENT
In this section, we build a foundation for assessing the
quality of Big Data at its different levels of
granularity (that is, elements, records, datasets and
multiple datasets).
We use the Goal Question (Indicator) Model
(GQ(I)M) top-down approach to align the
measurement process with the business goals of Big
Data users (Berander, P., Jönsson, P., 2006). With
respect to the measurement goals that are set up, some
questions are generated. Then each question is
analyzed in order to identify quality characteristics,
their indicators and measurement procedures that are
needed to answer them. Indicators can be derived
from multiple base measurements to provide
quantification and an interpretation of the status of the
designated measurement goal.
We explicitly define our measurement goal as:
What is the Quality for Big Data? The goal is refined
into quantifiable questions and consequently, refined
into a set of indicators and measures for the data to be
collected. The quantifiable questions and the related
indicators will be used to help the measurer achieve
the measurement goals. In this way, we built up a Big
Data Quality Measurement model that covers the
issues related to 10 V’s of Big Data and a set of
questions that specifies each issue in a meaningful
and quantifiable way. The questions and indicators
are defined based on our adapted GQ(I)M structure as
depicted in Table 1.
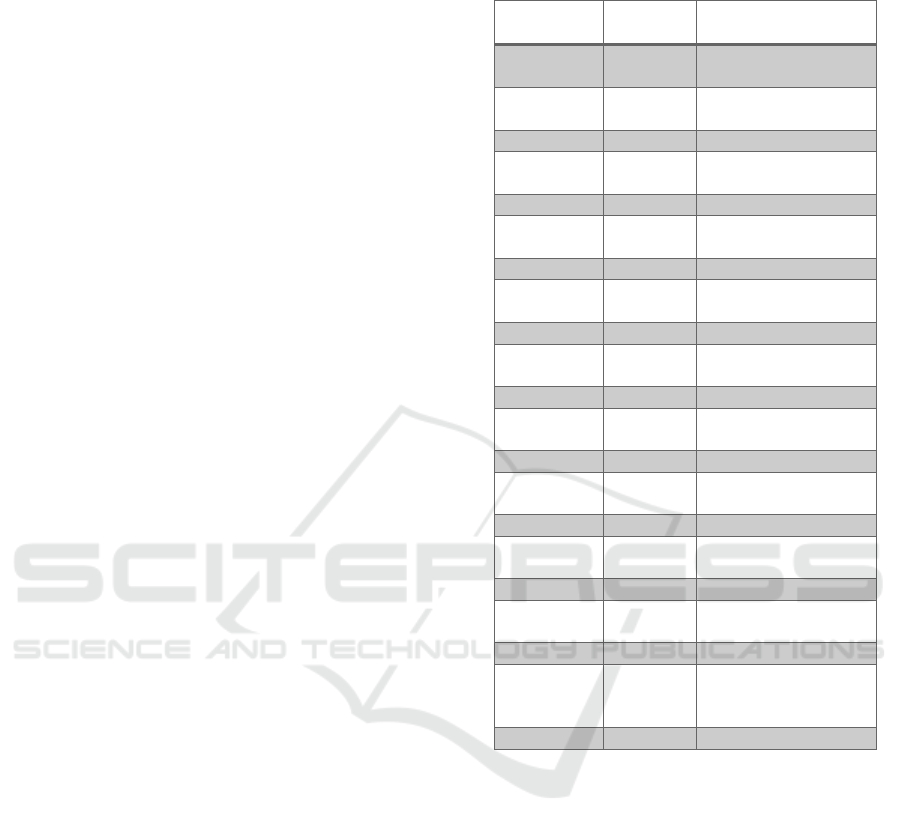
Table 1: GQ(I)M Definition for Big Data Measurement
Model.
Goal Acronym To Evaluate Big
Data
Question Q What is the Quality
for Bi
g
Data?
Question Qvol What is the Volume
of the Big Data?
Indicator Mvol Volume
Question Qvel What is the Velocity
of the Big Data?
Indicator Mvel Velocit
y
Question Qvar What is the Variety
of the Big Data?
Indicator Mva
r
Variet
y
Question Qver What is the Veracity
of the Bi
g
Data?
Indicator Mve
r
Veracit
y
Question Qvale What is the Valence
of the Bi
g
Data?
Indicator Mvale Valence
Question Qval What is the Value of
the Bi
g
Data?
Indicator Mval Value
Question Qvola What is the Volatility
of the Bi
g
Data?
Indicator Mvola Volatilit
y
Question Qvit What is the Vitality
of the Big Data?
Indicator Mvit Vitalit
y
Question Qvalid What is the Validity
of the Big Data?
Indicator Mvali
d
Validit
y
Question Qvinc What is the
Vincularity of the
Bi
g
Data?
Indicator Mvinc Vincularit
y
Figure 2 depicts the root of our new hierarchical
quality model designed specifically for the purpose of
measurement of quality for the selected ten V’s of Big
Data.
When the indicators Mvol, Mvel, Mvar, Mver,
Mvale, Mvola, Mvit, Mvalid and Mvinc are each
calculated and summed up and applied to obtain
measurement value, which characterizes the overall
quality of a Big Data set.
Our next step is to derive Big Data measurements
for the quality indicators identified in Table 1 and
depicted in Figure 2. In order to carry on this step, we
first study the applicability of the existing quality
characteristics and measurements published in
ISO/IEC 25012 and ISO/IEC DIC 25024 for
assessing the ten V’s of Big Data selected in our
work.
Toward a New Quality Measurement Model for Big Data
195

Figure 2: Hierarchy of Big Data Quality.
4 MEASURING BIG DATA
QUALITY INDICATORS
As discussed in Section 2.3, there is no existing model
for the measurement of Big Data quality
characteristics. In this section we investigate the
possible mapping of the ISO/IEC 25012 quality
characteristics to the ISO/IEC DIC 25024
international standard’s data quality measurements.
Please review the Appendix for the more detailed
definitions of ISO/IEC DIC 25024 measurements.
Here, we intend to adapt the ISO/IEC 25024 in
order to define the quality model on the basis of the
ten V’s of Big Data. Figure 3 shows an overview of
our approach to find measurements for assessing the
Big Data characteristics (the ten V’s).
Figure 3: Overview of our Approach to Big Data Quality
Model.
On the basis of the definitions of the V’s of Big
Data and the measures specified in the ISO/IEC
standards, we were able to map seven of the V’s of
Big Data to the ISO/IEC DIC 25024 measurements as
follows:
i)Velocity to Accessibility, Efficiency,
Availability, Portability,
ii)Veracity to Accuracy, Completeness,
Credibility, Currentness, Availability,
iii)Value to Understandability, Credibility,
Currentness, Compliance,
iv)Vincularity to Traceability,
v)Validity/Volatility to Credibility, and
vi)Vitality to Currentness.
According to our research findings, for the Volume,
Variety and Valence, there is no related
measurements found in ISO/IEC. As our future work
we intend to investigate theoretically valid methods
for quality assessment of the above-mentioned V’s.
Each of the ten V’s of Big Data with the exception
of Volume, Variety and Valence is represented by an
indicator and the corresponding characteristics in
ISO/IEC standard 25024 as depicted in Figures 4, 5,
6 and 7.
Figure 4: Velocity of Big Data.
Measures
Questions/
Indicators
Goal
Quality of
Big Data
Big Data
Quality
Indicator
Mvol
Mvel
Mvar
Mver
Mvale
Mval
Mvola
Mvit
Mvalid
Mvinc
Big Data
Taxonomy
V's of Big
Data
ISO Quality
for Data
Velocity
Mvel
Accessibility Efficiency Availability Portability
DATA 2020 - 9th International Conference on Data Science, Technology and Applications
196
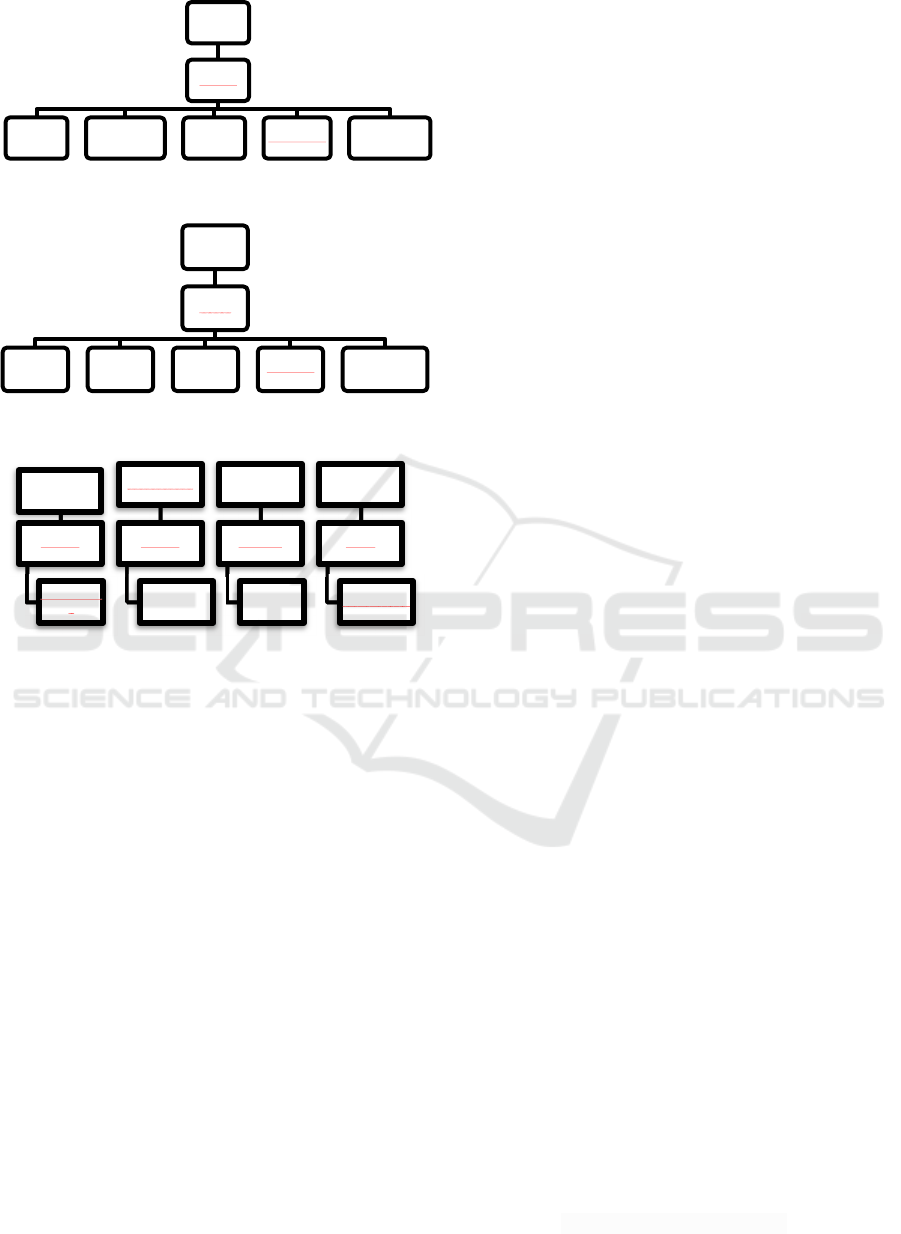
Figure 5: Veracity of Big Data.
Figure 6: Value of Big Data.
Figure 7: Volatility, Vincularity, Validity and Vitality of
Big Data.
As shown in Figures 2, 4, 5, 6 and 7, the quality
characteristics in our hierarchical quality model are
delineated through several layers. The quantification
of the quality characteristics is standardized based on
reliable measurement procedures to ensure fairness of
the assessment. In other words, it is assured that users
produce same measurement results every time the
measurement is undertaken on the same source and in
the same context. This consistency of measurement is
considered
very important (Fenton, N., Bieman, J.,
2014)
.
5 CONCLUSIONS AND FUTURE
WORK
In this paper, we first critically reviewed the literature
on Big Data characteristics (V’s) and then we
proposed a new hierarchical model for Big Data
quality measurement based on the selected V’s. The
quality measurement hierarchy was developed by
associating the ISO/IEC standard measurements with
the Big Data hierarchical levels defined by NIST,
namely: data element, record, dataset and multiple
dataset. The validity of the proposed quality model is
rooted in the standardization of: i) the above-
mentioned Big Data taxonomy, and ii) data
measurements defined in
ISO/IEC.
The quality model
is tailored in a way that facilitates the evaluation of
such systems in terms of: Availability, Accuracy,
Accessibility Credibility, Completeness, Com-
pliance, Currentness, Efficiency, Portability,
Traceability and Understandability
In our research findings, we discovered that there
are no related measurements for important Big Data
characteristics Volume, Variety and Valence in
ISO/IEC. As our future work, we intend to define
indicators and measurement procedures to be used for
quality assessment of the above-mentioned V’s.
REFERENCES
Agbo, B., Qin, Y., & Hill, R., 2018, Research Directions
Research Directions on Big IoT Data Processing using
Distributed Ledger Technology: A Position Paper
(DOI: 10.5220/0007751203850391), last accessed
April 22, 2020.
Agrahari A., Rao D., 2017, A Review Paper on Big Data:
Technologies, Tools and Trends, IRJET: Int Res J Eng
Technol, India.
Ajami, S., Bagheri-Tadi, T., 2013, Barriers for Adopting
Electronic Health Records (EHRs) by Physicians. Acta
Informatica Medica, Volume 21, no. 2, pp. 129-134.
Alsaig, A. et al., 2018, A Critical Analysis of the V-model
of Big Data, IEEE International Conference on Trust,
Security and Privacy in Computing and
Communications/12
th
IEEE International Conference
on Big Data Science and Engineering.
Assuncao, M.D., et al., 2015, Big Data Computing and
Clouds: Trends and future directions, Parallel Distrib.
Comput. 79–80, pp. 3-15.
Berander, P., Jönsson, P., 2006, A Goal Question Metric
Based Approach for Efficient Measurement Framework
Definition, ISESE ’06: Proceedings of ACM/IEEE
International Symposium on Empirical Software
Engineering, pp. 316-325.
Chen, C. P., Zhang, C. Y., 2014, Data-intensive
Applications, Challenges, Techniques and
Technologies: A Survey on Big Data. Information
Sciences, Volume 275, pp. 314-347.
Demchenko, Y. et al, 2013, Addressing Big Data Issues in
Scientific Data Infrastructure, Collaboration
Technologies and Systems (CTS), International
Conference on IEEE, pp. 48-55.
Fenton, N., Bieman, J., 2014, Software Metrics: A Rigorous
and Practical Approach, Third Edition. CRC Press.
https://doi.org/10.1201/b1746.
Firmani, D., Mecella, M., Scannapieco, M. et al, 2016, On
Veracity
Mver
Accuracy Completeness Credibility Currentness Availability
Value
Mval
Compliance Completeness Credibility Currentness Understandability
Volatility
Mvola
Currentnes
s
Vincularity
Mvinc
Traceability
Validity
Mvalid
Credibility
Vitality
Mvit
Currentness
Toward a New Quality Measurement Model for Big Data
197

the Meaningfulness of Big Data Quality, Data Science
and Engineering, pp. 6-20.
Goasdoué, V., NUgier, S., Duquennoy, D., & Laboisse, B.,
2007, An Evaluation Framework for Data Quality
Tools, ICIQ, pp. 280–294.
Gupta, U, Gupta, A., 2016, Vision: A Missing Key
Dimension in the 5v Big Data Framework, Journal of
International Business Research and Marketing,
Volume 1, Issue 3, pp. 46-52.
ISO/IEC/IEEE 15939, 2017-04, Systems and Software
Engineering-Measurement Process.
ISO/IEC 11179-1, 2004, Information Technology-
Metadata registries (MDR).
ISO/IEC DIS 25024, JTC1/SC7/WG6 N762, 2015-07-16,
Systems and Software Engineering- Systems and
Software Quality Requirements and Evaluation
(SQuaRE)-Measurement of data quality.
ISO/IEC 25012:2008, Software Engineering -- Software
Product Quality Requirements and Evaluation
(SQuaRE) - Data Quality Model (This standard was last
reviewed and confirmed in 2019. Therefore, this
version remains current).
Laney, Doug, 2001, 3D Data Management: Controlling
Data Volume, Velocity and Variety, META Group
Research Note 6.
Long J, Richards J, Seko C., 2002, The Canadian Institute
for Health Information (CIHI) Data Quality
Framework, Version 1. A Meta-Evaluation and Future
Directions. Canadian Institute for Health Information,
2002. http://secure.cihi.ca, April 2003.
Lodha, R., Jan, H., & Kurup, L., 2014, Big Data
Challenges: Data Analysis Perspective. Int J Current
Eng Technol, Volume 4, no. 5, pp. 3286-3289.
Maheshwari, Rajiv, 2015, 3 Vs or 7 Vs – What’s the Value
of Big Data, https://www.linkedin.com/pulse/3-vs-7-
whats-value-big-data-rajiv-maheshwari, last accessed
April 19, 2020.
National Health Service. NHS update: archive. http://
www.nhs.uk.
NIST U.S. Department of Commerce, Special Publication
1500-1, NIST Big Data Interoperability
Framework: Volume1, Definitions. Volume2, Big Data
Taxonomies June 2018.
Normandeau, Kevin, 2013, Beyond Volume, Variety and
Velocity is the Issue of Big Data Veracity,
http://insidebigdata.com/2013/09/12/ beyond-volume-
variety-velocity-issue-big-data-veracity/.
Oussous, A., Benjelloun, F. Z., Lahcen, A. A., & Belfkih,
S., 2018, Big Data Technologies: A Survey, Journal of
King Saud University-Computer and Information
Sciences, Volume30, no.4, pp. 431-448.
Press, G. 2013, A Very Short History of Big Data,
https://www.forbes.com/sites/gilpress/2013/05/09/ a-
very-short-history-of-big-data/#5b1e7d2165a1, last
accessed at April 19, 2020.
Serhani, M. A., Kassabi, H., Taleb, I., & Nujum, A., 2016,
An Hybrid Approach to Quality Evaluation across Big
Data Value Chain, IEEE International Congress on Big
Data (BigData Congress), pp. 418–425.
Singh, N., Garg, N., & Mittal, V., 2013, Big Data- Insights,
Motivation and Challenges, International Journal of
Scientific & Engineering Research, Volume 4, Issue 12,
pp. 2172-2174.
Staff, B., 2013, Why the 3Vs Are not Sufficient to Describe
Big Data, https://datafloq.com/ read/3vs sufficient-
describe-big-data/166. University of Technology Staff,
The 7 vs of Big Data, http://mbitm.uts.edu.au/feed/ 7-
vs-big-data, last accessed April 19, 2020.
Soupal, V., 2015, 7V’s for Successful Big Data Project,
https://www.linkedin.com/pulse/7vs-successful- big-
data-project-vit-soupal, last accessed April 19, 2020.
Taleb, I., Serhani, M., & Dssouli, R., 2018, Big Data
Quality Survey, IEEE International Congress on Big
Data (Big Data Congress), pp. 166-173.
APPENDIX
The definition of some of the measures from ISO/IEC
DIC 25024 are as follows:
1) Accuracy: represents the degree to which data has
attributes that correctly represent the true value of
an intended attribute of a concept in a specific
context.
2) Completeness: represents the degree to which data
has values for all expected attributes in specific
context of use.
3) Credibility: represents the degree to which data has
attributes that are true and accepted by users in a
specific context of use.
4) Currentness: represents the degree to which data
has attributes that are of the right age in a specific
context of use.
5) Accessibility: represents the degree to which data
can be accessed in specific context of use, by users
in need of special configuration.
6) Compliance: represents the degree to which data
has attributes that adhere to standards,
conventions and regulations in a specific context
of use.
7) Confidentiality: represents the degree to which
data has attributes that ensure that is only
accessible by authorized users in a specific
context of use.
8) Efficiency: represents the degree to which data has
attributes that can be processed and provide the
expected levels of performance by appropriate
amounts of resources in a specific context of use.
9) Precision: represents the degree to which data has
attributes that are exact in a specific context of
use.
10) Traceability: represents the degree to which data
has attributes that provide an audit trail of access
DATA 2020 - 9th International Conference on Data Science, Technology and Applications
198

to the data and any modification in a specific
context of use.
11) Understandability: represents to which data has
attributes that enable it to be read and interpreted
by users in a specific context of use.
12) Availability: represents the degree to which the
data has attributes that enable it to be retrieved by
authorized users in a specific context of use.
13) Portability: represents the degree to which data
has attributes that enable it to install or move from
one system to another in a specific context of use.
14) Recoverability: represents the degree to which
data has attributes that enable to maintain a
specific level of operations and quality in a
specific context of use.
Toward a New Quality Measurement Model for Big Data
199
