
A Study of the Travel Time of Intersections by Vehicles using
Computer Vision
V. D. Shepelev
1,2 a
, A. I. Glushkov
1b
, Z. V. Almetova
1c
and V. G. Mavrin
3d
1
South Ural State University, 76 Lenin Avenue, Chelyabinsk, Russia
2
Silkway International University, 27 “А” Tokaev Street, Shymkent, Kazakhstan
3
Kazan Federal University, Suyumbike Avenue, 10A, Naberezhnue Chelny, Russia
Keywords: Vehicle Queue, Crossing the Intersections, Travel Time at Intersections, Statistical Confidence, Intelligent
Transport Systems.
Abstract: The article deals with the problem of intelligent traffic control at intersections of road networks of large cities.
Due to the advances in cyber-physical systems (CPS), autonomous driving, as part of Intelligent Transport
Systems (ITS), will obviously be in the centre of future urban transport. However, the existing ITSs do not
fully take into account the size, structure, and parameters of the queue of vehicles waiting at inter-sections,
which in turn affects the traffic capacity of the intersection. In the study, we used computer vision to interpret
a queue of vehicles and record the parameters at the intersection on a real time basis. We studied the mutual
impact of two generalized categories of transport standing in the queue before the stop line at the intersection.
We developed a general conceptual research model, which includes both the task of forming the original
sample and statistical analysis of the time needed to cross an intersection by the vehicles located in different
initial positions. The main research results showed a statistically significant reduction in the vehicle speed to
58% in case there are various categories of vehicles standing in the queue at the intersection.
1 INTRODUCTION
Currently, researchers pay much attention to the
emerging advanced intelligent transport systems,
such as vehicle-to-vehicle communications and the
vehicle-to-infrastructure communication system
(Azimi et al., 2015; Arsava et al., 2014). Using the
advantages of such systems, scientists develop a joint
control mod-el which optimizes the speeds of
connected vehicles and simultaneously coordinates
signals along the artery. This control model divides
the connected vehicles into groups so that the vehicles
can cross intersections together without stops or with
the least stop time. At the same time, it optimizes
signal synchronization patterns along the artery to
achieve lower signal delays and a higher capacity
(Wang et al., 2020; Bakibillah et al., 2019; Makarova
et al., 2019).
a
https://orcid.org/0000-0002-1143-2031
b
https://orcid.org/0000-0002-6292-7122
c
https://orcid.org/0000-0001-9304-8406
d
https://orcid.org/0000-0001-6681-5489
To solve the problem of traffic jams at road
intersections through intelligent systems, it is
necessary to form a comprehensive insight into
several determining problem factors. The most
critical factor in the tasks of setting and modelling
intelligent transport systems is the queue of vehicles
waiting at the intersection.
Many studies deal with the development of
adaptive learning controllers for traffic signals,
analyse their studied policies, and compare them with
the Webster controller. Using the representation of
the state of statistics (i.e., vehicle queues and density),
the proposed traffic signal controllers with enhanced
training develop an optimal policy in the dynamic and
stochastic traffic microsimulation (Tubaishat et al.,
2008; Genders et al., 2020). Ghazal et al. (2016) and
Mandal et al. (2020) offer a system based on the use
of microcontrollers which assess the traffic density
using IR sensors.
Shepelev, V., Glushkov, A., Almetova, Z. and Mavrin, V.
A Study of the Travel Time of Intersections by Vehicles using Computer Vision.
DOI: 10.5220/0009806206530658
In Proceedings of the 6th International Conference on Vehicle Technology and Intelligent Transport Systems (VEHITS 2020), pages 653-658
ISBN: 978-989-758-419-0
Copyright
c
2020 by SCITEPRESS – Science and Technology Publications, Lda. All rights reserved
653

The study Kulakarni et al. (2020) proposes a
model between the saturation flow and the ratio of a
small car, a large car and the road width.
There is a widely used method based on the
formulation of the combinatorial problem to
structurally optimize the traffic light cycle, which
allows us to create the most optimal phase separation
schemes according to the set traffic demand (Galkin
et al., 2018; Kapski et al., 2019; Kazhaev et al., 2018).
Several studies propose a behavioural view
methodology based on the calibration of a
microsimulation model for highly heterogeneous
traffic at the signalized intersection. The proposed
methodology is illustrated through the use of Verkehr
in Staedten Simulation - a widely used
microsimulation soft-ware based on the psycho-
physical car tracking model. Signalized intersections
with different transport and geometric characteristics
from two cities of India were taken as an example
(Mathew et al., 2010).
In (Treiber et al., 2013), the main part, after
presenting various categories of traffic data, deals
with the mathematical description of the dynamics of
traffic flows, covers macroscopic models describing
traffic in terms of density, as well as microscopic
models of many particles, in which each particle
corresponds to a vehicle and its driver. Since the
stochastic queue model excludes some realistic traffic
flow aspects, the authors propose to adapt maximum
pressure control for dynamic traffic assignment based
on modelling (Levin et al., 2019)
Some studies dealing with the traffic instability
and calibration / validation of models present these
topics in a new and systematic way (Solovyev et
al.,2020; Makarova et al., 2018; Ertman et al., 2016).
Quek et al. (2006) describes the use of a particular
class of a fuzzy neural network, known as a fuzzy
neural network of a pseudo-external product, using
the truth value restriction method (POPFNN-TVR)
for a short-term forecast of the traffic flow.
Considering the effects of queues, (Wu et al.,
2020; Dai et al., 2016) offered a method for defining
assessment and classification criteria for a
supersaturated state based on the distance between the
intersections, traffic demand, and intersection
capacity.
A study of Kikuzawa et al. (2019) developed a
traffic flow measurement system to extract the traffic
data by analysing images from fixed-point cameras
installed near intersections. The intersection and the
speed of recognizing the correspondence for the same
vehicle and the accuracy of the average speed are
estimated by the difference in the time needed to cross
two intersections.
There are a minimal number of studies in the field
of investigating the mutual impact of various
categories of vehicles in the queue on the capacity of
signalized intersections. The most representative
works are summarized in the introduction.
The closest study, which describes the headway,
speed and acceleration characteristics of vehicles
during the queue discharge after the green onset under
mixed traffic conditions, is presented by Dey et al.
(2013). It has been found that the queue discharge
headway shows an unmistakable pattern of gradual
compression as queuing vehicles are discharged in
succession. This article also analyses the speed at
which vehicles move when the queue is discharged
for two different categories of vehicles (category I -
passenger cars; category 2 - trucks and buses). It also
analyses the acceleration characteristics of different
categories of vehicles released from a stop after the
green onset and explains them by the non-uniform
acceleration model in the form of. A probabilistic
approach based on the second-order first-moment
method was adopted to assess the saturation flow and
delay caused by the traffic at signalized intersections
under non-uniform traffic conditions (Thamizh et al.,
1995).
The presented methodologies available for
assessing the capacity of signalized intersections are
based on the concept of saturation flow(s). At the
same time, the studies do not fully take into account
the impact of such factors as the queue structure and
its dynamic parameters on the capacity of inter-
sections. In this paper, we will focus on these two
aspects.
2 METHODS
The purpose of this article is to analyse the impact of
heterogeneity of vehicles in the queue on the capacity
of intersections using computer vision. To achieve
this objective, let us divide the problem into three
sub-tasks: to determine how the time needed to cross
the intersection crossing time decreases due to the
traffic-light stop, to analyse the reduction in the time
needed to cross the intersection due to the vehicle stop
in the queue, and to determine the statistical
significance of changes in the timed needed to cross
the intersection crossing time. In the following
sections, we will describe in detail each module,
together with the data collected for analysis and
assessment.
iMLTrans 2020 - Special Session on Intelligent Mobility, Logistics and Transport
654
2.1 Dataset
Street surveillance cameras were used to collect data,
which provide a stable 25 frames per second,
supporting a resolution of 1920
× 1080 (Fedorov et
al., 2019).
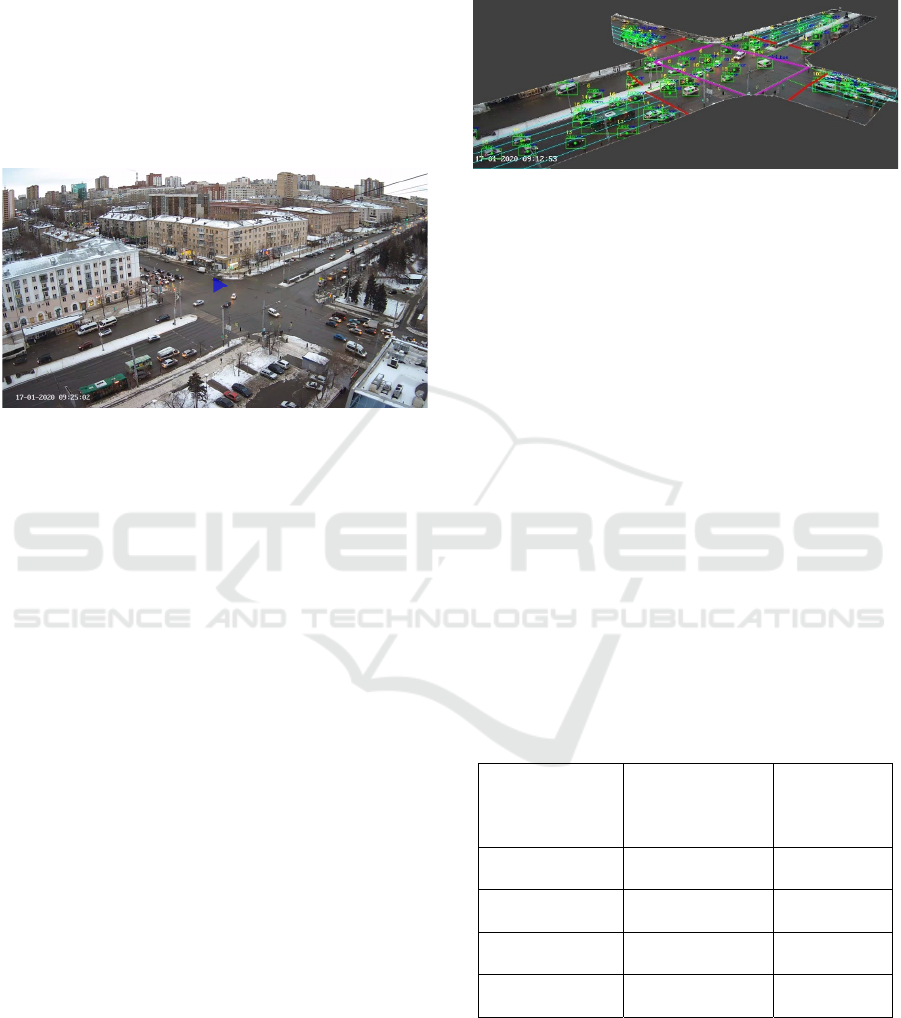
As shown in Figure 1, images from these cameras
differ from those in publicly available data sets, such
as KITTI (Cordts et al., 2016) or UA-DETRAC (Wen
et al., 2015).
Figure 1: An example of an image from CCTV cameras.
To carry out our research, we focused on one
camera, which controls one of the most problematic
intersections in the city of Chelyabinsk. It is a
conscious choice to maximize detection accuracy and
obtain a minimally viable product.
The data on the time the vehicles needed to cross
the stop-line section, and the intersection were
collected through the use of the YOLOv3 trained
neural network (Figure 2).
Stage 1. To determine how the time needed to
cross the intersection decreases due to the vehicle
stop in the queue.
The general conceptual research model can be
presented by the following interdependent stages:
1. Adjustment of the input data to make them
uniform;
2. Analysis of the average values of the time
needed to cross the intersection by the vehicles
located in different initial positions;
3. Determination of the statistical significance of
changes in the time needed to cross the intersection
due to the traffic-light stop.
The formation of a homogeneous sample.
To minimize distortions of the research results, we
selected a sample of the intersection crossing by
similar vehicles. For the analysed intersection, these
are vehicles of category M - vehicles with at least four
wheels and used to carry passengers (Vehicle
Categories, 2019). We also rejected the observations
with the vehicles of category M3 (which maximum
permissible mass exceeds 5 tons), which will also
bring distortions into the results due to their size and
response rate.
Figure 2: An example of an image from our dataset.
We also rejected the observations falling out of
the general intersection crossing structure - which
have a short queue without vehicles crossing the
intersection non-stop. The initial sample was reduced
by 38% and amounted to 1128 observations for the
vehicles of categories M1 and M2. A visual
illustration of the empirical data accepted for our
analysis is shown in Figure 3.
Stage 2. To analyse the decrease in the time
needed to cross the intersection due to the vehicle stop
in the queue.
In the prepared homogeneous sample of the
observations of vehicles crossing the intersection, we
also determined the time intervals when the vehicles
entered the intersection, which will allow us to solve
similar research problems further. The primary
information on this study – the time needed to cross
the intersection average for the sample - is divided
into four positions according to the location of a
vehicle and presented in Table 1.
Table 1: Changes in the time needed to cross the
intersection.
Position of the
vehicle
Time needed to
cross the
intersection,
seconds
Reduction in
speed, %
The first vehicle
in the
q
ueue
6.56 57.8
The last vehicle
in the queue
5.25 67.3
The first vehicle
p
assin
g
non-sto
p
4.62 76.5
The last vehicle
p
assin
g
non-sto
p
3.53 100
As follows from the calculations, the speed of the
vehicle crossing a free intersection decreases by
almost a half (up to 58%), depending on the presence
of the queue. However, to confirm the reliability of
the obtained results, it is necessary to assess the
statistical significance of their differences.
A Study of the Travel Time of Intersections by Vehicles using Computer Vision
655
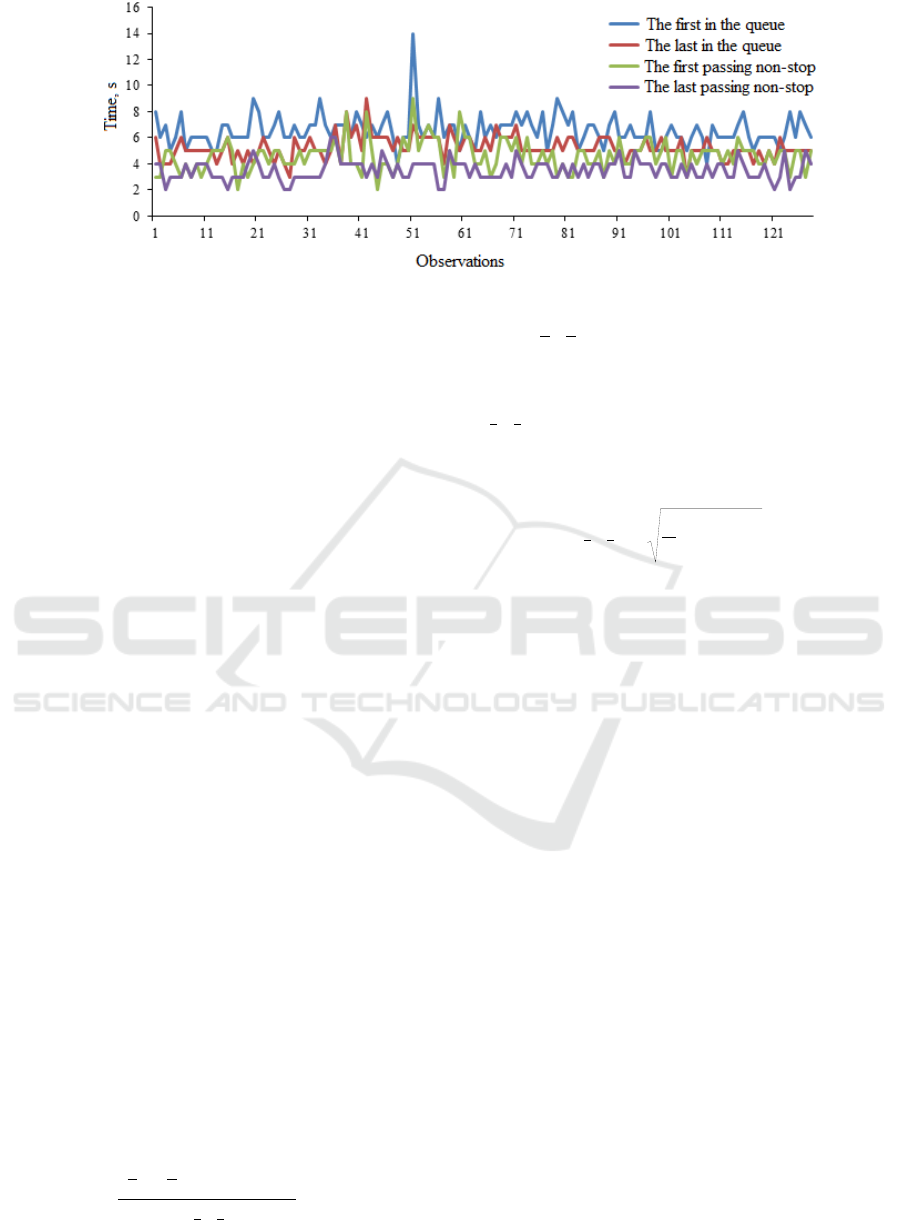
Figure 3: The empirical data on the time needed to cross the intersection.
Stage 3. To determine the statistical significance
of changes in the time needed to cross the inter-
section
In a statistical analysis, a manifested regularity is
considered to be statistically significant if the
empirical significance level is less than the generally
accepted critical value of 0.05 (5%) (Buyul et al.,
2005; Tyurin et al., 2016).
For the problem under consideration – to assess
the statistical reliability of reducing the time needed
to cross the intersection in the presence of a queue, it
is necessary to make sure that the calculated average
time values (Table 1) in terms of statistics are not in
the same confidence interval, i.e., do not represent
one and the same numerical value.
To select a statistical analysis method most
suitable in this case, it is necessary to determine its
following characteristics:
This is a parametric method since the data
measurement scale is at least interval; the
distribution law is close to normal (not
verified);
The samples are linked since each quadruple of
data in one record is read from one observation.
Given such restrictions, the most acceptable is the
method for two linked samples - Student’s parametric
t-test, which allows us to compare each pair of four
calculated time values. Otherwise, we can use the
parametric method for several linked samples (>2) -
an analysis of variance with repeated measurements,
which allows us to evaluate the differences between
all the four values simultaneously. A detailed analysis
of all pairs of time values is undoubtedly of great
interest, so we select the first method.
The statistics calculated by Student’s t-test is
determined as follows:
21
2121
xx
S
xx
t
(1
)
where
21
, xx
is the mathematical expectation for the
two samples; μ
1
, μ
2
are the estimates of the average
values of the two samples (it is assumed that μ
1
=μ
2
);
21
xx
S
is the normalization base formed from the
estimates of variances S of these equal samples (n
1
=
n
2
= n =128) according to the standard rule.
2
2
2
1
1
21
SS
n
S
xx
(2
)
Based on the calculated values of these statistics,
we determined the empirical significance levels for
all pairs of average time values (Table 1), which are
summarized, together with Pearson’s paired
correlation coefficients, in Table 2.
Comparing the calculated values of the error
(these are the selected cells “Difference estimate” in
Table 2) with an acceptable level of 5% (5.00E-2), we
made the following conclusion - all pairs of the
average values of the time needed to cross the
intersection (Table 1) differ significantly. I.e., in
terms of statistics - the differences between them are
statistically significant.
To further confirm the legitimacy of the obtained
result, we determined paired correlation coefficients
and their corresponding levels of statistical
confidence (Table 2). All the links relate to the levels
of weak and very weak links, which is confirmed by
the absence of hidden regularities in the empirical
data, which could introduce distortions into the
analysis results.
3 CONCLUSIONS
All the models are based on uniform driving
conditions; these models may not provide a
satisfactory estimate of delays under non-uniform
iMLTrans 2020 - Special Session on Intelligent Mobility, Logistics and Transport
656
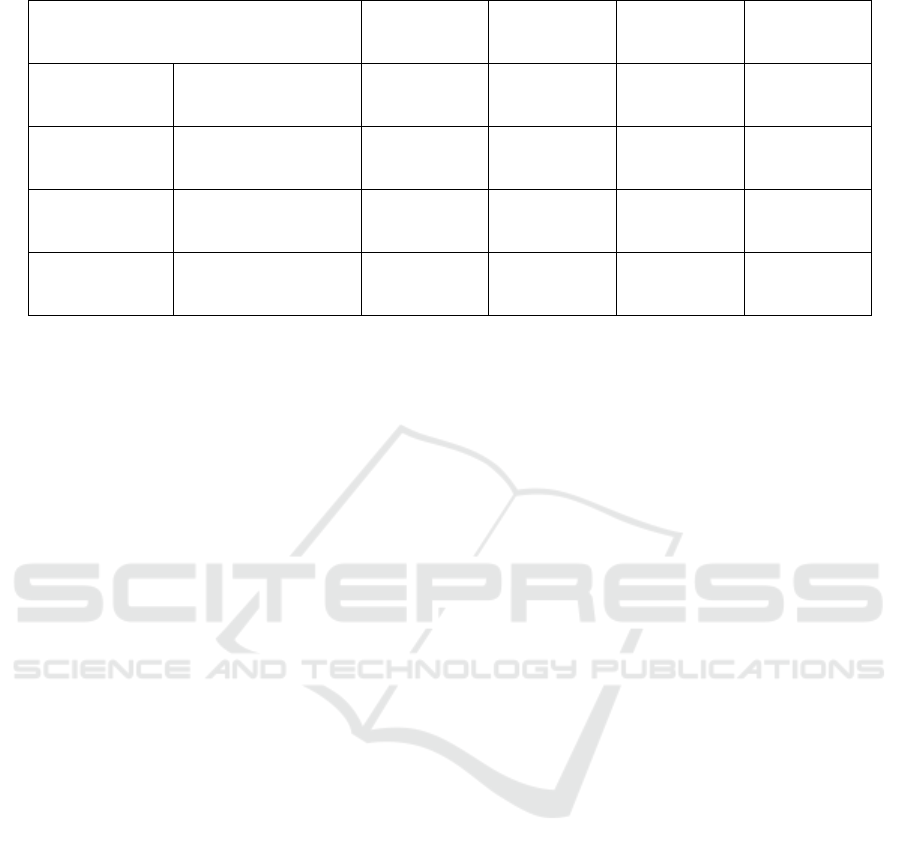
Table 2: Changes in the time needed to cross the intersection.
The first
vehicle in the
q
ueue
The last
vehicle in the
q
ueue
The first
vehicle passing
non-sto
p
The last
vehicle passing
non-sto
p
The first vehicle
in the queue
Pearson’s correlation
Value (2 sides)
N
(
sam
p
le size
)
1
N
=128
The last vehicle
in the queue
Pearson’s correlation
Value (2 sides)
Difference estimate
0.233**
0.008
1.170E-20
1
N
=128
The first vehicle
passing non-stop
Pearson’s correlation
Value (2 sides)
Difference estimate
0.169
0.056
3.031E-28
0.360
0.000
2.066E-08
1
N
=128
The last vehicle
passing non-stop
Pearson’s correlation
Value (2 sides)
Difference estimate
0.073
0.414
3.097E-50
0.236**
0.007
3.308E-39
0.171
0.054
2.084E-16
1
N
=128
traffic conditions. The average delay caused by
various categories of vehicles at signalized
intersections is an essential criterion in assessing the
capacity of these intersections. The use of neural
networks in the tasks covering the recognition and
interpretation of traffic flows allows us to obtain the
new data needed to optimize intelligent transport
systems. As a result of the data analysis at the studied
intersection, we have found that the time needed to
cross the intersection by the vehicles of categories M1
and M2 reduces in a statistically significant manner
to 58% if there is a queue. The interpretation of a bulk
of the data in the vehicle-infrastructure system will
allow us to introduce advanced solutions for
autonomous transport, such as identification of
vehicle parameters and queuing at intersections to
increase their capacity.
ACKNOWLEDGEMENTS
This work was supported by the Russian Foundation
for Basic Research: grant No. 19-29-06008\19.
REFERENCES
Arsava, T., Xie, Y., Gartner, N. H., Mwakalonge, J., 2014.
Arterial traffic signal coordination utilizing vehicular
traffic origin-destination information. In Proceedings
of the 17th IEEE International Conference on
Intelligent Transportation Systems (ITSC), pages 2132-
2137. IEEE.
Azimi, R., Bhatia, G., Rajkumar, R., Mudalige, P., 2015.
Ballroom intersection protocol: Synchronous
autonomous driving at intersections. In Proceedings of
the IEEE 21st International Conference on Embedded
and Real-Time Computing Systems and Applications,
(RTCSA), pages 167-175.
Bakibillah, A. S. M., Hasan, M., Rahman, M. M., Kamal,
M. A. S. (2019). Predictive car-following scheme for
improving traffic flows on urban road networks.
Control Theory and Technology, 17(4): 325-334.
Buyul, A. Zöfel, P. 2005. SPSS: the art of information
processing. Analysis of statistical data and restoration
of hidden patterns, DiaSoft, Moscow.
Cordts, M., Omran M., Ramos, S., Rehfeld T., Enzweiler,
M., Benenson, R., Franke, U., Roth, S., Schiele, B.,
2016. The cityscapes dataset for semantic urban scene
understanding. In 2016 IEEE Conference on Computer
Vision and Pattern Recognition (CVPR), pages 3213–
3223. IEEE.
Dai, P., Liu, K., Zhuge, Q., Sha, E. H.., Lee, V. C. S., Son,
S. H., 2016. Quality-of-experience-oriented
autonomous intersection control in vehicular networks.
IEEE Transactions on Intelligent Transportation
Systems, 17(7): 1956-1967.
Dey, P. P., Nandal, S., Kalyan, R., 2013. Queue discharge
characteristics at signalised intersections under mixed
traffic conditions. European Transport - Trasporti
Europei, 55.
Ertman, S., Ertman, J., Zakharov, D. Adaptation of urban
roads to changing of transport demand. In Proceedings
of the International Conference on Sustainable Cities
(ICSC), 6(01013).
Fedorov, A., Nikolskaia, K., Ivanov, S., Shepelev, V.,
Minbaleev, A., 2019. Traffic flow estimation with data
from a video surveillance camera. Journal of Big Data,
6(1).
Galkin, A., Lobashov O., Capayova S., Hodakova D.,
Schlosser T., 2018. Perspective of decreasing of road
traffic pollution in the cities. In Proceedings of the 18th
International Multidisciplinary Scientific
Geoconference (SGEM), 4.2 (18): 547-554.
Genders, W., Razavi, S., 2020. Policy analysis of adaptive
traffic signal control using reinforcement learning.
Journal of Computing in Civil Engineering, 34(1).
Ghazal, B., Elkhatib, K., Chahine, K., Kherfan, M., 2016.
Smart traffic light control system. In Proceedings of the
A Study of the Travel Time of Intersections by Vehicles using Computer Vision
657

3rd International Conference on Electrical,
Electronics, Computer Engineering and their
Applications (EECEA), pages 140-145.
Kapski, D., Kasyanik, V., Lobashov, O., Volynets, A.,
Kaptsevich, O., Galkin, A., 2019. Estimating the
parameters of traffic flows on the basis of processing of
localization data on the movement of vehicles.
Communications-Scientific letters of the University of
Zilina, 21(2): 89-99.
Kazhaev, A., Almetova, Z., Shepelev, V., Shubenkova, K.,
2018. Modelling urban route transport network
parameters with traffic, demand and infrastructural
limitations being considered. In IOP Conference
Series: Earth and Environmental Science (ICSC),
177(1).
Kikuzawa, M., Jeong, M., 2019. Development of traffic
flow measurement system using fixed point cameras. In
ACM International Conference Proceeding Series,
pages 79-83.
Kulakarni, R., Chepuri, A., Arkatkar, S., Joshi, G. J., 2020.
Estimation of saturation flow at signalized intersections
under heterogeneous traffic conditions. Lecture Notes
in Civil Engineering, 45:591-605.
Levin, M. W., Rey, D., Schwartz, A., 2019. Max-pressure
control of dynamic lane reversal and autonomous
intersection management. Transportmetrica B, 7(1):
1693-1718.
Makarova, I., Shubenkova, K., Mavrin, V., Buyvol, P.,
2018. Improving safety on the crosswalks with the use
of fuzzy logic. Transport Problems, 13(1): 97-109.
Makarova, I., Yakupova, G., Buyvol, P., 2019. Improving
road safety by affecting negative factors. VEHITS -
Proceedings of the 5th International Conference on
Vehicle Technology and Intelligent Transport Systems.
2019. P.629-637.
Mandal, A., Sadhukhan, P., Gaji, F., Sharma, P., 2020.
Measuring real-time road traffic queue length: A
reliable approach using ultrasonic sensor. Lecture Notes
in Electrical Engineering, 602:391-398.
Mathew, T. V., Radhakrishnan, P., 2010. Calibration of
microsimulation models for nonlane-based
heterogeneous traffic at signalized intersections.
Journal of Urban Planning and Development, 136(1):
59-66.
Quek, C., Pasquier, M., Lim, B. B. S., 2006. Pop-traffic: A
novel fuzzy neural approach to road traffic analysis and
prediction. IEEE Transactions on Intelligent
Transportation Systems, 7(2): 133-146.
Solovyev, A. A., Valuev, A. M., 2020. Structural and
parametric control of a signalized intersection with real-
time “Education” of drivers. Advances in Intelligent
Systems and Computing, 902:517-526.
Thamizh, A., V., Jagadeesh, K., 1995. Effect of
heterogeneity of traffic on delay at signalized
intersections. Journal of Transportation Engineering,
121(5): 397-404.
Treiber, M., Kesting, A., 2013. Traffic flow dynamics:
Data, models and simulation. Springer Berlin
Heidelberg.
Tubaishat, M., Qi, Q., Shang, Y., Shi, H., 2008. Wireless
sensor-based traffic light control. In Proceedings of the
5th IEEE Consumer Communications and Networking
Conference, (CCNC), pages 702-706.
Tyurin, Yu.N., Makarov, A.A., 2016. Analysis of data on
the computer, MCCNMO, Moscow.
Vehicle Categories - M, N, O, L., 2019. Availible at
https://avtomirrf.ru/kategorii-ts.html.
Wang, P., Jiang, Y., Xiao, L., Zhao, Y., Li, Y., 2020. A joint
control model for connected vehicle platoon and arterial
signal coordination. Journal of Intelligent
Transportation Systems: Technology, Planning, and
Operations, 24(1): 81-92.
Wen L, Du D, Cai Z, Lei Z, Chang MC, Qi H, Lim J, Yang
MH, Lyu S., 2015. UA-DETRAC: a new benchmark
and protocol for multi-object detection and tracking.
arXiv:1511.04136.
Wu, L., Ci, Y., Wang, Y., Chen, P., 2020. Fuel consumption
at the oversaturated signalized intersection considering
queue effects: A case study in Harbin, China. Energy,
192.
iMLTrans 2020 - Special Session on Intelligent Mobility, Logistics and Transport
658
