
Knowledge Acquisition Data Visualization in eLearning Delivery
Atis Kapenieks, Iveta Daugule, Kristaps Kapenieks, Viktors Zagorskis, Janis Kapenieks jun.,
Zanis Timsans and Ieva Vitolina
Distance Education Study Centre, Riga Technical University, Kronvalda Bulvaris 1, LV-1010, Riga, Latvia
Keywords: eLearning, Learning Data, Telecide, User Behavior.
Abstract: The aim of the study is to create the complete landscape model for learner behavior and knowledge acquisition
data, and mapping the real learner performance data on it. This paper reports on a TELECI approach for
learner knowledge acquisition data visualization. We present the new metrics for determination the relevance
of the e-course content and delivery approach to learners. This approach is based on the assumption that
knowledge acquisition of real e-content can be quantified by superposition of the impact of learning “perfect”
content, “too easy” content, and “too complicated” content. The user learning performance data are generated
in the TELECI e-learning environment with additional short, easy-to-use multiple-choice questions before
and after each content subunit. This approach was well accepted by learners. The learner knowledge
acquisition data are visualized on knowledge acquisition surface. This surface is calculated from the set of
artificial data. The experimental data are positioned in curves called “telecides”. The presented telcide of
Basic Business course delivered for 61 students’ group describes the appropriateness of each course unit to
the learning needs of student group. We present also the experimental data on the learning acquisition surface
from individual students. Each point corresponds learning acquisition for one student.
1 INTRODUCTION
The major challenges in eLearning are content
delivery quality, content quality, and the
correspondence of content and delivery to learning
needs and objectives.
The aim of the study is to create the complete
landscape model of learner behavior and knowledge
acquisition data and mapping real learner
performance data on it. These approaches are
necessary to build the TELECI learning prediction
and support algorithms.
In our previous study (Daugule, Kapenieks,
2018) we discovered that to determine the students’
initial motivation, several aspects should be taken
into account. The results of this study demonstrated
that the initial motivation aspects of students are
complex. One aspect is confirmation that the
evaluation given directly by students of their skills
and the time required for their development without
further processing is not applicable to the
development of the course content and the learning
material selection algorithm.
Also, adaptation of the learning content to the
students' needs should not be based solely on the
answers in the questionnaires.
The study (Daugule, Kapenieks, 2018) concluded
that it is primarily necessary to evaluate student-
provided data in the context of student-generated data
in an e-Learning environment rather than information
submitted by students in various questionnaires. Also,
the information about their future intentions from this
aspect is of secondary importance and cannot be
applied directly.
Other research in the field (Tsoni, Samaras,
Paxinou, Panagiotakopoulos, Verykois, 2019) also
highlights the need to collect and analyze student data
to keep track of their progress, emphasizing the need
to create augmented reality environments that deliver
it in real time. The authors of this study note that the
availability of this type of data would reduce negative
aspects such as poor grades and dropouts.
According to Koch, it is possible and necessary to
apply the 80/20 principle in education. This principle
supplies the hypothesis that there are a few important
reasons that explain superior educational
performance, and that a few approaches or methods
will prove to produce exceptional results. In order to
Kapenieks, A., Daugule, I., Kapenieks, K., Zagorskis, V., Kapenieks jun., J., Timsans, Z. and Vitolina, I.
Knowledge Acquisition Data Visualization in eLearning Delivery.
DOI: 10.5220/0009803505070513
In Proceedings of the 12th International Conference on Computer Supported Education (CSEDU 2020) - Volume 2, pages 507-513
ISBN: 978-989-758-417-6
Copyright
c
2020 by SCITEPRESS – Science and Technology Publications, Lda. All rights reserved
507

do this, it is necessary to distinguish between the
approaches that create the greatest benefits, and then
multiply their incidence (Koch, 1998).
In our opinion, it is crucial that the developed
learning environment should be focused on the most
important issues thus achieving possibly higher
efficiency. One of the key aspects is the quality of the
course and its suitability for the student group or the
individual student. It is important that students use
their study time as efficiently as possible, but it is also
important that the course content is not overly
complex. Too complicated or irrelevant content of the
course may cause loss of motivation, which would
inhibit further learning.
2 COURSE DESIGN FOR
SUFFICIENT USER BEHAVIOR
DATA GENERATION
In light of the problem highlighted in other studies
(Robinson, Cook, 2018), the clicks made in the course
should also be considered in conjunction with other
parameters, to determine the point where the student
has lost focus and, instead of being an active learner,
has become a presence imitator.
Robinson and Cook point out that the metrics that
include only evidence of the student's presence in the
course “speak neither to the quality of the activity nor
to its “stickiness”. Similarly, such indicators are poor
predictors of repeat engagement (student motivation).
Like the disengaged student in a physical classroom,
logging in and out does not prove much beyond the
fact that a student entered and exited the learning
environment” (Robinson, Cook, 2018).
This is also confirmed by research of other
authors. According to Szulanski's hypotheses,
knowledge stickiness positively correlates with
causal uncertainty, lack of motivation on the part of
the knowledge source and recipient, lack of
credibility of the source, lack of knowledge transfer
and receiving capacity, poor organizational context
and arduous relationship between the provider and the
recipient (Szulanski, 2003).
Studies have confirmed that sustained motivation
is essential to the success of a course and that it can
be shaped. Several studies (Gopalan, Abubakar,
Zulkifli, Alwi, Che Mat, 2017) have found that
intrinsic motivation and academic achievement share
significant and positive bonding and such motivation
is able to spread the positivity and ensure long-term
sustainability of the gained knowledge. Although
external evaluation may motivate action, it may not
produce the desired result in the long run. Students
can strive for rewards rather than their knowledge,
and for this reason it is very important that they are
motivated intrinsically (Gopalan, Abubakar, Zulkifli,
Alwi, Che Mat, 2017).
Considering this, we focused on providing this
type of motivation when designing our course
content. In the process of developing it, we took into
account the findings of other researchers that intrinsic
motivation comes from the satisfaction resulting from
the successful completion of a task. It does not
directly affect academic success. However, it strongly
correlates with independent learning and cognitive
strategy use (Levy, Campbell, 2008). The findings of
another study (Dennis, Phinney, Chuateco, 2005)
show that both personal / career motivation and lack
of peer support are important predictors of college
commitment, even when the impact of academic
ability, as indicated by the high school Grade Point
Average, is controlled. The authors of this study
(Dennis, Phinney, Chuateco, 2005) emphasize the
need to create an ecosystem that includes the
necessary support for students and helps them adapt
to the study process in order to positively influence
their learning success.
To create a motivational course design, the
authors examined the student activity data in the
context of a system of short e-content subunits and
multiple-choice questions that are included in the
course content. The goal of this system is to transform
the student from a passive observer into an active
thinker, thus facilitating his / her knowledge
acquisition.
Reducing this circumstance was one of the tasks
of the questions system developed by the authors - to
keep the students’ attention by regularly engaging
them in answering questions in the context of the
subject being learned. The e-course used in the study
was adapted to generate more user behavior data in
each course unit. This was ensured by the placement
of relevant questions at the beginning and end of each
topic. Students were informed that the answers to
these questions would not be considered in the final
assessment, however, answering them is part of the
study process. The students accepted additional
questions as motivating and helpful.
In order to provide the necessary environment for the
study, the blended learning study course that was used
in the previous study was updated (Daugule,
Kapenieks, 2018). The e-course used in the study was
designed in the Sakai e-learning environment. This
study includes research on 61 student activities and
learning outcomes in a Basic Business study course.
Each unit was divided into 3 to 8 subunits. Each
CSEDU 2020 - 12th International Conference on Computer Supported Education
508
subunit was completed with multiple-choice
questions with three answers before and after the
subunit. The first introductory question of each subunit
was mandatory. After answering this question, it was
permitted to open the content and read it. It was
strongly recommended to answer the second and final
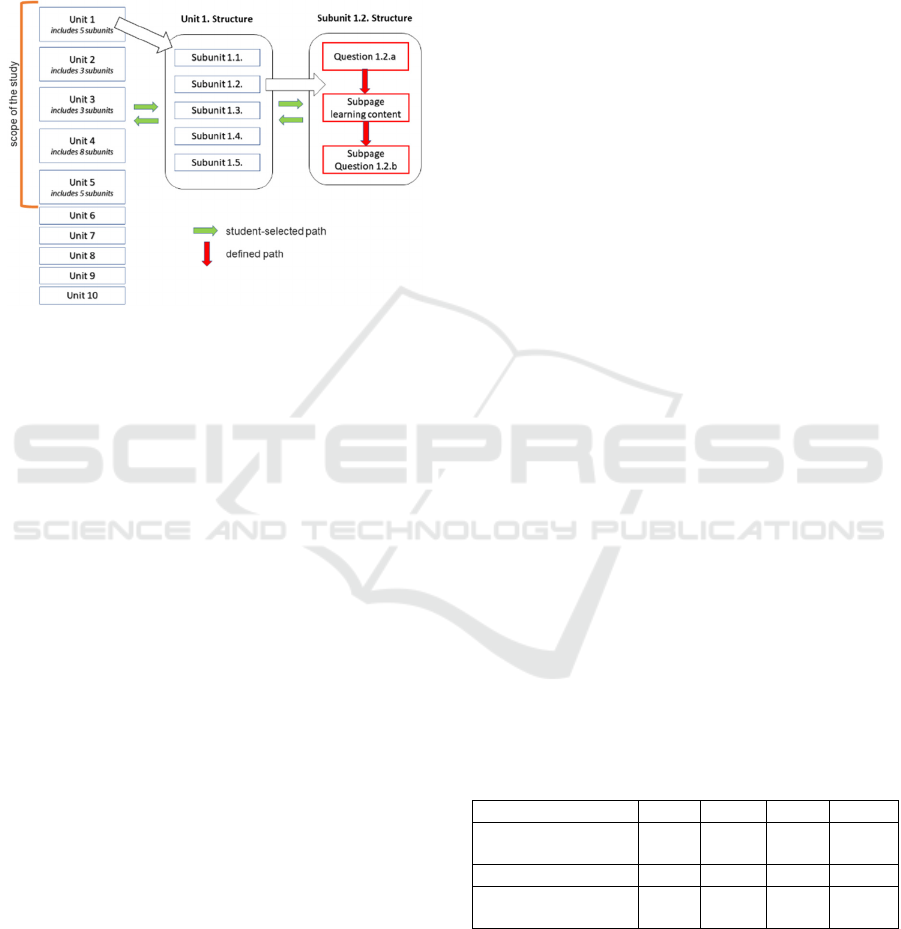
question of each subunit (See Figure 1).
Figure 1: Learning Content Management System with
Multiple-Choice Questions Before and After Each Subunit.
This concept allowed to record, track and
visualize the student activity and student answers to
questions after each subunit.
The used data set consists of data obtained from:
Student success in answering questions at the
beginning and end of each study subunit.
The students' success in answering subunit
questions in the study materials was recorded. A
correct answer to each of these questions rates the
student with one point, so the total score of these
points was determined by two factors - how well the
student provided the answers (student knowledge)
and how many questions he or she chose to answer
(student activity and engagement).
The success of the students in this or a co-
curricular course is not the only factor that determines
their success.
Thus the authors were able to conclude that
answering questions is both a useful way of reading a
student's actual engagement in the learning process,
and a positive influence on his or her learning
success.
3 LEARNER KNOWLEDGE
ACQUISITION SURFACE
MODELING
The correspondence of course content to
user learning needs is a critical issue in e-learning. If
a course is too complicated, learners lose interest.
They do not benefit from a course if it is too simple.
The custom-made course design allowed us to
obtain data pairs that represented students' initial
knowledge and knowledge progress during the
course. We concluded from user behavior data before
and after subunit learning that four types of results are
possible:
N-P (negative to positive) result when the user
selects an incorrect answer before learning and
the correct answer after learning;
P-P (positive to positive) result when the user
selects the correct answer before learning and
the correct answer after learning;
N-N (negative to negative) result when the user
selects an incorrect answer before learning and
an incorrect answer after learning;
P-N (positive to negative) result when the user
selects the correct answer before learning and an
incorrect answer after learning.
The data thus obtained enabled us to identify and
properly manage three situations essential for
successful adaptation of the content of the e-course to
the student's abilities:
Too easy content - risk of missed opportunities.
With customized content the student could learn
more in the given time-frame;
Too complicated content - risk of overload. The
student may lose confidence in their ability and
motivation to learn;
Perfectly matching course content - a situation
in which the course content fully meets the
student's needs and allows the student to fully
exploit his or her potential for learning.
We calculated theoretical values of average
relative probability for N-P, P-P, N-N, P-N for three
types of e-content if multiple-choice questions before
and after the course unit have three answers (Table 1).
Table 1: Calculated theoretical values of average relative
probability for N-P, P-P, N-N, P-N for three types of e-
content.
N-P P-P N-N P-N
too complicated
content
0,222 0,111 0,444 0,222
too eas
y
content 0 1 0 0
ideally matching
content
0,666 0,333 0 0
The calculated data in Table 1 presents extreme
values:
If the content is too complicated the N-P, P-P,
N-N, P-N data have random probability;
Knowledge Acquisition Data Visualization in eLearning Delivery
509
If content is too easy – users have all the
knowledge before learning and therefore PP=1,
others are 0;
If the content matches perfectly – users have no
knowledge before learning (random
distribution), and they have gained knowledge
after learning.
We considered this when further modeling the
learner knowledge acquisition surface, which was
modeled between the following data points (Table 2):
Table 2: Calculated theoretical values of average relative
probability for N-P, P-P, X-N.
N-P P-P X-N
too com
p
licated content 0,222 0,111 0,666
too eas
y
content 0 1 0
ideally matching content 0,666 0,333 0
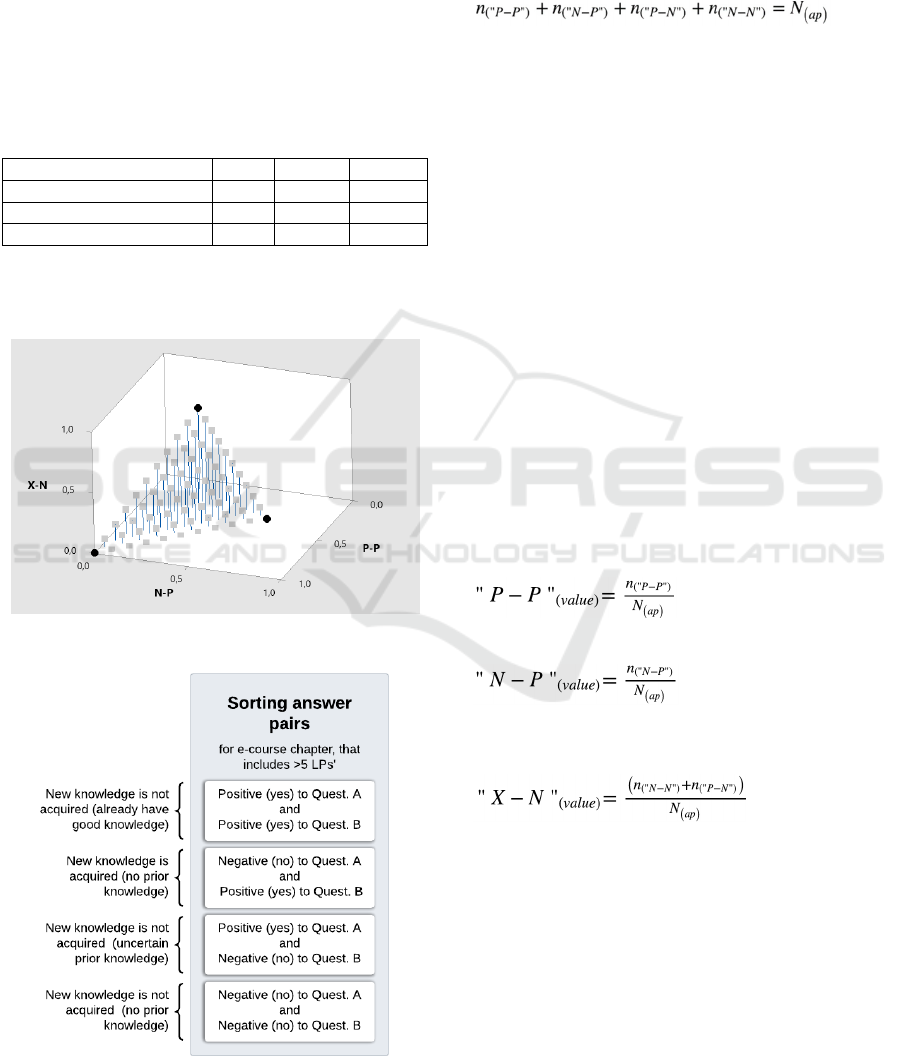
The learner knowledge acquisition surface model
is a complete learning acquisition landscape designed
from the generated set of artificial data (Figure 2).
Figure 2: The learner knowledge acquisition surface model.
Figure 3: Sorting Answers Pairs.
After calculating the values, real data points are
placed on the TELECI surface. These data points
serve as a reference for assessing e-course suitability
for the student or students’ group.
Calculation was made
where:
- n
(“P-P”)
is the number of answers for 1-st type
pair of questions (correct answers both for
question A and question B);
- n
(“N-P”)
is the number of answers for 2-nd
type pair of questions (incorrect answer for
question A and incorrect answer to question
B);
- n
(“P-N”)
is the number of answers for 3-rd type
pair of questions (correct answer for
question A and incorrect answer to question
B);
- n
(“N-N”)
is the number of answers for 4-th
type pair of questions (incorrect answer for
question A and incorrect answer to question
B);
- N
(ap)
is the number of total pairs of answers.
These numbers are used to calculate value
numbers on the TELECI surface. The TELECI
surface is modelled in 3 dimensions with P-P values
on the x axis, N-P values on the y axis, and X-N
values on the z axis. The following formula is used to
determine the P-P value:
A similar formula is used to determine the N-P value:
A slightly more sophisticated formula is used to
calculate the X-N value on the z axis:
The reason for this is the authors' assumption that
in 3-rd type answer pair situation, where the answer
to question A was correct and the answer to question
B was incorrect, the correct answer to question A was
accidentally guessed.
All possible real data will be compared with this
artificial model. Placing the real users' data on the
learner knowledge acquisition surface enables
monitoring user performance.
CSEDU 2020 - 12th International Conference on Computer Supported Education
510
4 CONTENT ADEQUACY
ASSESSMENT FOR USER
LEARNING NEEDS
The real user data are used in quantitative
measurement for matching e-content with user
learning needs. We analyzed user data from the
course (results from the pairs of questions) from the
following points of view:
The relative relevance of each department to
students' needs;
The overall relevance of the course to the needs
of the individual student.
When evaluating the relative relevance of each
department to students' needs, we gathered the
integrated data of a group consisting of 61 students
who were learning five course units. It is presented in
the following Table 3.
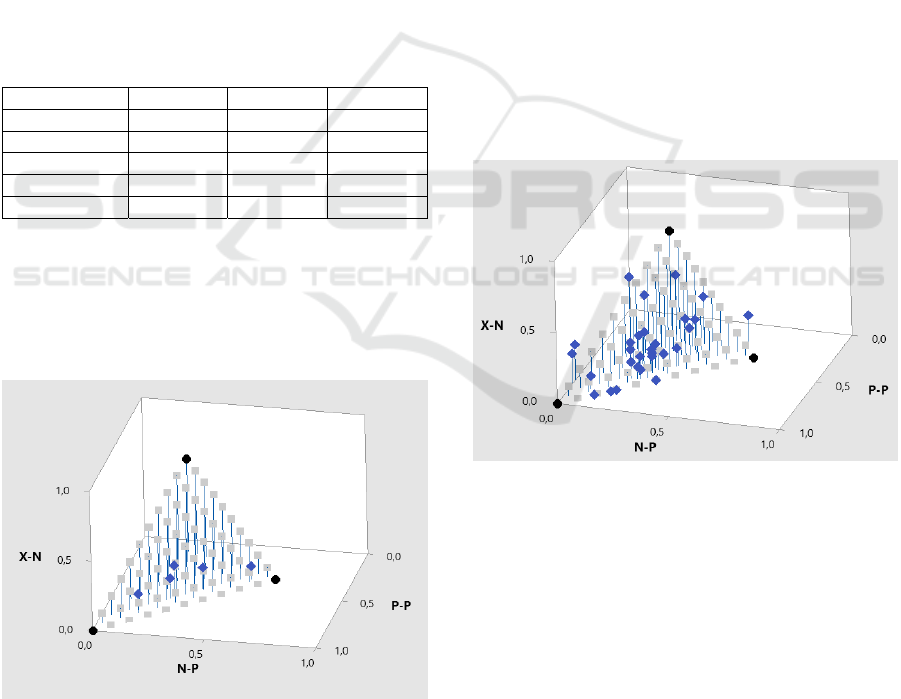
Table 3: Experimental values of N-P, P-P, X-N for a student
group learning five course units.
N-P P-P X-N
Unit 1 0,26 0,60 0,14
Unit 2 0,14 0,75 0,11
Unit 3 0,37 0,48 0,14
Unit 4 0,26 0,55 0,19
Unit 5 0,56 0,35 0,09
The data in Table 3 represents the real user
behavior data values between singular values
presented in Table 2.
In the following Figure 3 we present the
experimental data of Table 3 on the learning
acquisition surface.
Figure 4: Experimental data of learning acquisition on the
learner knowledge acquisition surface from the Units
perspective.
The experimental data in Figure 3 and their
trajectories are positioned in curves called
“telecides”. The telecide in Figure 3 describes the
appropriateness of each course unit to the learning
needs of our 61 students’ group.
Each dark point corresponds to the learning
acquisition of one of five course units (Unit 1 – Unit
5). The Unit 1, Unit 2 data show that the content is
rather simple. Unit 5 is nearly ideal e-content with a
small trend towards being too complicated. Data
show an increase of learning complexity in line with
an increase of the number of course units for our
students’ group.
When analyzing the collected data, we notice that
some students have not completely completed the
pairs of questions, by answering only the first
question. Therefore, in order to process data related
to the course's individual student needs, we set
minimum requirements for data selection for further
processing. Students who had completed less than 5
pairs of questions were excluded from the sample to
assess individual student achievement.
In the following Figure 4 we present the
experimental data on the learning acquisition surface
from individual students.
Figure 5: Experimental data of learning acquisition on the
learner knowledge acquisition surface from an Individual
Student’s perspective.
Each dark point corresponds learning acquisition
of one of the students. As Figure 4 shows, the course
offered to students has mostly been easy to master,
but for some of them the content has been
challenging.
Knowledge Acquisition Data Visualization in eLearning Delivery
511

5 DISCUSSION
The user behavior data visualization study provided
the full landscape for user behavior activity and user
knowledge acquisition.
The points and their locations on the knowledge
acquisition surface can be used for the algorithm to
design the content management system with
additional motivation and support tools. Telecides
can be drawn for the study course, for each unit of the
study course, for a specific group of students, or for
an individual student. However, obtaining the
necessary data requires restructuring the e-content
appropriately.
Ensuring a sufficient number of measurement
points and the amount of data collected is of equal
importance. At the same time, the user of the method
must bear in mind that the course must remain user-
friendly and easy to understand - data collection must
not interfere with learning.
Regular retrieval and processing of TELECI type
knowledge acquisition data sets the framework for
course refinement in several directions. Based on the
data obtained, it is possible to send relevant support
messages to students and teachers. In this case, the
messages sent to students would contain the
necessary motivational content, while the messages
sent to the lecturers would provide information on
student success and potential output in the learning
process. At the same time, information provided by
the telecide of a e-course unit or by a student can be
used to make further adjustments to the content of the
e-course, making it more complex or simplified,
depending on the data provided by the system.
The data obtained from the course question
system can be used to design the algorithm for
predicting student learning success. The questions
system developed by the authors also assesses the
students' initial knowledge of the course knowledge
area. The experimental data on learning acquisition
are indicative of the appropriateness of learning e-
content to the needs of the student.
The obtained results lead to the conclusion that the
development of the questions system has served as a
motivating factor in attracting students to the course.
Although the effort to answer the questions is not the
only reason for the student's success, it is nevertheless
important enough to be used in further algorithm
development.
During the research it was noticed that the
questions system motivates students to participate in
the course. It relates to another study (Shell, Soh,
Flanigan, Abraham, Peteranetz, 2016) that was
conducted in a computer science student group where
it was concluded that students are attending
introductory computer science courses with the
positive motivational dispositions necessary to
succeed, however, these entering motivations are not
necessarily motivating course achievement. An
exception is highly selective honors students. The
conclusion of the aforementioned study (Shell, Soh,
Flanigan, Abraham, Peteranetz, 2016) is the
suggestion that the focus needs to be on within-course
motivational and instructional strategies, and what
instructors do affects students’ motivation.
6 CONCLUSIONS AND FUTURE
WORK
The learning content in the TELECI approach was
divided into small parts with a multiple-choice test
before the subunit and another test after it. This
approach had more appeal to the students. It ensured
obtaining a sufficient amount of user behavior data.
The e-course structure and data visualization
enabled a quantitative description of the course's -
course unit’s relevance to the user group. The study
demonstrates metrics for visual and numerical
differences, and the appropriateness of each e-course
unit to the needs of the learner group.
The innovative approach opens the new metrics
for better understanding of eLearning course
acceptance and delivery.
ACKNOWLEDGEMENTS
This research has been supported by a grant from the
European Regional Development Fund
(ERFD/ERAF) project “Technology Enhanced
Learning E-ecosystem with Stochastic
Interdependences - TELECI”, Project
No.1.1.1.1./16/A/154.
REFERENCES
Daugule, I., Kapenieks, A. (2018). The Data of the Initial
Motivation – a Valuable Source for the Development of
the Course Content. A Case Study in the Group of
Business Students. International Journal of Engineering
and Technology (UAE). 7. 89-94. 10.14419/ijet.v7i2.
28.12886.
Dennis, J. M., Phinney, J. S., Chuateco L. I. (2005) The
Role of Motivation, Parental Support, and Peer Support
in the Academic Success of Ethinc Minority First-
Generation College Students. Journal of College
CSEDU 2020 - 12th International Conference on Computer Supported Education
512

Student Development, Vol 46 (3) pp.223-236,
doi:10.1353/csd.2005.0023
Gopalan, V., Abubakar, J., Zulkifli, A.N., Alwi, A., Che
Mat, R. (2017). A review of the motivation theories in
learning. AIP Conference Proceedings. 1891. 020043.
10.1063/1.5005376.
Koch, R. (1998) The 80/20 Principle. The Secret of
Achieving More with Less. Nicholas Brealey
Publishing, pp. 6-7; 267-270.
Levy, S., Campbell, H. (2008) Student Motivation:
Premise, Effective Practice and Policy, Australian
Journal of Teachers Education, Vol 33 (5) pp.14-26.,
http://dx.dio.org/10.14221/ajte.2008v33n5.2
Robinson, A., Cook, D., (2018). “Stickiness”: gauging
students’ attention to online learning activities,
Information and Learning Science, Vol. 119 Issue: 7/8,
pp.460-468, https://doi.org/10.1108/ ILS-03-2018-
0014
Shell, D., Soh, L., Flanigan, A., Peteranetz, M. (2016).
Students' Initial Course Motivation and Their
Achievement and Retention in College CS1 Courses.
639-644. 10.1145/2839509.2844606.
Szulanski, G. (2003) Sticky Knowledge: Barriers to
Knowing in the Firm. SAGE Publications, pp.25-30.
Tsoni, R., Samaras, C., Paxinou, E., Panagiotakopoulos, C.
and Verykois, V. From Analytics to Cognition:
Expanding the Reach of Data in Learning. In
Proceedings of the 11
th
International Conference on
Computer Supported Education (CSEDU 2019) –
Volume 2, pp. 458-465 ISBN: 978-989-758-367-4
Knowledge Acquisition Data Visualization in eLearning Delivery
513
