
Feasibility Analysis of SMartyModeling for Modeling UML-based
Software Product Lines
Leandro F. Silva
1 a
, Edson OliveiraJr
1 b
and Avelino F. Zorzo
2 c
1
Informatics Department, State University of Maringá (UEM), Maringá, Brazil
2
Pontifical Catholic University of Rio Grande do Sul, Porto Alegre-RS, Brazil
Keywords:
Experiment, SMartyModeling, Software Product Line, Tool, UML.
Abstract:
Variability modeling in UML-based Software Product Lines (SPL) has been carried out using basically the
UML Profiling mechanism for a diverse of theoretical approaches. However, there is no UML-based SPL
life cycle supporting tool, which takes advantages of the UML standard diagrams in a controlled environment
exclusively dedicated to it. Users usually adopt general-purpose UML tools to model variability. Its drawback
is no control over data regarding SPL models, especially on variability. With such control, one might, for
instance, use different visualization techniques to show SPL/variability information, inspecting/testing SPL
models and data, apply metrics, and configure specific products. To provide an environment with these char-
acteristics, we developed SMartyModeling. We evaluated its feasibility based on two studies: one qualitative
supported by the Technology Acceptance Model (TAM), and one experiment comparing SMartyModeling
with Astah. The first study aided to establish assumptions on how to improve the environment. We then,
stated hypotheses to be tested in a comparative experiment. Thus, we identified aspects related to the automa-
tion of the SPL concepts, the number of errors and the difficulties in modeling SPLs. Hence, we measured
effectiveness and efficiency of SMartyModeling over Astah. General results provide preliminary evidence that
SMartyModeling is feasible for further developing.
1 INTRODUCTION
The reuse of requirements, architectures and other ar-
tifacts in a high level of abstraction is efficient in tra-
ditional software development techniques, focused on
the source code and opportunistic reuse. In this con-
text, the Software Product Line (SPL) approach has
been consolidated as a technique for systematic reuse
in many companies around the world (Linden et al.,
2007). SPL development comprises a set of essen-
tial activities, such as, variability management, which
is a key issue for the success of SPLs. Several ap-
proaches to variability management have been pro-
posed in the literature (Chen et al., 2009; Galster et al.,
2014; Raatikainen et al., 2019).
Secondary studies Chen et al. (2009) Galster et al.
(2014) Lisboa et al. (2010), Pereira et al. (2014) and
surveys Bashroush et al. (2017) Berger et al. (2013)
do not present tools with native support to modeling
a
https://orcid.org/0000-0001-8860-5968
b
https://orcid.org/0000-0002-4760-1626
c
https://orcid.org/0000-0002-0790-6759
UML-based SPLs.
Several companies have increasingly required the
support of tools for the SPL approach. Hence, they
have developed their homemade solutions to support
the SPL life cycle. However, the current support tools
are mainly restricted to the problem space based on
feature modeling (Bashroush et al., 2017).
To provide support to the solution space in SPL,
we developed SMartyModeling
1
, an environment for
SPL modeling, with support to most UML stereotype-
based approaches. The main benefit of SMartyMod-
eling is the reuse of structures, including architec-
tural views, requirements, and descriptions, gathered
from most existing used SPL tools (Bashroush et al.,
2017; Pereira et al., 2014; Berger et al., 2013), even
those with no UML support. SMartyModeling pro-
vides users control over the data and the integration
of new functionalities with existing tools.
To analyze SMartyModeling feasibility and make
decisions on its further development, a qualitative
1
Available at https://github.com/leandroflores/demo_
SMartyModeling_tool
442
Silva, L., OliveiraJr, E. and Zorzo, A.
Feasibility Analysis of SMartyModeling for Modeling UML-based Software Product Lines.
DOI: 10.5220/0009793404420449
In Proceedings of the 22nd International Conference on Enterprise Information Systems (ICEIS 2020) - Volume 2, pages 442-449
ISBN: 978-989-758-423-7
Copyright
c
2020 by SCITEPRESS – Science and Technology Publications, Lda. All rights reserved

study was performed through a questionnaire an-
swered by 10 experts in SPL from which identified
strengths and limitations of the tool. Then, we con-
ducted an experiment aimed to compare the SMarty-
Modeling environment with the Astah
2
tool.
This paper aims to present the results of the initial
qualitative evaluation, which motivated an experiment
comparing efficiency and effectiveness of SMarty-
Modeling and the Astah tool by modeling use case di-
agrams. Results on these studies revealed main points
to improve SMartyModeling and lessons learned.
2 THE SMartyModeling
ENVIRONMENT
SMartyModeling provides support for the follow-
ing main functionalities: Variability Model: man-
agement to variability model and composition rules;
Variability Decision: providing support to the man-
agement of variability resolution; Variability Val-
idation: performing consistency checking;Domain
Asset Management: document the processes, clas-
sify assets and manage them through their life cycle;
Guide: including key steps to use the environment;
and Import/Export: including a specific module for
reading and writing the projects.
Figure 1 presents the SMartyModeling main in-
terface for use case modeling, with five fundamen-
tal components: Operations Panel (Component A):
key system operations: new, open, save and close
Project; undo, redo; in and out zoom; print, help and
about; Buttons Panel (Component B): features to
the respective diagram. For the use cases there are:
drag and drop diagram elements; new actor; new use
case; new variability; new include association; new
extend association; and new realization association;
Project Panel (Component C): organization of the
Project as a tree to display: diagrams, variabilities,
products, instances, metrics and traceability; Model-
ing Panel (Component D): draws diagrams; Infor-
mation Panel (Component E): tabs with information
on selected elements.
A practical example using the SMarty approach is
presented below. We consider the use case diagram
defined for Arcade Game Maker (AGM)
3
, a pedagog-
ical SPL created by the Software Engineering Insti-
tute (SEI)
4
to support learning and experimentation
of SPL concepts. We used AGM as a reference for
the qualitative study (Section 3) and the experiment
2
http://astah.net
3
https://www.sei.cmu.edu/productlines/ppl
4
https://www.sei.cmu.edu
(Section 4).
Figure 1 presents an adaptation of the AGM
use case diagram modeled, containing the follow-
ing elements: Game Installer: actor responsible
for actions of configuration of the games produced
by AGM; Game Player: actor responsible for play-
ing; Save Score: saves the player’s current score;
Install Game: install the chosen game; Exit Game:
exits the game in progress; Uninstall Game: re-
moves the selected game; Play Selected Game: an
actor selects the game and begins its execution; Play
Bowling: starts the game Bowling; Play Brickles:
starts the game Brickles; and Play Pong: starts the
game Pong.
Considering the Play Selected Game use case
in Figure 1, we note the variationPoint stereotype, in-
dicating that the use case is a variation point, associ-
ated with the play game variability, that has three vari-
ants associated: Play Brickles, Play Pong and Play
Bowling, the three stereotypes with alternative_OR,
indicating that they are inclusive, thus different com-
binations can be selected. The optional stereotype is
associated with one use case: Save Score. The op-
tional stereotype indicates the optional presence. The
other elements are mandatory.
3 QUALITATIVE STUDY
We adopted the Technology Acceptance Model
(TAM) (Davis, 1989) to understand the causal re-
lationship between external variables of user accep-
tance and the actual use of the technology under anal-
ysis. Furthermore, we wanted to understand the be-
havior of these users based on their usefulness and
ease of use perspectives.
Therefore, 10 SPL experts answered a ques-
tionnaire
5
related to ease of use, utility and future
use. The questionnaire was composed of open and
closed questions. For the closed questions the Lik-
ert scale was used. We adopted the SMarty approach
(OliveiraJr et al., 2010) for variability representation.
All experts have at least 1 year of experience in SPL.
Regarding the Ease of Use, experts agreed: the
modeling interface was intuitive and easy to handle
(5 totally and 5 partially); the environment allows the
modeling according to the concepts defined by the
UML (7 totally and 3 partially); and the environment
allows the modeling according to the concepts of SPL
in an intuitive way (6 totally and 4 partially). Figure
2a) presents the responses about Ease of Use.
5
https://zenodo.org/record/3336227
Feasibility Analysis of SMartyModeling for Modeling UML-based Software Product Lines
443
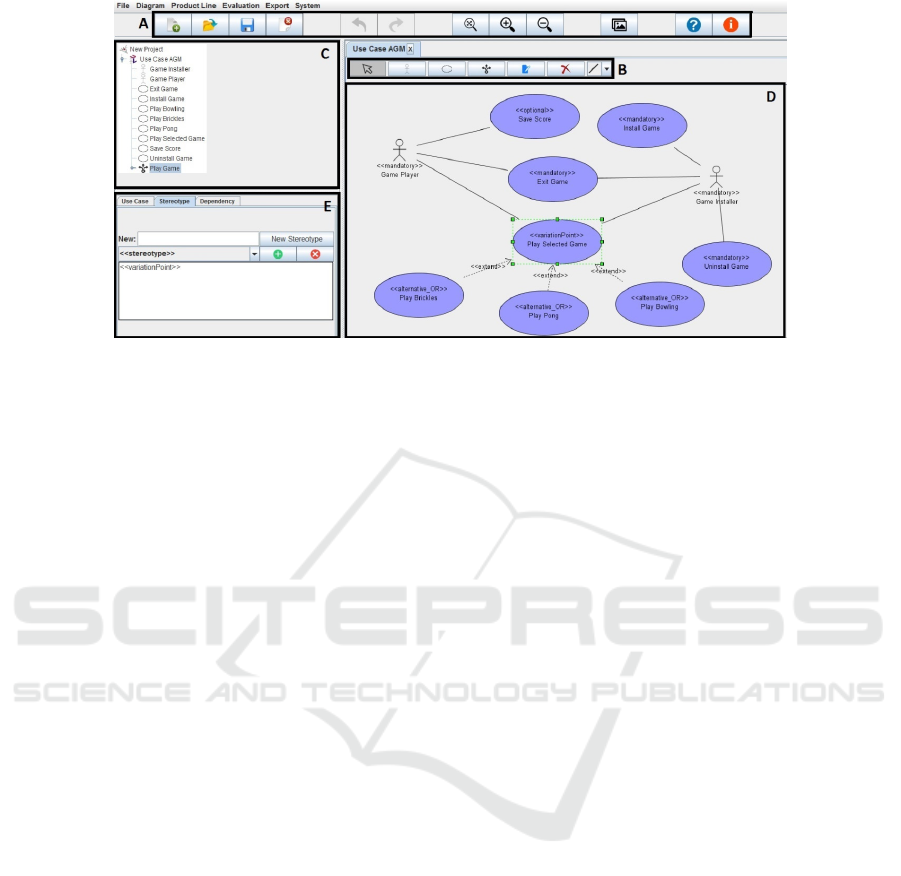
Figure 1: SMartyModeling interface.
Regarding Utility, we observed certain diver-
gences. Although the experts were able to perform
the modeling using the interface as expected (4 totally
and 6 partially), difficulties were encountered in ex-
ploring the features of saving and opening diagrams,
fully maintaining the information of the diagram, with
7 (4 fully and 3 partially) exploring correctly and 3 (2
partially and 1 fully) reporting difficulties. Figure 2b)
presents the responses about Utility.
In relation to Future Use, the environment was
considered for future use for all experts (8 totally and
2 partially). All of them would recommend our en-
vironment to other people (9 totally and 1 partially).
Figure 2c) presents the responses about Future Use.
The analysis of the open responses was performed
using Grounded Theory procedures, assigning labels
to sections of text (open coding), and grouped and cat-
egorized (axial coding) according to the expressed an-
swers.
Analyzing the experts quotes on the positive as-
pects, the following points stand out: application of
SPL concepts: “Automates and simplifies the pro-
cess of modeling the stereotypes defined in SMarty”
(Expert #1) and “It was very clear the application of
the SPL and SMarty concepts in the tool, facilitating
the modeling of the diagrams.” (Expert #5); intuitive
interface: “Interface standardization also helps in
learning” (Expert #2), “The graphical part of the en-
vironment is simple and very well developed, which
makes it simple and easy for anyone to use” (Expert
#6) and “Intuitive interface and ease of use. You can
start using the use case and/or class quickly.” (Expert
#9); and ease of use: “Each element of a model is
very well represented.” (Expert #5) and “The terms
of the options are clear, allowing one to immediately
understand what each option does.” (Expert #9).
The analysis also identified the points to improve:
graphical interface: “I believe the visual interface
can be improved” (Expert #3 :), “It would be nice
to have a bigger space to draw.” (Expert #4) and “I
had to use the scroll bar because the elements were
large on the screen.” (Expert #7); modeling features:
“I had difficulties in creating a Variation Point and in
the association of its respective variants” (Expert #1),
“when registering a new use case, it was not possible
to add it as a variant.” (Expert #2) and “The options to
remove and edit classes, interfaces on the side menu
did not work” (Expert #5); and Export/Import Di-
agrams: “I found some difficulty saving my work”
(Expert #2), “I had difficulty saving the templates.”
(Expert #4) and “I saved the class for the first time,
but it did not appear in my files. When I saved again,
then it appeared.” (Expert #8).
The results of this qualitative study motivated
the conduction of an experiment, with the objective
of comparing SMartyModeling with another regular
UML tool. Hypotheses from the results of this qual-
itative study were raised to plan the experiment. In
general, quantify the difference in modeling using
SMartyModeling against other tools.
The answers raised questions for the experiment.
First, in relation to the intuitive modeling interface.
The goal is to identify how far SMartyModeling is
from currently used tools. To evaluate this aspect, the
total time required to model an SPL is a factor of anal-
ysis. Another goal is to compare SMartyModeling
with another tool in relation to the automation of SPL
concepts. To analyze this aspect, a factor of analysis
is the number of errors made during the modeling.
A previous survey Agner and Lethbridge (2017)
indicates Astah as a modeling tool used considerably
for teaching and practicing, considering their main
benefits: simple to install and learn, besides sup-
porting important notations to teach. As far as we
ICEIS 2020 - 22nd International Conference on Enterprise Information Systems
444
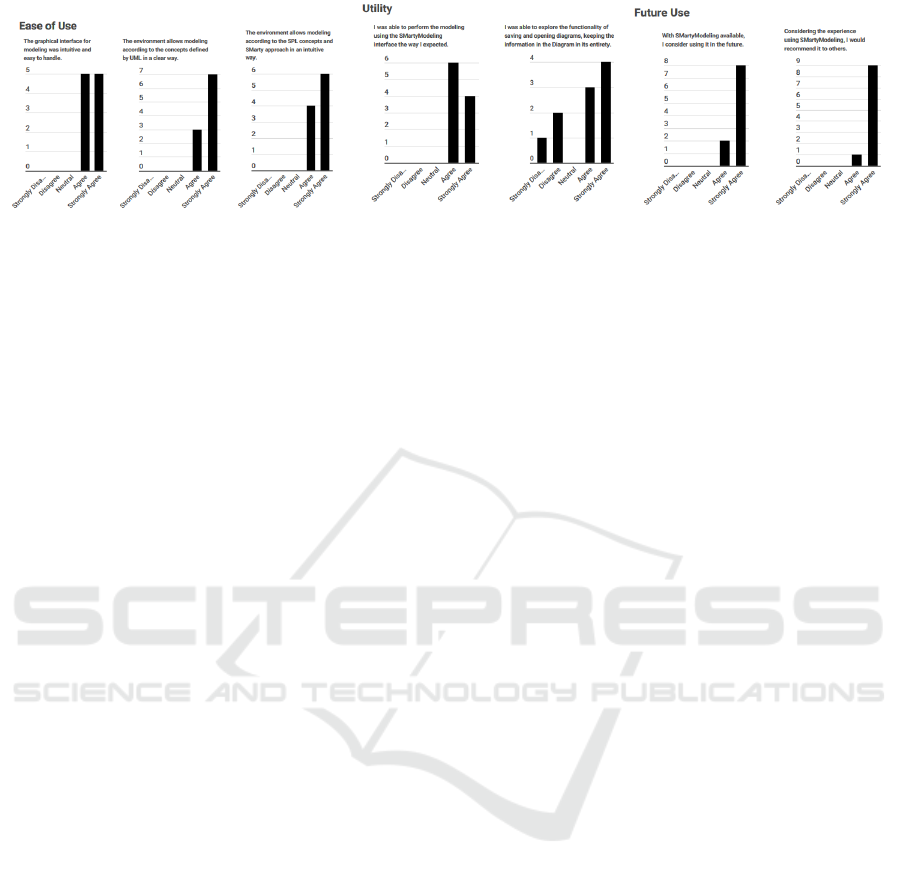
(a) Ease of Use (b) Utility (c) Future Use
Figure 2: Responses to closed questions.
know, there is no specific UML tool for SPL modeling
based on UML, except SMartyModeling. This is the
main reason we did not choose feature-based tools as,
for instance, FAMA, FeatureIDE, and pure::variants.
Therefore, we are interested, at first, in the solution
space (modeling), rather than in the problem space
(SPL features, for instance) as such other tools are.
4 THE EXPERIMENT
The proposed experiment is classified as a quasi-
experiment that relaxes the conditions imposed by
probability distributions and statistical inferences for
the population. All instrumentation and observed val-
ues of this experiment are available at https://zenodo.
org/record/3336227.
4.1 Goal and Research Questions
The goal of this experiment is to compare an SPL
modeling tool, SMartyModeling, and general UML
modeling tool, Astah, with the purpose of character-
izing them for the modeling of SPLs and variability
with respect to effectiveness and efficiency from the
point of view of researchers of SPL, in the context
of undergraduate students and masters in Computer
Science in the Software Engineering area. We chose
Astah as it is one of the most used UML general tool
(Agner and Lethbridge, 2017), and to the best of our
knowledge there is no specific tool to model UMl-
based SPL for the solution space.
According to the Goal-Question-Metric (GQM)
model, two main questions were established for our
study: “RQ1: Which tool is more efficient in
modeling SPL use case diagrams according to the
SMarty approach: SMartyModeling or Astah?”
and “RQ2: Which tool is more effective in mod-
eling SPL use case diagrams according to the
SMarty approach: SMartyModeling or Astah?”.
The term effectiveness has been used to identify
the number of correct and incorrect responses of vari-
ability modeling activities for the ADO method for
domain modeling using UML.
4.2 Planning
This section presents the planning of our experiment.
Context Selection: we adapted the AGM use case
diagram, an SPL proposed for experimental pur-
poses. The participant should model the diagram
of Figure 1 on SMartyModeling and on Astah by
taking into account the SMarty approach. Several
different stereotype-based SPL approaches might be
used, however we have lots of experience in SMarty
(OliveiraJr et al., 2010).
Hypothesis Formulation: we formulated the follow-
ing hypotheses in this study, where “var” should be
replaced with effectiveness or efficiency:
• Null Hypothesis (H0
var
): there is no differ-
ence in effectiveness/efficiency between Astah
and SMartyModeling for modeling use case dia-
grams. Therefore, H0
var
: Astah = SMartyModel-
ing;
• Alternative Hypothesis (H1
var
): there is a sig-
nificant difference in effectiveness/efficiency be-
tween Astah and SMartyModeling for modeling
use case diagrams. Therefore, H1
var
: Astah 6=
SMartyModeling.
Variables and Metrics Selection: we selected the
following variables for this experiment:
• Independent Variables: use case diagram
adapted from AGM as prefixed variable and mod-
eling tools as a factor with two treatments: Astah
and SMartyModeling.
• Dependent Variables: Efficiency and Effective-
ness are calculated for each tool (Astah, SMarty-
Modeling), defined as follows:
– Effectiveness is the precision of modeling with
one of the tools, which is the ratio between H
and TE, where:
Feasibility Analysis of SMartyModeling for Modeling UML-based Software Product Lines
445

∗ H is the discrete value that represents the rel-
evant number of correct modeled elements;
∗ TE is the discrete value that corresponds to
the total modeled elements.
– Efficiency is the ratio between Effectiveness
and TI, where:
∗ TI is the discrete value that corresponds to
time interval (in minutes) required for model-
ing the use case diagram with one of the tools.
Selection of Participants: we defined a non-
probabilistic sampling of participants, more specifi-
cally the sampling for convenience technique. This
type of sampling does not jeopardize the objectives of
this study. Participants selected for the experiment
were graduate and undergraduate students in Com-
puter Science, Information Technology, Software En-
gineering and Information Systems, with experience
in modeling software systems in UML. We con-
sidered experienced the participant who has already
modeled use case diagrams in classroom or industry.
Thirty-one (31) participants attended the experiment.
Choice of Design Type: we chose a 1x2 independent
factorial experimental design type as treatment, and
control has neither interactions nor relationships.
Instrumentation: the following materials com-
pose our instrumentation: Informed Consent Term
(ICT): contains main information on the experiment:
confidentiality, procedures and benefits. Such doc-
ument allowed participants to make their decisions
about their participation in a fair way; Characteri-
zation Questionnaire: in which the participant indi-
cated his/her respective academic degree, area of ex-
pertise, and level of experience with UML and SPL
modeling; Instructional material: contains three
parts, the first with the main concepts of SPL, the sec-
ond with the concepts about SMarty approach, and
the third with an example modeling using Astah and
SMartyModeling; and Evaluation Instrument: con-
tains the diagram to be modeled and the open ques-
tions to be evaluated qualitatively. The use case di-
agram is an adaptation of AGM as shown in Figure
1. The adaptation consisted on: two actors, eight
use cases, three extensions (counting as a single el-
ement), seven realizations (counting as a single ele-
ment), an optional variability and an inclusive vari-
ability, achieving a total of 14 elements. The main
concern was not to be a tiresome task and simultane-
ously cover all the elements of the use case diagram,
including the modeling of different types of variabili-
ties.
4.3 Operation
Pilot Project: two pilot projects were applied to eval-
uate the instrumentation. The first one was performed
with an expert in SPL, and we identified adjustments
in the instrumentation according to the results. The
second was carried out with a graduate student from
a different study area, and we defined an estimated
time required for modeling in both tools and to verify
whether the training was satisfactory.
Training: we trained all participants in essential con-
cepts on SPL, variability modeling and the SMarty
approach. All participants are undergraduate stu-
dents, with at least 3 years of disciplines focused on
teaching software engineering. In addition, examples
of SPL were presented in both environments to pre-
pare the participants for the execution of the experi-
ment. The training also explained the main function-
alities of both tools. The training lasted for 30 to 40
minutes.
During training, participants received three doc-
uments: the ICT, the characterization questionnaire,
and the instructional material. Training was per-
formed based on Mobile Media SPL use case dia-
grams. Participants were allowed to ask questions at
any time during the training sessions.
Operation Procedures: the following steps were
taken in this experiment: participant arrived at the lab-
oratory, and was allocated to a random desktop ma-
chine; applicant gave the participant all documents
of instrumentation mentioned in Section 4.2; partic-
ipant read each given document; applicant explained
the given documents; all participants read the instruc-
tions and the applicant answered their questions; par-
ticipants modeled the AGM use case diagram, shown
in Figure 1, in the two environments; participants re-
turned the instruments to the applicant and finished
their tasks in the experiment. It was up to the partic-
ipant to define the order of the environment for the
activity.
4.4 Analysis and Interpretation
Normality Testing: with the support of the R lan-
guage
6
, the Shapiro-Wilk test was applied to data col-
lected on effectiveness and efficiency for Astah and
SMartyModeling, corresponding to the following re-
sults:
Astah (N = 31):
Efficiency: mean value (µ) 1.33397, standard devia-
tion value of (δ) 0.50837, the efficiency for the Astah
was p-value = 0.6313 for the Shapiro-Wilk normality
test. In the Shapiro-Wilk test for a sample size (N) 31
6
https://www.r-project.org
ICEIS 2020 - 22nd International Conference on Enterprise Information Systems
446

with 95% of significance level (α = 0.05), p = 0.6313
(0.6313 > 0.05) and calculated value of W = 0.97389
> W = 0.929, the sample is considered normal.
Effectiveness: mean value (µ) 0.79262, standard de-
viation value of (δ) 0.16325, the effectiveness for the
Astah was p-value = 0.005625 for the Shapiro-Wilk
normality test. In the Shapiro-Wilk test for a sample
size (N) 31 with 95% of significance level (α = 0.05),
p = 0.005625 (0.005625 < 0.05) and calculated value
of W = 0.89565 < W = 0.929, the sample is consid-
ered non-normal.
SMartyModeling (N = 31):
Efficiency: mean value (µ) 0.9162659, standard devi-
ation value of (δ) 0.3381597, the efficiency for the
SMartyModeling was p-value = 0.0005274 for the
Shapiro-Wilk normality test. In the Shapiro-Wilk test
for a sample size (N) 31 with 95% of significance
level (α = 0.05), p = 0.0005274 (0.0005274 < 0.05)
and calculated value of W = 0.85082 < W = 0.929,
the sample is considered non-normal.
Effectiveness: mean value (µ) 0.8571429, standard
deviation value of (δ) 0.07604152, the effectiveness
for the SMartyModeling was p-value = 0.01851 for
the Shapiro-Wilk normality test. In the Shapiro-Wilk
test for a sample size (N) 31 with 95% of significance
level (α = 0.05), p = 0.01851 (0.01851 < 0.05) and
calculated value of W = 0.916 < W = 0.929, the sam-
ple is considered non-normal.
Hypothesis Testing: for the statistical analysis of ef-
ficiency and effectiveness, the comparison between
the tools contains at least one non-normal sample,
therefore, a non-parametric test is necessary. We
used Wilcoxon-Mann-Whitney test for samples inde-
pendently.
Thus, applying the Wilcoxon-Mann-Whitney test
to analyze the efficiency, we obtained the value of W
= 736 and p-value = 0.0003284, characterizing the re-
jection of the null hypothesis (H0
e f f iciency
).
Applying the Wilcoxon-Mann-Whitney test to an-
alyze the effectiveness, the value of W = 371.5 and
p-value = 0.1117 was obtained, and we could not re-
ject the null hypothesis (H0
e f f ectiveness
).
4.5 Discussion of Results and
Improvements
Discussion on Normality and Hypothesis Testing:
Figure 3a) presents the boxplot comparing the distri-
bution of effectiveness values for Astah and SMar-
tyModeling. The difference factor for the effective-
ness calculation was closely related to the number
of correct elements, and although it was not dis-
crepant enough to allow rejection of the null hypoth-
esis, boxplot evidences better values for SMartyMod-
eling, thus suggesting a better support of SMartyMod-
eling with regard to SPL modeling.
Thus, by analyzing the collected data, we verify
that, in relation to the number of hits, SMartyModel-
ing presents better results, emphasizing the objective
of SMartyModeling to be destined to SPL modeling.
However, the time interval for modeling SMartyMod-
eling was higher, being a more significant difference
in the number of hits, which resulted in a greater ef-
ficiency for Astah. This fact evidences the need for
SMartyModeling to have a more intuitive and func-
tional interface, as presented in the open answers dis-
cussed in Section 4.5.
Discussion on Qualitative Analysis: Grounded The-
ory procedures were used to analyze the open an-
swers. Coding allows assigning labels to text parts
(open coding), and grouping and categorizing (ax-
ial encoding) them according to an expressed idea
(Corbin and Strauss, 2008).
The first task for the participants was to: “De-
scribe the differences in modeling using SMarty-
Modeling and Astah considering the concepts of
SPL”. Analyzing participant responses, we identify
the following characteristics: Automation of SPL
concepts: automation for SPL modeling was evident
using SMartyModeling in relation to Astah. In 18
responses, it was mentioned the easiness in defining
variability using SMartyModeling, highlighting the
following comments: Participant #1: “in Astah it is
necessary to manually create variability and stereo-
types, which takes a certain time to create and is
more susceptible to errors, SMartyModeling avoids
this, reducing the occurrence of errors and time to
create.” Participant #3: “In Astah it was necessary
to set each type of stereotype, while SMartyModeling
automates this process.” Participant #10: “Insertion
of variability in Astah is done manually, whereas in
SMartyModeling it is set automatically.” and Partic-
ipant #25: “In Astah, stereotypes are defined manu-
ally, while SMartyModeling automates this process.”;
Intuitive interface: it was noticeable the difference
between interface for modeling using Astah in rela-
tion to SMartyModeling. In 10 answers it was men-
tioned that it was easier to model the diagram using
Astah, highlighting the following comments: Partic-
ipant #4: “However, Astah is more user-friendly and
intuitive.” Participant #9: “When selecting and insert-
ing, for example dependencies, Astah becomes faster
in this case.” Participant #16: “Astah is more ro-
bust, easier to design a diagram regardless of project
size.” Participant #17: “The difference is that Astah
is more intuitive in creation, allowing the relationship
between elements without naming.”
The second task for the participants was: “De-
Feasibility Analysis of SMartyModeling for Modeling UML-based Software Product Lines
447
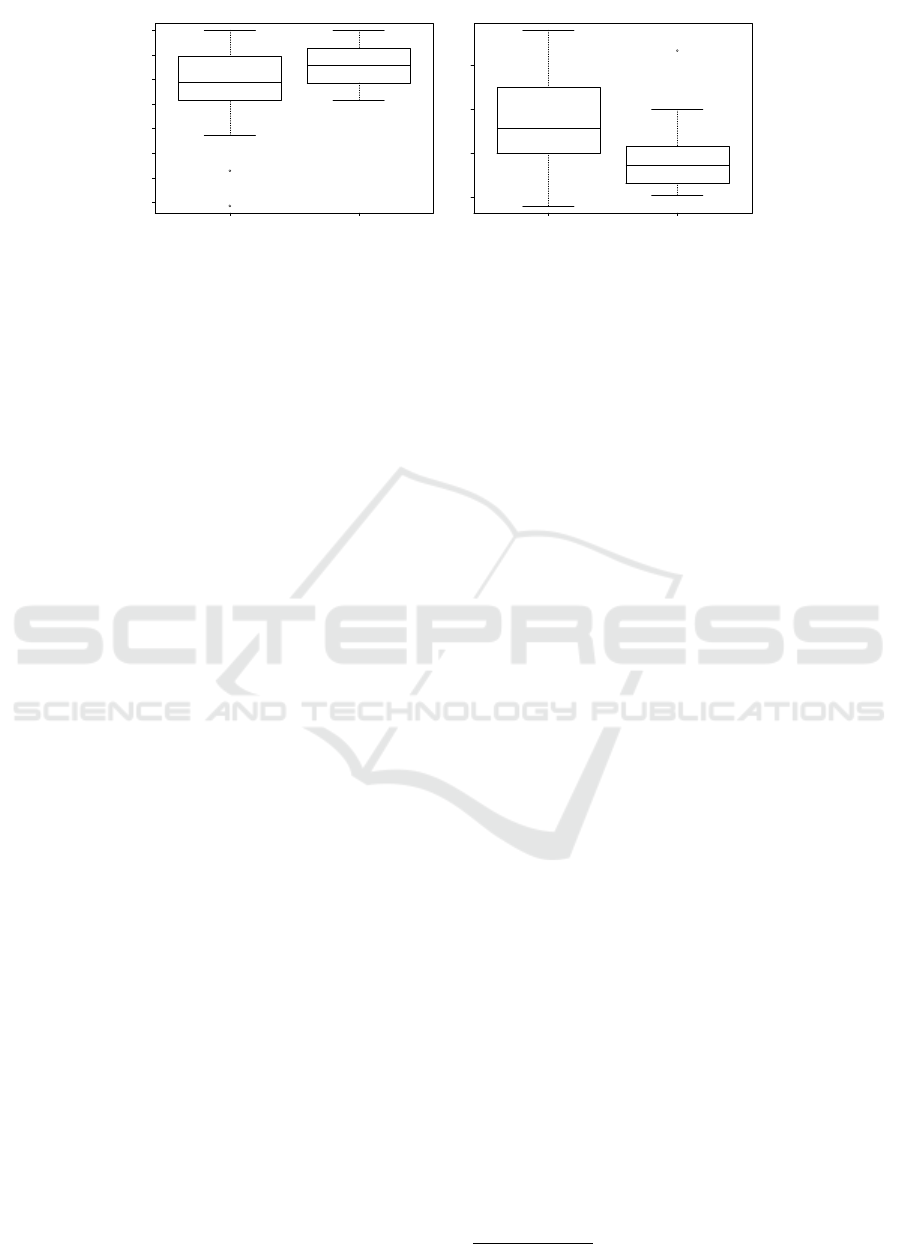
Astah SMartyModeling
0.3 0.4 0.5 0.6 0.7 0.8 0.9 1.0
(a) Effectiveness
Astah SMartyModeling
0.5 1.0 1.5 2.0
(b) Efficiency
Figure 3: Astah and SMartyModeling: Effectiveness and Efficiency.
scribe the general positive and negative points
identified by you during modeling using SMarty-
Modeling”. Analyzing the answers, we identify the
following positive points: Ease of Use: in 9 responses
the ease of use of SMartyModeling was described,
with the following comments: Participant #2: “it is
easy to learn how to use this tool, even with little
experience in modeling, it was not difficult to use
SMartyModeling.” Participant #5: “ease to create use
cases.” Participant #12: “easy to understand and to
create objects.” and Participant #24: “ease of use to
create a variation point.”; Interface Simplicity: in
7 responses it was mentioned the simplicity of using
SMartyModeling, with the following comments: Par-
ticipant #1: “friendly and lightweight interface.” Par-
ticipant #3: “productivity and speed in developing di-
agrams.” Participant #9: “after learning the software
feature, it becomes practical.” Participant #12: “sim-
ple and clear interface.” and Participant #23: “lower
complexity of understanding, simple and fast genera-
tion of variability.”
In relation to improvement points on SMartyMod-
eling, we identified: Association between Elements:
in 13 responses the difficulty in defining, editing or
removing an association using SMartyModeling, with
the following comments: Participant #3: “I cannot re-
move only the relationship.” Participant #6: “diffi-
culty of removing associations.” Participant #8: “no
delete or edit relationships.” Participant #13: “some
actions need more steps to be taken, such as creat-
ing associations or extensions.” and Participant #17:
“does not allow the association dragging the objects.”;
Resizing Modeling Panel: in 10 responses it was evi-
denced the need to resize the modeling panel of SMar-
tyModeling, with the following comments: Partici-
pant #10: “improvements are needed such as window
resizing.” Participant #14: “improvements like screen
resizing and screen positioning.” and Participant #16:
“does not allow screen resizing.”; Usability: in 15
responses some difficulties were noted to use during
the modeling in SMartyModeling, with the following
comments: Participant #10: “not very intuitive to use,
requiring interface improvements and shortcuts.” Par-
ticipant #18: “does not allow copying and pasting.”
Participant #21: “back button has undone all the job
done.” Participant #24: “does not allow undoing ac-
tions and similar tasks.” and Participant #31: “diffi-
culty to drag elements and to undo actions.”
According to the points raised in the qualitative
analysis in this experiment, we identify assumptions
on the efficiency and effectiveness of tools. As-
tah interface is considered more intuitive in rela-
tion to SMartyModeling based on the idea that the
time required for modeling with SMartyModeling
was longer. The points to improve also explain the
longer time required for modeling in SMartyModel-
ing, especially the identified functionality related to
usability, including shortcuts and element copying.
In relation to the effectiveness of SMartyModel-
ing, the automation of SPL concepts evidenced to be a
factor that reinforces the decrease of modeling errors
in relation to Astah. The fact that in Astah the manual
definition of stereotypes and variabilities is necessary,
makes it more susceptible to errors during modeling,
compared to the SMartyModeling interface that spec-
ifies the fields for the definition of variabilities and
automatically includes stereotypes.
A second version of SMartyModeling has been
developed, taking into account the identified points,
mainly redefining its interface, with the aim of im-
proving ease of use and usability. The main change
was in the modeling panels, which were rewritten us-
ing the JGraph
7
library. Such improvements are dis-
cussed next.
SMartyModeling used to use UML notes to rep-
resent a variability and tagged-values. For the AGM
use case diagram (Figure 1) we have no usability is-
sues as it is a small diagram. However, for a large
SPL make the diagram illegible. An identified alter-
native is to allow users to hide/show the variability
7
https://github.com/jgraph/jgraphx
ICEIS 2020 - 22nd International Conference on Enterprise Information Systems
448

notes. Therefore, for the second version, we chose to
hide the UML notes from the modeling panel, how-
ever, maintaining stereotypes related to SPL concepts.
The variability attributes will be presented in the In-
formation Panel (Component E) in Figure 1. This will
not compromise the readability of the entire diagram.
To improve usability of SMartyModeling, we in-
cluded a zoom+ button and a zoom- button in Compo-
nent A. Furthermore, we identified the need to define
a single window for modeling, already including the
information, buttons and the file panels. For the sec-
ond version, we chose to avoid, if possible, the use of
modal windows during modeling. Therefore, the use
of the JGraph library allows the creation of new ele-
ments and associations directly in the modeling panel.
For edits, we have chosen to allow editing of attributes
in an Information Panel.
As SMartyModeling required longer time for
modeling diagrams, we improved it by making select-
ing and dragging/dropping elements more intuitive.
For the second version, we expand the mouse events
for the Modeling Panel. The new events allow the cre-
ation, alteration, removal of the elements directly in
the modeling. They also include resizing, movement
and definition of points for associations.
For importing and exporting project information,
the classes in the second version were rewritten using
the org.w3c.dom
8
Package. Project information con-
tinues to be organized in a hierarchical tag file. How-
ever, the export classes have been rewritten using their
own classes to handle tag documents.
5 CONCLUSION
We analyzed the feasibility of SMartyModeling in
two studies: one qualitative and one experiment.
The qualitative study allowed identifying the
points to be improved, in particular, the limitation of
the interface in manipulating the elements and defin-
ing the associations of SMartyModeling elements.
Then, we performed an experiment to identify
efficiency and effectiveness of SMartyModeling and
Astah, and to provide initial evidence on the feasibil-
ity of SMartyModeling and its further development.
Generally analyzing, SMartyModeling helps the
variability modeling for SPL, but some further re-
search and development will help to improve it. New
experiments and replications should be planned and
conducted to reduce threats to analyze the efficiency
and effectiveness of SMartyModeling in relation to
8
https://docs.oracle.com/javase/8/docs/api/org/w3c/
dom
other well-evaluated tools as those in the Agner and
Lethbridge (2017) survey and to generalize the re-
sults. Extending this experiment to more complex
SPLs and support to other UML diagrams should be
performed.
REFERENCES
Agner, L. T. W. and Lethbridge, T. C. (2017). A survey of
tool use in modeling education. In ACM/IEEE MOD-
ELS, pages 303–311, USA. IEEE.
Bashroush, R., Garba, M., Rabiser, R., Groher, I., and Bot-
terweck, G. (2017). Case tool support for variability
management in software product lines. ACM Comput.
Surv., 50(1):14:1–14:45.
Berger, T., Rublack, R., Nair, D., Atlee, J. M., Becker,
M., Czarnecki, K., and W ˛asowski, A. (2013). A sur-
vey of variability modeling in industrial practice. In
VaMoS, VaMoS ’13, pages 7:1–7:8, New York, NY,
USA. ACM.
Chen, L., Ali Babar, M., and Ali, N. (2009). Variability
management in software product lines: A systematic
review. In SPLC, SPLC ’09, pages 81–90, Pittsburgh,
PA, USA. Carnegie Mellon University.
Corbin, J. and Strauss, A. (2008). Basics of Qualitative
Research: Techniques and Procedures for Developing
Grounded Theory. Sage Publications, Thousand Oaks,
Califórnia, USA.
Davis, F. D. (1989). Perceived usefulness, perceived ease of
use, and user acceptance of information technology.
MIS Q., 13(3):319–340.
Galster, M., Weyns, D., Tofan, D., Michalik, B., and Avge-
riou, P. (2014). Variability in software systems - a sys-
tematic literature review. IEEE TOSEM, 40(3):282–
306.
Linden, F. J. v. d., Schmid, K., and Rommes, E. (2007).
Software Product Lines in Action: The Best Indus-
trial Practice in Product Line Engineering. Springer-
Verlag, Berlin, Heidelberg.
Lisboa, L. B., Garcia, V. C., Lucrédio, D., de Almeida,
E. S., de Lemos Meira, S. R., and de Mattos Fortes,
R. P. (2010). A systematic review of domain analysis
tools. Inf. Softw. Technol., 52(1):1–13.
OliveiraJr, E., Gimenes, I. M. S., and Maldonado, J. C.
(2010). Systematic management of variability in uml-
based software product lines. JUCS, 16(17):2374–
2393.
Pereira, J. A., Constantino, K., and Figueiredo, E. (2014).
A systematic literature review of software product
line management tools. In Software Reuse for Dy-
namic Systems in the Cloud and Beyond, pages 73–89,
Cham. Springer International Publishing.
Raatikainen, M., Tiihonen, J., and Männistö, T. (2019).
Software product lines and variability modeling: A
tertiary study. JSS, 149:485 – 510.
Feasibility Analysis of SMartyModeling for Modeling UML-based Software Product Lines
449
