
Efficient and Selective Upload of Data from Connected Vehicles
Zaryab Khan
1,2
and Christian Prehofer
1
1
DENSO Automotive Germany, Germany
2
Technical University of Munich, Germany
Keywords:
Connected Vehicles, Data Collection, Connected Mobility.
Abstract:
Vehicles are evolving into a connected sensing platform, generating enormous amounts data about themselves
and their surroundings. In this work, we focus on the efficient data collection for connected vehicles, exploit-
ing the fact that the context data of cars on the same road is often redundant. This is for instance relevant for
applications which need roadside data for map updating. We propose a vehicular data dissemination archi-
tecture with a central coordination scheme to avoid redundant uploads. It also uses roadside WiFi hotspots
opportunistically. To evaluate the benefits, we use the SUMO simulator to benchmark our results against a
baseline solution, showing improvements of factor 10 up to 20.
1 INTRODUCTION
Current vehicles are evolving into a sensing platform,
generating a large amount of real-time data about the
vehicles and their surroundings with cameras, radars
and other sensors. This has led to a huge demand
for data-driven mobility services ranging from traf-
fic management, predictive maintenance, smart cities
to driving behavior analysis. It is forecasted that au-
tonomous cars will generate up to 3,600 gigabytes of
data per hour. An example is road surveillance, where
vehicles equipped with different sensors continuously
monitor the environment
In this work, we focus on the upload of vehicle im-
age data, e.g. for automatic map updating. The goal of
this work is to reduce the upload traffic in connected
vehicles over cellular data connections. We aim to
achieve this goal with two techniques: Firstly, by re-
ducing redundant data and, secondly, by opportunisti-
cally using the available roadside wireless infrastruc-
ture to offload mobile data to WiFi. We also use dif-
ferent priorities of the collected data to support differ-
ent kinds of services. The redundancies are detected
by a central control point where vehicles upload im-
age metadata. Overall, our vehicular data dissemina-
tion architecture follows the idea of reverse content
delivery networks (Moustafa et al., 2017), yet focuses
specifically on avoiding redundant data and on effi-
cient upload.
The goal of this work is to analyze the factors
which influence the performance of our efficient data
collection in simulations. We evaluate performance
using SUMO (Lopez et al., 2018), an open source
traffic simulation suite, to simulate the mobility pat-
terns of vehicles. The models of SUMO are consid-
ered to be close to real world. Furthermore, we sim-
ulate multiple cities as well as the scalability to up
to 100.000 vehicles. We show that the benefits range
from factor 10 up to factor 20.
To our knowledge, there is no comparable work
focusing on this specific redundancy avoidance with
central control. This paper is a short version of the
thesis in (Khan, 2019).
2 APPROACH
Our approach is motivated by the existing concept
of content delivery networks (CDN) (Saroiu et al.,
2002), which mainly focus on web content. CDNs
use local copies of content to deliver it efficiently to
the end user. For vehicles as data sources, reverse
CDN (R-CDN) was recently proposed in (Moustafa
et al., 2017), focusing on different optimizations for
the upload of video streams.
Compared to existing approaches, the main point
of this work is that many services do not require all
pictures from all cars. For instance, updates every few
seconds or minutes may be enough to detect changes
on the roadside or parking lots or similar. Then, the
point is that the same piece of a road may be visited
by many cars in one minute, and one picture from one
Khan, Z. and Prehofer, C.
Efficient and Selective Upload of Data from Connected Vehicles.
DOI: 10.5220/0009790105590566
In Proceedings of the 6th International Conference on Vehicle Technology and Intelligent Transport Systems (VEHITS 2020), pages 559-566
ISBN: 978-989-758-419-0
Copyright
c
2020 by SCITEPRESS – Science and Technology Publications, Lda. All rights reserved
559

Figure 1: Image upload with Roid R-CDN.
car may be enough.
Our approach is called Roid: An R-CDN based
selective vehicular data dissemination architecture.
We assume that cars continuously upload the meta-
data of pictures, including time and location to the
control server. The server assigns priorities and sends
requests to vehicles. These upload requested the pic-
tures based on priorities. The main goal of this paper
is to quantify and detail the benefits of our approach
in realistic simulations.
The second mechanism which we employ is of-
floading cellular network traffic to WiFi networks
along the roadside. The reason behind this is that
WiFi technology is typically cheaper than cellular
technology (Fogg, 2018). This means that, depend-
ing on the priority, data is sent on cellular networks
only if no WiFi network was found for a specific time
period, e.g. 30 seconds.
As illustrated in Figure 1, the Roid architecture
employs a Control Server (CS) between vehicles and
the cloud storage and processing platform. The pur-
pose of the CS is to orchestrate the vehicles based on
the demand of images in the cloud. The figure shows
a simple case where an image of a vehicle 2 does not
need to be uploaded as a similar one from vehicle 1
already exists.
A key assumption of the Roid architecture is that
the CS is aware of a complete road network that it
overlooks. The participating cars in this road network
are connected to it and continuously transmit meta-
data like location of pictures taken. The road network
is divided into road segments (typically 30-100m in
length).
The CS server aims to have an up to date picture of
every road segment. Thus, the CS server keeps track
of the latest uploaded image for each segment and
identifies needed images. Clearly, for each segment,
a new image is needed every few minutes. Secondly,
the CS assigns priorities to each segment, which is
done stochastically based on normal distribution. On
the vehicle side, the images are locally stored in five
queues, based on five demand classes of the images.
Roid also aims to offload a significant amount of
upload traffic to WiFi. Each road segment is associ-
ated to one of these five road segment demand classes.
Then, the CS assigns images from this segment the
corresponding demand class. For each class, the ve-
hicles have different policies regarding WiFi uploads.
Road segments belonging to the maximum class re-
quire no waiting for WiFi, while the others will have a
WiFi waiting time before cellular upload is attempted.
3 IMPLEMENTATION AND
EVALUATION
For the evaluation, we decided to use the Simulation
of Urban Mobility (SUMO) traffic simulation suite
(Lopez et al., 2018). Our Roid implementation is built
on top of SUMO simulator.
The activity diagram presented in Figure 2, de-
scribes the flow of activities in the Roid simulation.
We will go over these step by step below.
1. Start Simulation. The simulation is initialized
in the Roid module by TraCI, an API to interface
ongoing, running simulations. The simulation is
initialized with a number of parameters.
2. 1 Unit Step Into Simulation. The simulation
proceeds in cycles of one time unit.
3. Subscribe to Values of New Vehicles in Simu-
lation. In TracCI, it is possible to subscribe to
the properties of vehicles running in a simulation.
This approach is faster than getting a list of all the
vehicles in each time step of the simulation.
4. Loop Over the Simulated Vehicles. The ap-
proach we follow in this implementation is to loop
over all the spawned vehicles in each time step
and then perform specific Roid operations on each
vehicle, including their communication with the
Control Server. In the following steps, we will be
performing operations on a single vehicle loop of
vehicles as depicted by the dotted box in Figure 2.
5. Vehicle Takes Image. In each time step, we sim-
ulate vehicles taking an image of the road.
6. Vehicle Saves Image Locally. Every image is
first stored in the local vehicle storage before it
is uploaded to the cloud.
7. Vehicle Sends Image Metadata to Control
Server over Control Connection. The image ID,
time and road segment ID are transferred to the
server over the control connection.
8. Server Saves the Image Metadata in a Data
Structure. The server keeps track of the image
metadata received by saving it in a dictionary.
9. Image Required. If additional (not yet requested)
images are required for some road segments, we
proceed with the next step.
10. Server Instructs Vehicle to Send Images. If the
Roid Control Server determined that a particular
VEHITS 2020 - 6th International Conference on Vehicle Technology and Intelligent Transport Systems
560
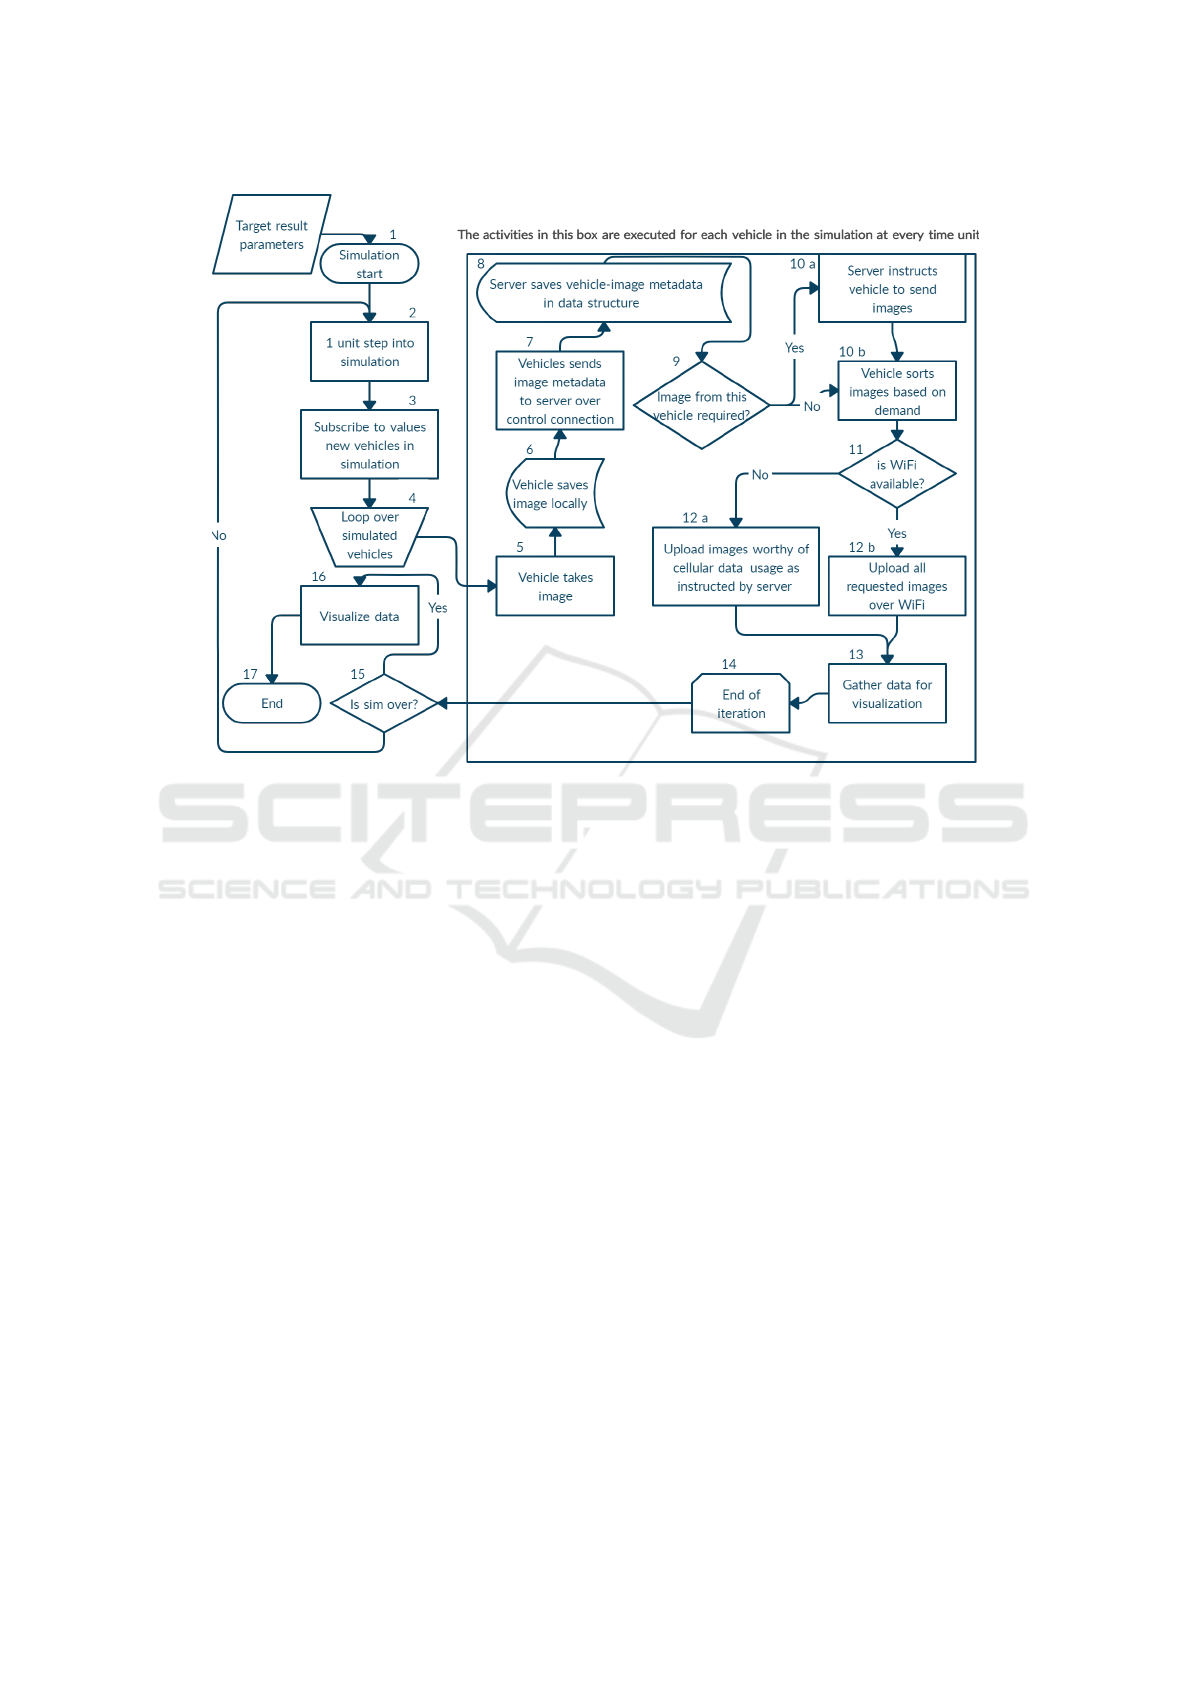
Figure 2: Activity Diagram of Roid Simulation.
image should be saved to the cloud, it requests the
image and includes the demand class for the road
segment.
11. Vehicle Images are Sorted based on Demand.
On the vehicle side, the images are locally stored
in queues for demand class and newly requested
images are added.
12. WiFi Case Distinction. If WiFi is available, only
WiFi is used in this unit time step.
13. Upload Images. The images that are requested
by the Control Server are uploaded using cellular
data or WiFi, following the priority order.
14. Visualize Data. After all the simulation is tra-
versed, the Roid module calls a visualization
module.
3.1 Evaluation
The performance of Roid will be compared to a sim-
ple upload version, where every vehicle uploads as
much data as possible, and as early as possible. We
use the city of Monaco as our standard scenario for
conducting simulations. The reason for choosing
Monaco is because this is the simulation model that
is recommended by the SUMO open source commu-
nity itself and provides a very realistic traffic model
(Codeca and Harri, 2017).
Table 1 shows the parameters used in the standard
scenario for conducting the Roid performance evalu-
ation test.
WiFi Waiting Time describes the waiting time, be-
fore uploading the image using cellular data.
1. Maximum demand image: 0 seconds
2. High demand image: 60 seconds
3. Average demand image: 300 seconds
4. Low demand image: Only WiFi upload.
5. Minimum demand image: No upload.
In the above standard scenario, there exist roughly
2500 WiFi hotspots spread out over the road network.
The majority of these WiFi hotspots are located at
junctions. For priorities, we assign a demand class
to road segments based on a normal distribution.
Figure 3 shows the results of running a simula-
tion in the standard scenario without using Roid. For
the first 3000 seconds, there are less than 50 vehicles
running in the simulation. After that there is a surge
in the traffic of vehicles till the simulation reaches a
value of 1000 vehicles. The number of vehicles in the
system roughly stays the same till we reach the 28000
Efficient and Selective Upload of Data from Connected Vehicles
561
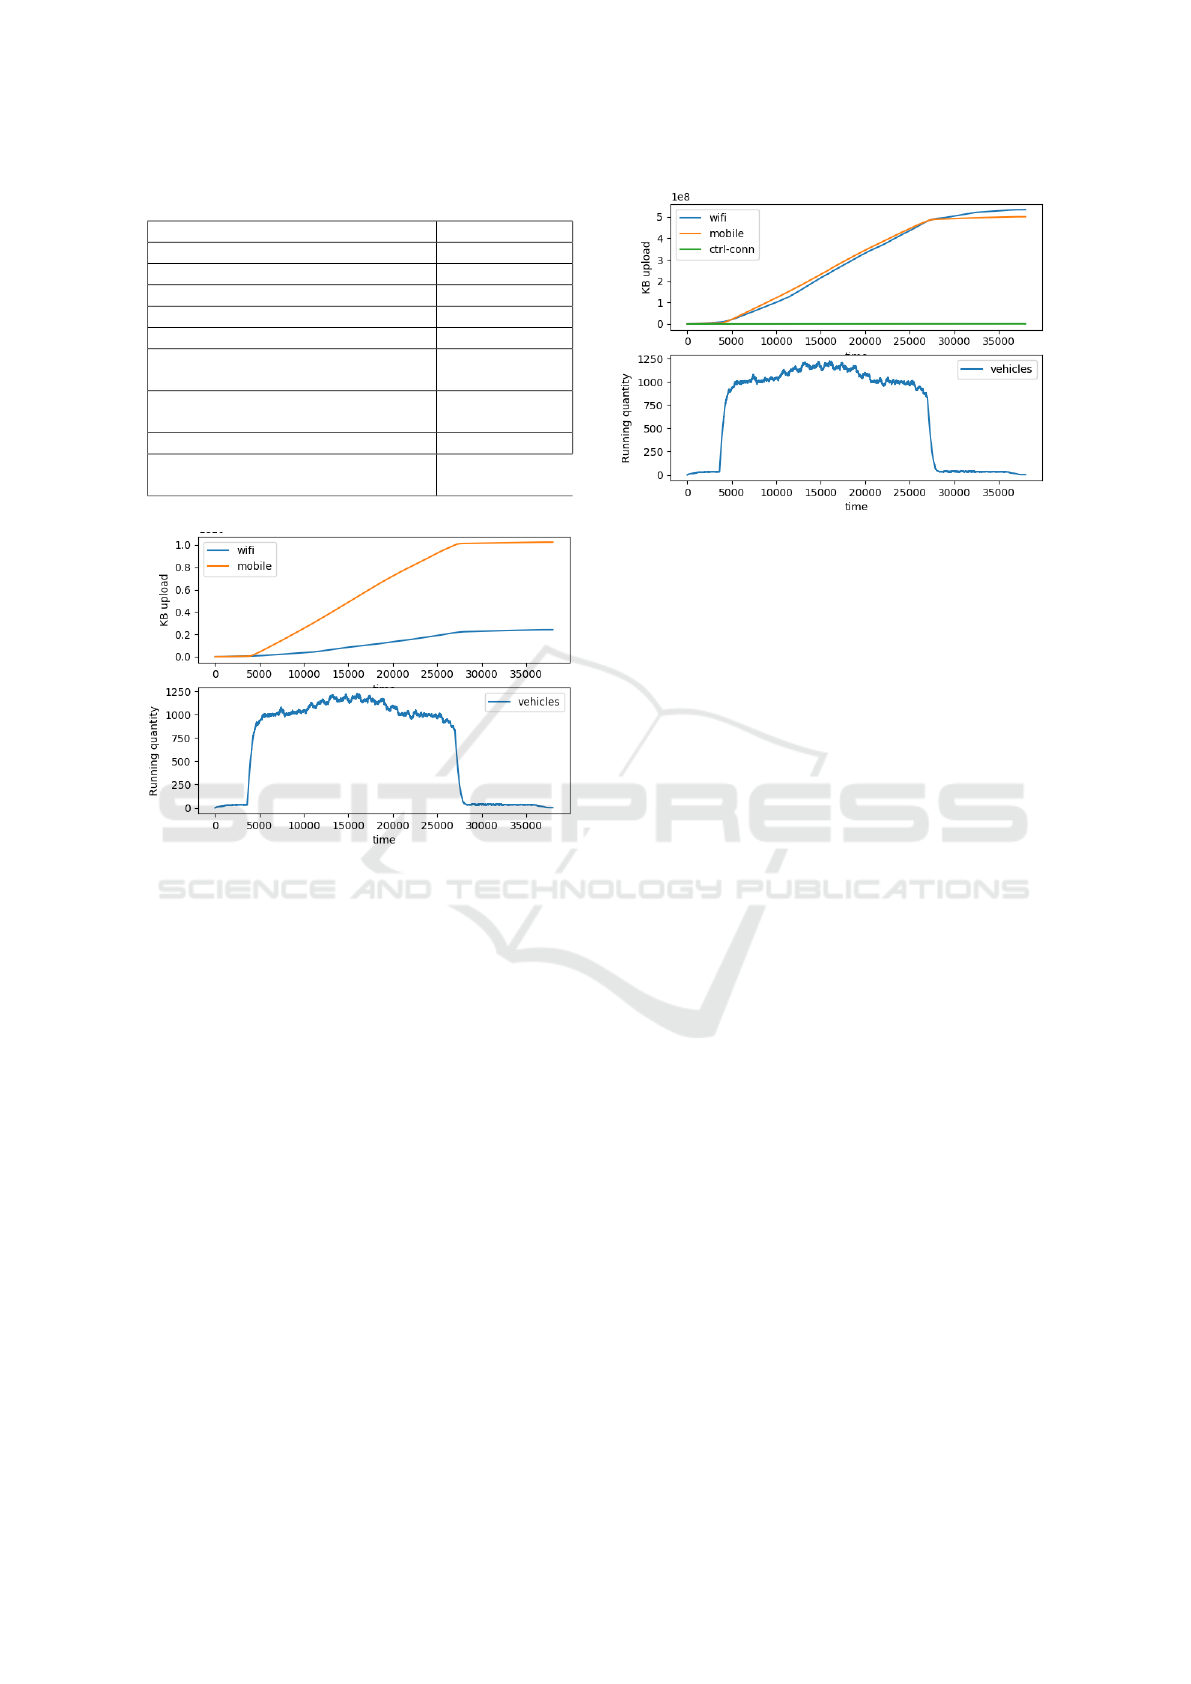
Table 1: System Scenario for Evaluating Roid.
Parameter Value
City Monaco
Unit Time Step 5 seconds
Image Capture Frequency 1 Time Step
Time Limit 36000 seconds
Vehicle upper limit 1000
WiFi Waiting time for Average De-
mand Images
300 seconds
WiFi Waiting time for High Demand
Images
60 seconds
Percentage of active WiFi hotspots 100%
Cellular data packet drop rate &
100%
Figure 3: Total uploads in standard scenario without Roid
(in scale of 1e10).
second mark. After that the number of vehicles in the
simulation quickly drop off to almost 0 vehicles.
The surge of traffic at the 3000 second mark char-
acterizes the rising number of vehicles, for instance
in the morning. Shortly after the surge of vehicle traf-
fic, the vehicles are distributed over the simulation be-
cause the vehicles are spawned over different regions
of the map. Finally, the drop off of vehicles towards
the end of the simulation characterizes the decrease in
vehicular traffic after peak traffic hours have elapsed.
As expected, the total data upload over both WiFi
and mobile connections increases drastically when
more vehicles are active in the simulation. Towards
the end of the simulation, there is 5x more data up-
loaded over cellular connection compared to WiFi
connection. This behavior is expected of the naive,
non-Roid approach as mobile connections are avail-
able all over the map whereas WiFi is available only in
selected regions where uploading over WiFi connec-
tion takes priority over cellular uploads. At the end of
the simulation there was roughly 1 * 10
10
KB of data
uploaded using cellular network and roughly 2 * 10
9
KB of data uploaded using WiFi hotspots. Figure 4
Figure 4: Total uploads in standard scenario with Roid (in
scale of 1e8).
shows the results with the Roid architecture. Please
note that this shows uploads in terms of 10
8
, versus
10
10
in Figure 3.
As seen in Figure 4, the total data upload using the
WiFi and mobile connections are remaining roughly
the same for the whole duration of simulation. Com-
paring this behavior with the results from the non-
Roid simulation confirms that the Roid architecture is
successful in offloading data upload from cellular net-
works to WiFi. The total data upload has also drasti-
cally decreased for both the mobile and WiFi connec-
tions, with the reduction of upload in the former being
more significant than the reduction in the upload of
the latter. At the 28000 second mark, the total upload
for mobile connection has reduced from 1 * 10
10
KB
to 5 * 10
8
KB. The total upload for WiFi connection
has been reduced from 2 * 10
9
KB to 5 * 10
8
KB.
In this experiment using Roid has reduced the mo-
bile connection uploads by 95.1 %. This is quite a
drastic improvement in the efficiency of cellular data
uploads, which is achieved by minimizing redundant
image uploads and WiFi offloading. The reduction in
uploads on WiFi connections using Roid is 77%. It
may be argued that as Roid offloads data upload from
mobile to WiFi connections, there should be an in-
crease in the total amount of WiFi data upload. This is
not the case as the overall upload volume goes down.
Figure 5 presents the average delay in the upload
of images based on the demand class values. As ex-
pected, the images with maximum demand are in-
stantly uploaded to the Control Server using the cellu-
lar connection. Hence the waiting time of 0 seconds.
The high demand images have a waiting time of 60
seconds per picture. The waiting time for average de-
mand images is a little over 80 seconds while that of
low demand images is around 95 seconds.
Notice that initially, there is high demand as very
VEHITS 2020 - 6th International Conference on Vehicle Technology and Intelligent Transport Systems
562
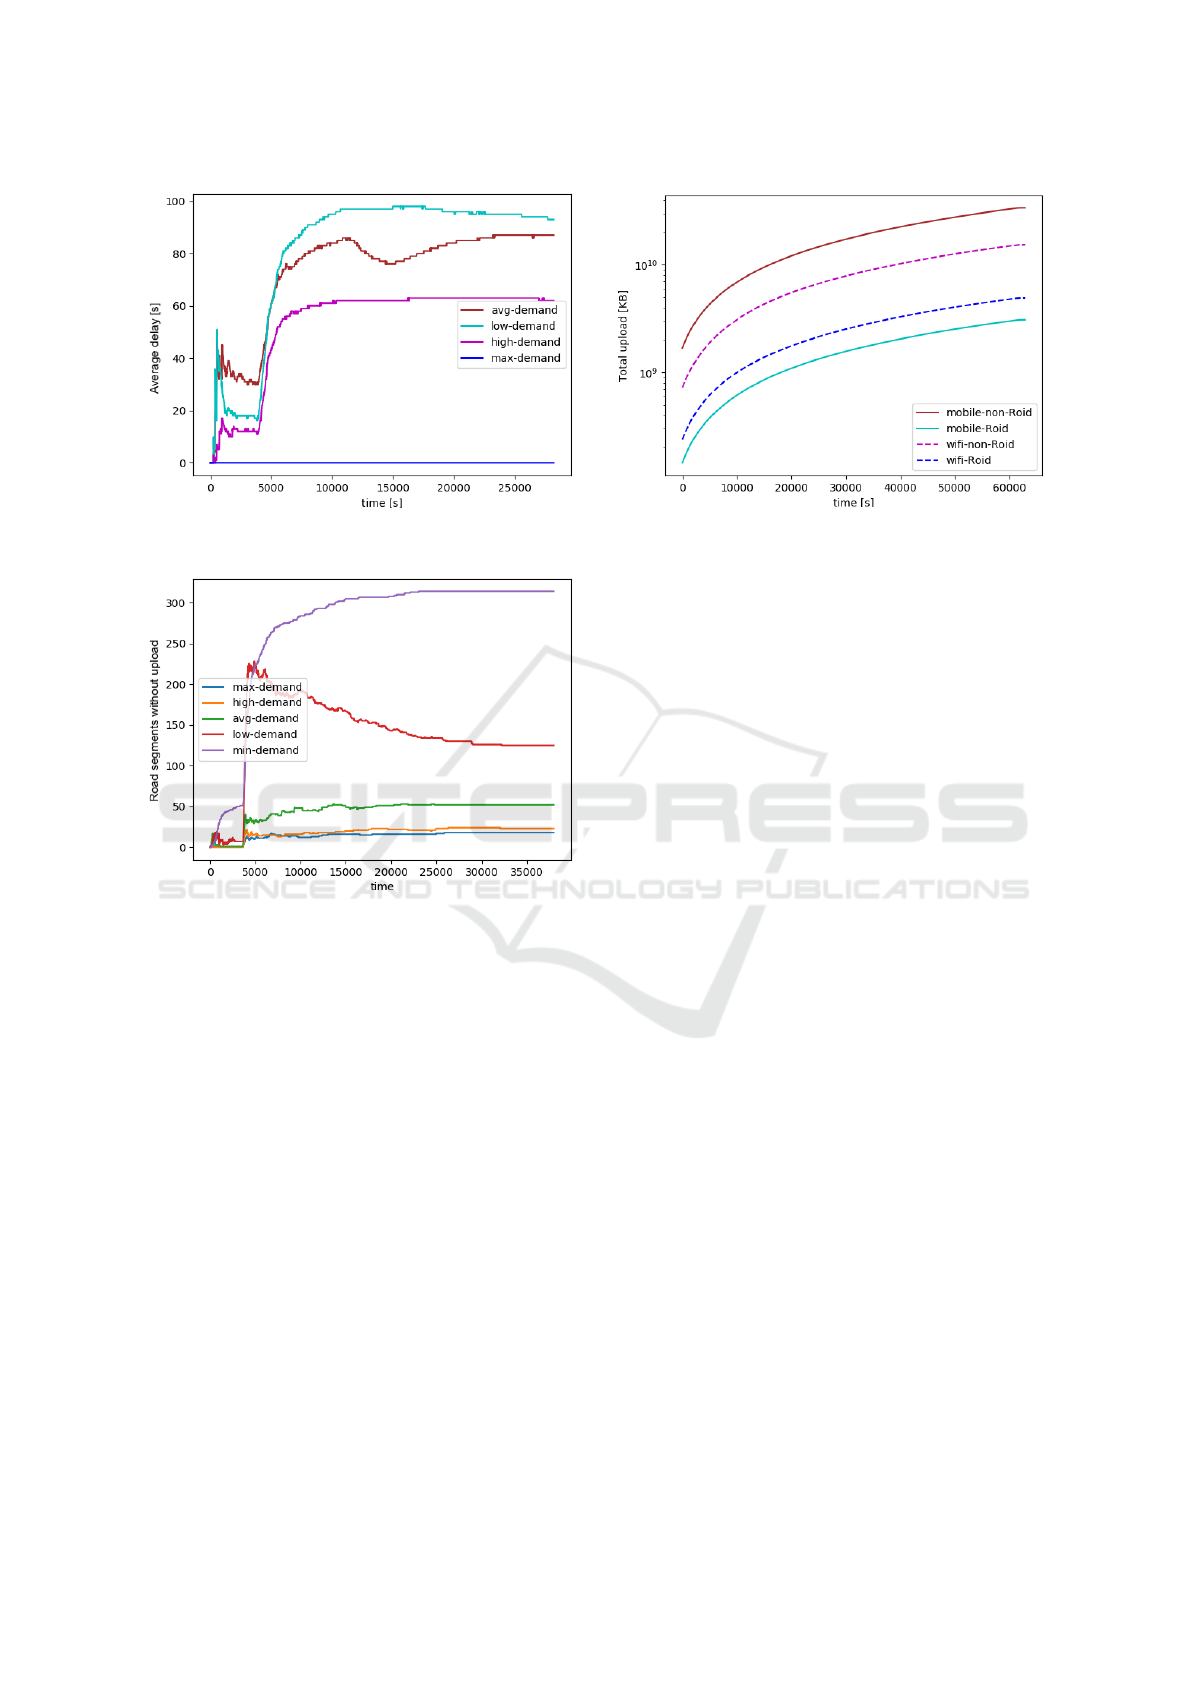
Figure 5: The average delay in uploading images based on
the demand classes.
Figure 6: Pictured road segments not uploaded to the Con-
trol Server.
little roadside pictures are available. Demand then in-
creases again as more vehicles enter at time roughly
50000, which then levels off due to some saturation
of available pictures.
The waiting times specified for the high demand
and average demand classes respectively are 60 and
300 seconds. The graph however shows less wait-
ing time than specified in the demand classes because
these images can also be uploaded on WiFi connec-
tion with less delay than specified by the image de-
mand classes. This reduces the value of the average
delay in upload time for the image classes.
Figure 6 presents the number of road segments
that were pictured by at least one vehicle but still none
of those images were uploaded to the Control Server.
In a non-Roid simulation, all the pictured road seg-
ments are eagerly uploaded to the Control Server and
may reduce the delay if no overload occurs.
Roid however considers the demand class of im-
ages to minimize the cost of using Roid. The demand
class with the highest number of road segment images
Figure 7: Total WiFi and Mobile upload comparison in
Cologne scenario.
not uploaded to the server is the minimum demand
image class with a value of 322. Next comes the low
demand class with 127 road segments not uploaded to
the Control Server, then average, high and maximum
in the specified order.
Thus, in this simulation setup, images of impor-
tant road segments almost always get uploaded to the
control server while unimportant road segments may
be neglected, and their images not uploaded to the
control server. This strategy minimizes the cost of
using Roid.
For our evaluation, we also considered other
cities. Figure 7 shows the total data uploaded for
a simulation conducted in the city of Cologne with
1000 cars. The total data uploaded using cellular net-
work in the non-Roid simulation was close to 3 * 10
10
KB. Using Roid, this value drops down to around 2.5
* 10
9
KB. A reduction of almost 91% of cellular net-
work usage and an 11-fold efficiency gain.
In the next experiment we investigate the effects of
the total number of cars running in a scenario to the
efficiency achieved by Roid. Figure 8 shows the WiFi
and mobile uploads for 100,000 vehicles running in
the city of Cologne.
Compared to the scenario where only 1,000 vehi-
cles were running at a time in the city of Cologne, the
performance benefit of Roid in this experiment has
increased from of 11x to 17.73x. As the number of
vehicles in a simulation scenario increases, the con-
gestion on the road network increases. As the conges-
tion on road network increases, the average speed of
vehicles decreases, especially at intersections where
queues form. Many WiFi hotspots are located around
these intersections. The stationary vehicles stuck in
traffic near these intersections are able to offload more
data from cellular connection to WiFi. This conforms
to the data of average WiFi availability for vehicle
trips as presented in Table 2.
Efficient and Selective Upload of Data from Connected Vehicles
563
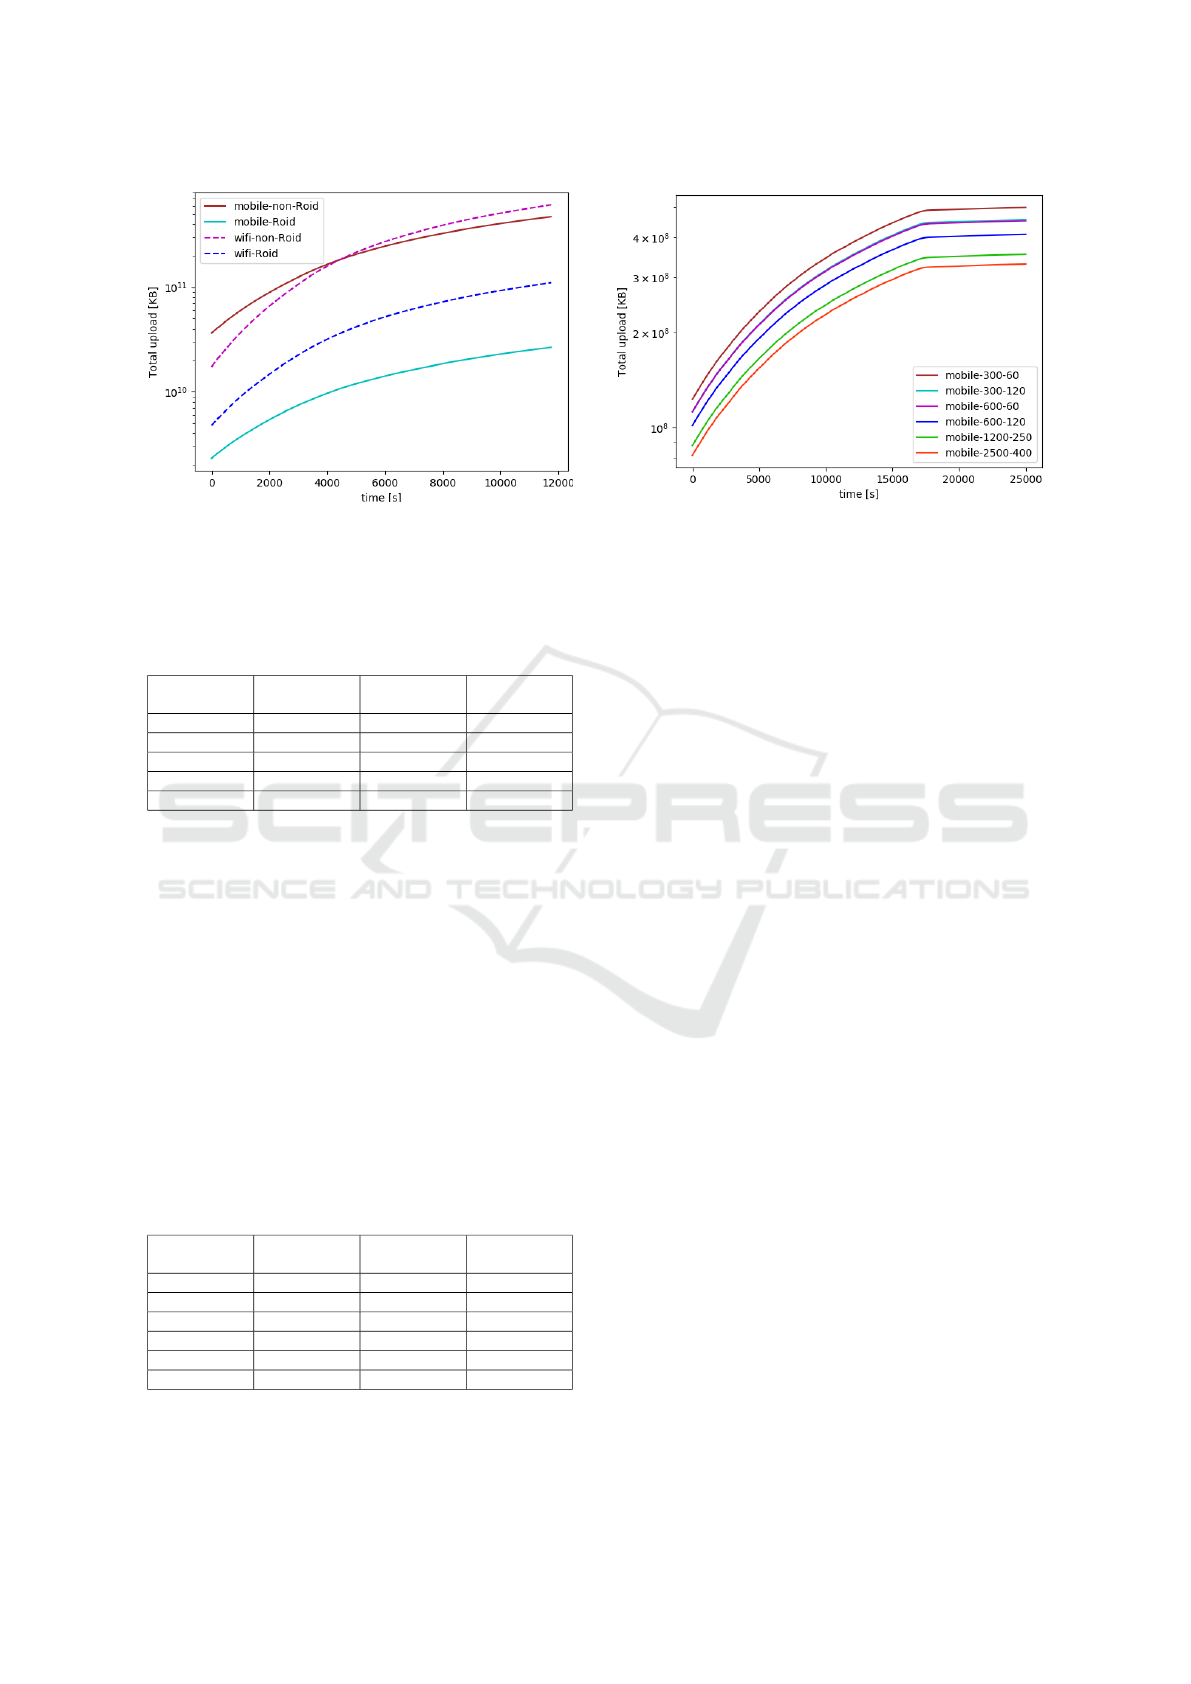
Figure 8: Total WiFi and Mobile upload comparison for
100,000 vehicles in Cologne scenario.
Table 2 shows the benefit of Roid with increase in the
number of vehicles.
Table 2: Roid performance in Cologne Scenario.
Max Vehicle
Limit
Mobile Data
Reduction
Efficiency
Gain
Avg. WiFi
Availability
1,000 91% 11x 14.4
10,000 91.4% 11.7x 22.5
25,000 92.1% 12.7x 25.8
50,000 93% 14.4x 28.1
100,000 94.3% 17.73x 30.3
In this experiment, we will change the WiFi waiting
time for high demand images and average demand im-
ages and see how the mobile data uploads can be fur-
ther reduced.
Table 3 shows the performance of Roid in six
simulations instantiated with unique values for the
average Demand Image and High Demand Image
WiFi waiting times. The first row of the table cor-
responds to the parameters in the standard scenario.
As expected, higher waiting times for image demand
classes result in efficiency gains for mobile uploads
while efficiency losses for WiFi uploads as more data
is offloaded from mobile connection uploads to WiFi
uploads.
Table 3: Roid performance with different WiFi Waiting
Times.
Average De-
mand Image
High De-
mand Image
Efficiency
Gain Mobile
Efficiency
Gain WiFi
300 60 1x 1x
300 120 1.09x 0.93x
600 60 1.10x 0.93x
600 120 1.21x 0.92x
1200 250 1.40x 0.91x
2500 400 1.51x 0.90x
Figure 9 visualizes the experiments with the plots of
Figure 9: Total uploads on mobile connection based on im-
age demand class values.
the total WiFi uploads for the different Image Demand
Wait times. The labels of Figure 9 correspond to the
tuple of average Demand Image and High Demand
Image parameters. As the WiFi wait times increase,
the total uploads decrease. However, the decrease in
total uploads is not significant.
Even as the waiting times for Average Demand
and High Demand are increased significantly to the
values of 2500 s and 400 s respectively, the efficiency
gain achieved for mobile uploads is only 1.51x. That
is not a very significant efficiency gain considering
an increase in waiting time by factor 8. Similarly,
the WiFi uploads change inversely. One explanation
is that the vehicles in the simulation do not require
a long amount of time to reach WiFi hotspots. We
should also note that increasing WiFi wait time add
additional delay. In our standard Monaco scenario,
high demand images are uploaded on WiFi after an
average delay of roughly 60 seconds while the aver-
age delay for high demand images is roughly 93 sec-
onds. Compared to the standard scenario, the average
delay times for both high demand images and average
demand images are roughly the same at a value of 120
seconds.
In the standard scenario, there exist roughly 2500
WiFi hotpots spread out over the road network. We
evaluate how reducing the number of active WiFi
hotspots increases the amount of data uploaded using
mobile connections.
Table 4 indicates the effect of changing the num-
ber of WiFi hotspots on the total mobile and WiFi up-
loads in Roid.
The interesting result is that with just 30% of the
access points, we offload more than 50% or the case
with all 2500 access points.
Another important point is the variability of our
results regarding on different simulation runs. For
the Monaco scenario, variance of results decreases
VEHITS 2020 - 6th International Conference on Vehicle Technology and Intelligent Transport Systems
564

Table 4: Roid performance with decreasing number of WiFi
hotspots.
% active WiFi
hotspots
Increase Mobile
Upload
Increase WiFi Up-
load
100 1x 1x
70 1.09x 0.90x
50 1.21x 0.76x
30 1.37x 0.53x
0 1.78x 0x
strongly when number of vehicles increases, down to
1.9% for 1000 vehicles (Khan, 2019). The reason for
the low variance is the random distribution of vehi-
cles. Randomness is be integrated in the simulation
in a number of ways:
• Randomize vehicle departure times in fixed
routes.
• Randomize the driving behavior of vehicles.
• Randomize the routes of vehicles.
4 RELATED WORK
Overall, we could not find any specific, comparable
work. A main difference is that we assume a cen-
tral coordination server, which we consider realistic
as vehicles upload traffic data anyway, typically for
congestion analysis. In the following, we compare to
similar approaches.
The idea of Dynamic Interrogative Data Capture
(DIDC) is to identify the smallest data collection and
transmission rates to provide information requested
by the transportation authority on different traffic sit-
uations (Wunderlich, 2017). The problem with this
approach is that there may be conflicting requests and
the task of prioritization and sorting of the requests is
not trivial (Lin et al., 2018).
Regarding WiFi offloading, (Lee et al., 2010)
shows that a significant amount of mobile data can be
offloaded for pedestrians using smartphones. Here,
we analyze the offloading behavior in vehicles that
cover distances much faster than pedestrians and
show similar results for this aspect.
For WiFi traffic other works show that congestion
and transfer latency usually result from poor alloca-
tion of WiFi resources (Hossain et al., 2010). Other
approaches like (Sikdar, 2008), Cabernet (Eriks-
son et al., 2008), Drive-Through Internet (Ott and
Kutscher, ) and Shared Wireless Infostation Model
(SWIM) (Small and Haas, 2003) consider fairness
among users. The above works could complement
our findings here, but do not consider the offloading
as such in realistic scenarios.
The general idea of selective data upload has also
been investigated in sensor networks. Data selection
techniques, also known as suppression-based tech-
niques, have been proven useful and accurate in mon-
itoring physical phenomena while significantly reduc-
ing the amount of transferred data (Kulik et al., 2008;
Puggioni and Gelfand, 2009; Silberstein et al., 2006).
The most basic method is temporal suppression where
connected vehicle data is only transmitted when the
data is different from what the vehicle and the central
server expect. The main difference is that in our case,
the mobile vehicles continuously transmit metadata to
a central server which coordinates the data collection.
5 SUMMARY
We have presented a new approach, Roid, for reduc-
ing redundant data from connected vehicles uploads,
using a central control architecture for one specific
road network. We assume that this can be scaled by
using several such servers for multiple regions. As
vehicles increasingly use connected services like nav-
igation and traffic warnings, it is reasonable to assume
that there is a continuous connection for metadata up-
load. The mechanism reduces redundancy based on
locality of pictures, plus WiFi offloading and priori-
ties to model different services.
We analyze the benefits of different factors like
WiFi upload, as well as the scalability to up to
100.000 vehicles. We show that the benefits range
from factor 10 up to factor 20, and clearly show that
more traffic can improve the benefits. The factor
could also be higher if the available network resources
would be higher, so the simple approach would up-
load even more. We also show that longer waiting
times for WiFi hotspots does not give major improve-
ments in our simulations. On the other hand, we can
show that half of the WiFi upload can be achieved
with just 30% of the access points. Effect of data of-
floading to WiFi with some wait - analyzed waiting
time and density of WiFi access points.
REFERENCES
Codeca, L. and Harri, J. (2017). Towards multimodal mo-
bility simulation of c-ITS: The monaco SUMO traffic
scenario. In 2017 IEEE Vehicular Networking Con-
ference (VNC). IEEE.
Eriksson, J., Balakrishnan, H., and Madden, S. (2008).
Cabernet. In Proceedings of the 14th ACM interna-
tional conference on Mobile computing and network-
ing - MobiCom 08. ACM Press.
Efficient and Selective Upload of Data from Connected Vehicles
565

Fogg, I. (2018). The state of wifi vs mobile network expe-
rience as 5g arrives.
Hossain, E., Chow, G., C.M.Leung, V., D.McLeod, R.,
Mivsic, J., W.S.Wong, V., and Yang, O. (2010). Vehic-
ular telematics over heterogeneous wireless networks:
A survey. Computer Communications, 33(7):775–
793.
Khan, Z. (2019). Efficient data collection from con-
nected vehicles. Master Thesis, Technische Univer-
sit
¨
at M
¨
unchen, Germany.
Kulik, L., Tanin, E., and Umer, M. (2008). Efficient data
collection and selective queries in sensor networks.
In GeoSensor Networks, pages 25–44. Springer Berlin
Heidelberg.
Lee, K., Rhee, I., Lee, J., Chong, S., and Yi, Y. (2010).
Mobile data off-loading: How much can wifi deliver?
ACM CoNEXT 2010.
Lin, L., Peeta, S., and Wang, J. (2018). Efficient collec-
tion of connected vehicle data based on compressive
sensing. 21st International Conference on Intelligent
Transportation Systems (ITSC).
Lopez, P. A., Behrisch, M., Bieker-Walz, L., Erdmann, J.,
Flotterod, Y.-P., Hilbrich, R., Lucken, L., Rummel,
J., Wagner, P., and WieBner, E. (2018). Microscopic
traffic simulation using SUMO. In 2018 21st Interna-
tional Conference on Intelligent Transportation Sys-
tems (ITSC). IEEE.
Moustafa, H., Schooler, E. M., and McCarthy, J. (2017).
Reverse cdn in fog computing: The lifecycle of video
data in connected and autonomous vehicles. 2017
IEEE Fog World Congress (FWC).
Ott, J. and Kutscher, D. Drive-thru internet: IEEE 802.1
1b for ”automobile” users. In IEEE INFOCOM 2004.
IEEE.
Puggioni, G. and Gelfand, A. E. (2009). Analyzing
space-time sensor network data under suppression and
failure in transmission. Statistics and Computing,
20(4):409–419.
Saroiu, S., Gummadi, K. P., Dunn, R. J., Gribble, S. D., and
Levy, H. M. (2002). An analysis of internet content
delivery systems. ACM SIGOPS Operating Systems
Review, 36(SI):315–327.
Sikdar, B. (2008). Design and analysis of a MAC proto-
col for vehicle to roadside networks. In 2008 IEEE
Wireless Communications and Networking Confer-
ence. IEEE.
Silberstein, A., Braynard, R., and Yang, J. (2006). Con-
straint chaining. In Proceedings of the 2006 ACM
SIGMOD international conference on Management of
data - SIGMOD 06. ACM Press.
Small, T. and Haas, Z. J. (2003). The shared wireless info-
station model. In Proceedings of the 4th ACM inter-
national symposium on Mobile ad hoc networking &
computing - MobiHoc 03. ACM Press.
Wunderlich, K. (2017). Dynamic interrogative data capture
(didc). Concept of Operations — National Operations
Center of Excellence.
VEHITS 2020 - 6th International Conference on Vehicle Technology and Intelligent Transport Systems
566
