
Automatic Detection of Gait Asymmetry
Maciej Cwierlikowski and Mercedes Torres Torres
School of Computer Science, University of Nottingham, Nottingham, U.K.
Keywords:
Machine Learning, Biomechanics, Gait Symmetry Assessment, Gait Classification.
Abstract:
Gait analysis, and gait symmetry assessment in particular, are commonly adopted in clinical settings to deter-
mine sensorimotor fitness reflecting body’s ability to integrate multi-sensory stimuli, and use this information
to induce ongoing motor commands. Inter-limb deviation can serve as a non-invasive marker of gait function
to identify health conditions and monitor the effects of rehabilitation regimen. This paper examines the perfor-
mance of machine learning methods (decision trees, k-NN, SVMs, ANNs) to learn and predict gait symmetry
from kinetic and kinematic data of 42 participants walking across a range of speeds on treadmill. Classifica-
tion was conducted for each speed independently with several feature extraction techniques applied. Subjects
elicited gait asymmetry, yet ground reaction forces were more discriminative than joint angles. Walking speed
affected gait symmetry with larger discrepancies registered at slower speeds; the highest F1 scores were noted
at the slowest condition (decision trees: 87.35%, k-NN: 91.46%, SVMs: 88.88%, ANNs: 87.22%). None of
the existing research has yet addressed ML-assisted assessment of gait symmetry across a range of walking
speeds using both, kinetic and kinematic information. The proposed methodology was sufficiently sensitive to
discern subtle deviations in healthy subjects, hence could facilitate an early diagnosis when anomalies in gait
patterns emerge.
1 INTRODUCTION
Gait is scientifically recognised as a highly coordi-
nated cooperation between the central nervous and
musculoskeletal systems. Its classification has the po-
tential to provide an insight into patient’s quality of
life, predict cognitive decline (Verghese et al., 2007)
and estimate fall risk (Beauchet et al., 2009). Healthy
gait can be viewed as a recurring and rhythmic pro-
cess of translating the centre of mass (COM) through
space whilst keeping the energy expenditure at min-
imum implying optimal path of the COM motion
(Zhang et al., 2010). Conversely, pathological gait
can be conceptualised as an attempt to maintain body
economy by introducing compensatory exaggerations
of movements at unaffected levels (Inman and Eber-
hart, 1953) which may be manifested by deviations in
gait patterns that are indicative for health problems of
various origins including neurological (e.g. Parkin-
son, multiple sclerosis, post-stroke hemiplegic gait)
and systemic (e.g. cardiopathies, osteoporosis) dis-
eases (Muro et al., 2014).
Gait (a)symmetry, defined as a measure of the par-
allels of lower extremities with respect to a selected
gait parameter (Viteckova et al., 2018), is one of the
markers argued as capable of capturing these devia-
tions thereby reflecting the (dis)order within/between
systems controlling the human locomotion. Up to
date, gait symmetry assessment relied predominantly
on algebraic formulas e.g. symmetry index (Robinson
et al., 1987), expressing bilateral difference of spatio-
temporal (e.g. stride length), kinetic (e.g. ground re-
action forces (GRF)) or kinematic (e.g. joint angles)
variables. However, it has been proven that these tra-
ditional approaches have limitations related to the de-
gree of reported detail due to its discrete nature and
that they are insufficient to capture complex discrim-
inative information contained in patterns over a com-
plete gait cycle (Kutilek et al., 2014).
In this paper, we present, to our knowledge, the
first machine learning-assisted gait asymmetry as-
sessment carried out across a range of speeds. Our
study includes a population of 42 healthy subjects.
Four traditional classifiers were trained to discrim-
inate between left/right gait patterns based on the
lower-limb kinematics or kinetics. Results showed
that gait asymmetry was discernible although its mag-
nitude varied as a function of the walking speed with
larger asymmetries occurring at slower speeds for
which classification performance was superior.
Cwierlikowski, M. and Torres, M.
Automatic Detection of Gait Asymmetry.
DOI: 10.5220/0009787501690176
In Proceedings of the 9th International Conference on Data Science, Technology and Applications (DATA 2020), pages 169-176
ISBN: 978-989-758-440-4
Copyright
c
2020 by SCITEPRESS – Science and Technology Publications, Lda. All rights reserved
169

2 RELATED WORK
Scarcity of quantitative tools to diagnose motor symp-
toms popularised automated movement classification
which already enriched medical practice and selected
studies are presented in section 2.1. However, only
few attempts (section 2.2) specifically targeted gait
asymmetry detection by means of ML techniques.
2.1 Diagnosis of Gait Disorders using
Machine Learning
Several studies have explored machine learning for
gait disorder prediction. Mezghani et al. (2016) used
classification and regression tree algorithm to im-
prove objectivity of joint replacement surgery recom-
mendation for osteoarthritis (OA) patients. 3D knee
angles time-series of each patient with a moderate-to-
severe knee OA were used to predict surgical recom-
mendation. Results showed high ability of the model
to differentiate between surgical and non-surgical
candidates as expressed by sensitivity (79.5%), speci-
ficity (90%), accuracy (84.7%) and ROC curve
(0.8477) metrics. However, authors did not report
whether any hyperparameter tuning was performed.
In fact, by optimising model’s structure, potential
gains in performance might be medically meaningful.
Salazar et al. (2004) addressed the limitations of a
manual classification of the Spastic Hemiplegia (SH)
varieties. Joint angles of the hemiparetic limb were
used to train 7 binary SVM models and one-against-
all scheme was adopted to account for 7 different
classes (6 SH types + 1 healthy). The specificity met-
ric ranged between 84.61% and 98.69% yet the study
lacked a systematic testing to prevent the overfitting.
Alam et al. (2017) extracted 13 statistical features
from vertical ground reaction force (VGRF) and cen-
tre of pressure time-series of 29 Parkinson’s disease
(PD) sufferers and 18 age-matched healthy subjects
and trained several ML models to diagnose Parkin-
sonian gait. Gait of patients afflicted by a Parkinson’s
disease was identified with an accuracy of 85.1%, and
91.6% obtained by k-nn and SVMs with a linear ker-
nel, respectively. However, considering complexity
of human gait, other dimensions of the force vector or
alternative movement descriptions e.g. joint angles,
may contain diagnostically meaningful information.
2.2 Machine Learning-based Detection
of Gait Asymmetry
Most gait symmetry research aims to (1) determine
the magnitude and locations of asymmetries in gait-
impaired subjects as well as (2) investigate if healthy
population exhibits inter-leg differences. In diag-
nosed locomotor dysfunctions, gait asymmetry reduc-
tion is used as a tool attesting to the appropriateness
of rehabilitation regimen (Lewek et al., 2014). The
literature regarding gait asymmetry in able bodied in-
dividuals is equivocal as no significant differences in
ground reaction forces (Hamill et al., 1984) or joint
angles (Hannah et al., 1984), are confronted by con-
trary findings (Vaughan et al., 1992). The inherent
asymmetry of healthy gait is becoming increasingly
evidenced (Sadeghi et al., 2000); although, its cause
is unknown, methods detecting minor deviations in
normal gait should emerge.
2.2.1 Naturally Occurring Gait Asymmetry
Wu and Wu (2015) used SVMs to assess gait sym-
metry. Researchers gathered 10 trials from left and
right legs of 60 elderly individuals. First, the rela-
tive variability of collected parameters (3 peak forces
and corresponding times) was obtained for each leg
by calculating the Coefficient of Variation (CV ≤
12.5%), followed by Absolute Symmetry Index (ASI
≤ 10%), and t-test with a null hypothesis indicat-
ing gait symmetry. The t-test demonstrated signifi-
cant differences (p ≤ 0.05%. ) for 3 out of 6 pa-
rameters. Despite managing to report explicit inter-
limb asymmetries, SI proved inadequate in revealing
more complex relationships. To confront the standard
method a SVM model was developed. The collec-
tive input (120 samples) containing gait variables for
both legs undergone a 6-fold cross-validation result-
ing in the creation of corresponding subsets. Fea-
ture inputs sets comprised of 101 data points vector
of a normalised gait waveform, PCA extracted com-
ponents and 6 aforementioned gait variables with 3
kernel functions (i.e. polynomial, radial basis (RBF)
and linear applied to each). SVM was superior to
SI in determining subtle asymmetries in gait. More-
over, polynomial and RBF outperformed the linear
kernel most significantly when carried out on PCA-
based input features. For this configuration (kernel:
Polynomial/RBF, input: PCA-derived), external met-
rics reported were highest with accuracy, sensitivity
and specificity of 90%, 88-90%, 80%, respectively.
PCA minimised potential redundancies of the origi-
nal 101 dimensions vector, thus boosting classifica-
tion performance; and provided more gait symmetry
information compared to the discretised set of 6 gait
attributes. The findings can be criticised as the ran-
dom division of the gait pattern pool spread subject-
specific data across training and testing subsets, hence
the results were affected by the information leakage
(Halilaj et al., 2018).
DATA 2020 - 9th International Conference on Data Science, Technology and Applications
170

2.2.2 Artificially Induced Gait Asymmetry
Schlafly et al. (2019) aimed to determine the impor-
tance of feature selection for classifications of poten-
tially overlapping gait pathologies. Artificially in-
duced locomotion asymmetries interspersed normal
walking trials of 20 healthy subjects. The 10 pertur-
bations resulted from a combinations of shoe heights
(2.7/5.2 cm) and ankle weights (2.3/4.6 kg), and were
grouped into 3 leg length categories (none, small,
large) and 5 distal mass classes: large/small ankle
weights attached to either leg (4 conditions) or a no-
added weight condition (1). The recordings (max.
20 steps for both limbs) provided 21 discrete vari-
ables/step which encapsulated three feature modal-
ities (2 spatio-temporal, 12 kinematic, 7 kinetic).
SVMs, k-NN, and ANNs were trained on all trials be-
longing to 16/20 subjects whereas the data of the 4
remaining participants was used to evaluate the per-
formance of each classifier. For each experimen-
tal condition, classification with a PCA-transformed
features was repeated 100 times equating to 4000
tested instances. Subsequently, the results derived
from all 21 features were contrasted with those gen-
erated by possible combinations of 3-element feature
subsets. Overall, SVMs (Gaussian and polynomial
kernels) outperformed other models across all condi-
tions. Lower leg lengths were best classified by all
21 features (72.9%); the combination of the 3 fea-
ture modalities (64.8%) was more accurate than ki-
netic (61.1%), kinematic (55.9%) and spatio-temporal
(32.9%) results separately. The distal mass was ex-
amined most accurately by kinetic (68%) parame-
ters alone. This outperformed the collective 21 at-
tributes (66.3%), the best performing subset (66.9%)
and other feature modalities (kinematic (43%) and
and spatio-temporal (43.7%)).
Authors emphasised that the most discriminative
variables may be directly dictated by the underlying
cause of the gait impairment. Nonetheless, the study
did not include speed variations which is an important
factor that may influence gait dynamics and amplify
or nullify inter-limb deviations (Fukuchi et al., 2019).
3 DATASET
The dataset used in this paper containing gait ki-
netics and kinematics of 42 healthy subjects walk-
ing at a range of speeds was developed by Fukuchi
et al. (2018). For each signal, authors specified the
body side recorded, thereby providing a class label
(left/right) for a gait pattern classification.
• Kinetics. Force precedes and causes motion and
the branch of Newtonian mechanics that explores
these vector quantities is known as kinetics. Con-
tact forces must be measured and the measure-
ment relies on Newton’s Third Law of Motion.
Specifically, by applying the force to the ground
(force platform) at each step, the ground (load
cells) reacts by exerting the ground reaction force
that acts on the body with the same magnitude but
opposite in direction. The raw kinetics comprised
of numerous GRFs traces generated at each step
over the final 30 s treadmill-based conditions and
while walking across five force platforms during
the overground trials.
• Kinematics. On the other hand, kinematics is the
study of motion without regard to causes. The un-
processed kinematics contained 3-D trajectories
of each marker that was affixed to a distinct body
landmark and these were are used to obtain po-
sitions of anatomical segments allowing relevant
variables e.g. joint angles to be computed. As a
result, 3-D joint angles for the hip, knee and ankle
segments were obtained.
Each of the 11 experimental conditions were ex-
pressed as a percentage of the pre-determined com-
fortable speed and reflected treadmill (T01 to T08) or
overground (OS, OC, OF) trials. However, to eluci-
date the main trends of speed’s effect on gait asym-
metry, only the results for the three boundary speeds
i.e. slow: T01 (40%), self-selected: T05 (100%) and
fast: T08 (145%) on treadmill are reported.
3.1 Data Processing
To present an overall trend of a signal across mul-
tiple trials (or cycles as in gait) for a given individ-
ual thereby discarding within-subject variance, an en-
semble average was obtained. All ipsilateral gait pat-
terns recorded during a given speed condition were
extracted and linearly interpolated to a 101-point se-
ries. Then, values at each time-point across all derived
gait cycles were averaged yielding three representa-
tive signals (XYZ GRF or joint angle) for each limb
per speed condition/subject.
3.2 Analysis
Initial data exploratory attempts led to a hypothesis
that, in the context of the present dataset, gait sym-
metry might vary as a function of the walking speed.
Also, it can be argued that kinetics might be more
discriminative with respect to limb classification than
kinematics, and that walking speed is a potentially im-
portant factor that should be controlled.
Automatic Detection of Gait Asymmetry
171
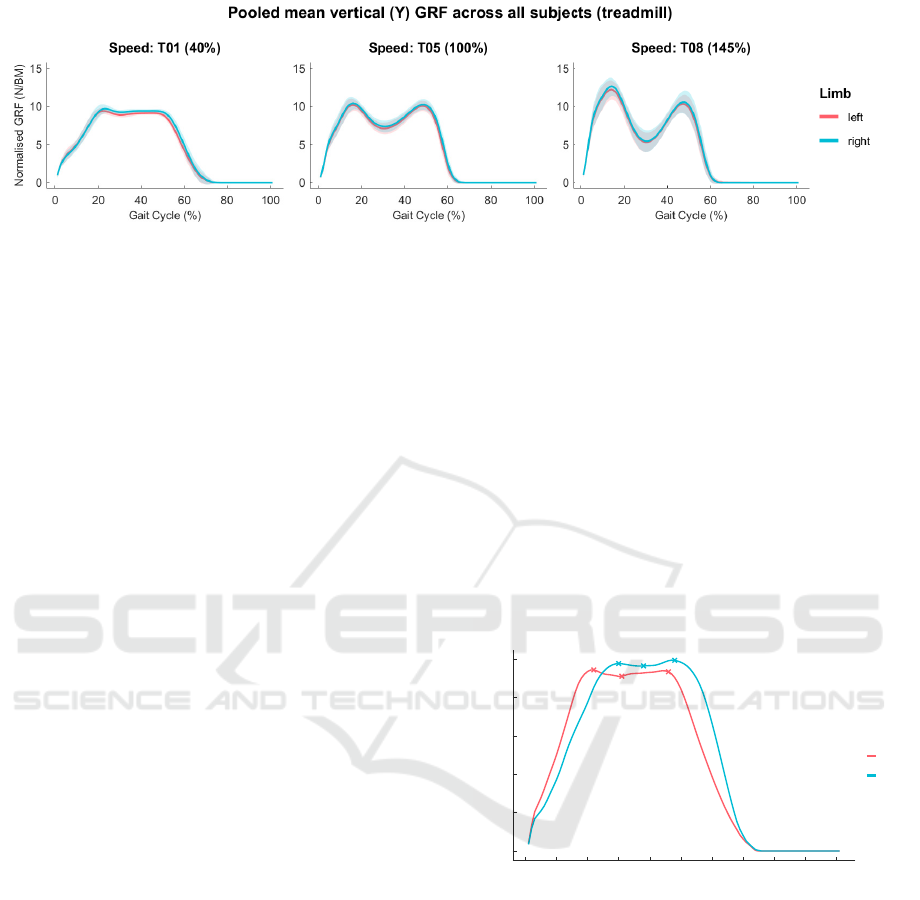
Figure 1: The shaded area represents the standard deviations across all subjects.
3.2.1 Pooled Analysis of Between-limb
Differences
All overground and most distinct treadmill conditions
(slow, comfortable, fast) of the entire population were
ensemble-averaged into 3-D signals (i.e. ground reac-
tion forces, joint angles) for both limbs, and colour-
coded according to body side. Overall, an inter-limb
similarity was present across the subject pool. In
treadmill trials (see Figure 1), vertical GRF was least
symmetrical at the slowest (T01, 40%) speed (the
red curve protrusion spanned approx. 20-60% of the
gait cycle) yet much more similar at faster conditions
(T05, 100% and T08, 145%). For the overground
walking, curves largely overlapped across all speeds
and the same merely discernible trends characterised
kinematics regardless of speed and walking environ-
ment, hence their visualisations were omitted.
3.2.2 Principal Component Analysis
PCA was applied to standardised kinetic and kine-
matic time-series. Biplots of the first two PCs showed
discernible clusters of left/right kinetic gait patterns
for the treadmill walking at slow (T01) and comfort-
able (T05) speeds. No clear groupings emerged for
the fastest treadmill (T08) and overground (b) condi-
tions. PCA-reduced kinematic waveforms provided
lesser insight into gait asymmetry, regardless of the
walking environment.
3.3 Feature Extraction
Classification results obtained by using the high-
dimensional gait waveforms were contrasted with its
discretised and reduced (PCA) representations. Each
feature vector was standardised and this was carried
out on each training and test folds during CV cycle.
Mean and variance computed for the training parti-
tion were used to obtain z-scores for the test split.
3.3.1 Baseline Discrete Gait Parameters
Nine parameters corresponding to forces at three dis-
crete instants (see Figure 2) as well as their respec-
tive chronological times of occurrence expressed as a
percentage of the gait cycle were extracted from the
vertical GRF. First and second peaks denote weight
acceptance at heel-strike impact push-off preceding
toe-off, respectively whilst the minimum in-between
refers to the maximum knee flexion prior to forward
propulsion; these points are considered as representa-
tive characteristics reflecting an overall quality of gait
(Chao et al., 1983), thus were used as a feature vector
for classification.
0 10 20 30 40 50 60 70 80 90 100
Gait Cycle (%)
0
2
4
6
8
10
Normalised Vertical GRF (N/BM)
Vertical GRF (Y)
Limb
left
right
Figure 2: Discrete features extracted from the vertical GRF.
3.3.2 Complete Waveforms
For the kinetics data, all three components (Y - ver-
tical, X - anterior-posterior, Z - medial-lateral) of
the GRF were horizontally concatenated yielding the
2x303 matrix for each subject (2 - left and right limb,
303 - combined GRFs). Given three planes of motion
(XYZ) and three joints (hip, knee, ankle), kinematic
feature matrix was much larger (2x909).
DATA 2020 - 9th International Conference on Data Science, Technology and Applications
172
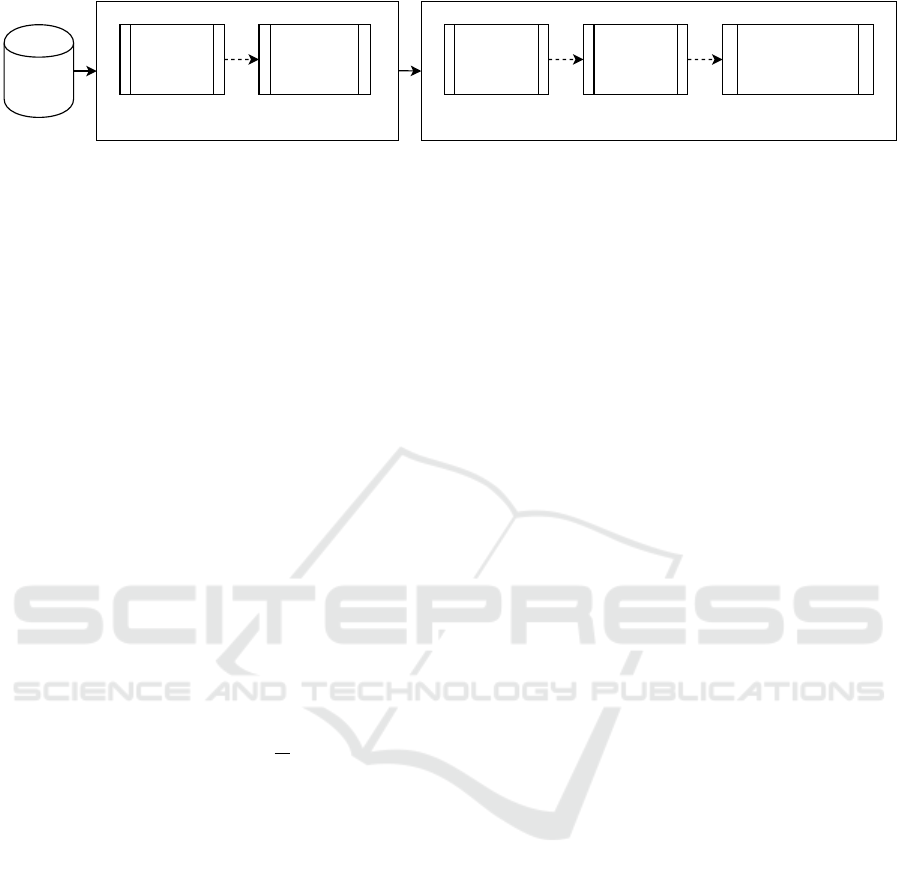
Dataset
Data
Pre-
Processing
Feature
Extraction
Data Preparation Model Development
3-Fold
Cross-
Validation
Machine
Learning
Algorithm
Hyperparameter
Optimisation
Figure 3: Classification Pipeline.
3.3.3 PCA-processed Gait Patterns
PCA was applied to the complete kinetic/kinematic
time-series. Number of principal components used as
an input varied at each CV cycle, and these were pro-
grammatically added until at least 90% of the variance
was explained.
4 AUTOMATIC GAIT
ASYMMETRY DETECTION
The methodology workflow is shown in Figure 3.
4.1 Decision Trees
Decision trees were trained by recursive binary strat-
ification of the predictor space X (root) into a set
of hyper-rectangular regions (inferior nodes) with the
goal to find clearer class separation according to the
Information Gain as per equation 1:
∆I(N, A
t
) = I(N) −
k
∑
i=1
S
i
N
· I(S
i
) (1)
where:
• N ⊆ T ← training set (if a root node) or a subset
thereof (if an inferior node)
• A
t
← logical test that divides N, yielding k candi-
date child nodes S
i
, S, ..., S
k
• I ← an arbitrary measure of impurity (e.g. Gini
Index, Entropy)
Recursive grow continued until either a subset
contained only homogenous samples or there was no
further benefit of segmentation in terms of purity. To
optimise the tree, two hyperparameters: 1) minimum
leaf size (1-25) and 2) splitting criterion (Gini Diver-
sity Index, Entropy) were varied.
4.2 k-Nearest Neighbours (k-NN)
k-nearest neighbours uses a proximity measure to
gather the most frequent label of k closest instances in
a local neighbourhood of the unseen record and clas-
sifies it accordingly (Hastie et al., 2013).
Two hyperparameters: 1) k-neighbours (1-20) and
2) distance metric (Euclidean, Manhattan) were var-
ied to optimise the model.
4.3 Support Vector Machines (SVM)
SVM is a hyperplane-based discriminator which ad-
dressed limitations of previous approaches such as a
linear separability constraint imposed by the maximal
margin classifier and consolidated the concept of soft
margin introduced in the support vector classifier.
Classification was tested with a linear kernel, an
RBF kernel, and a polynomial kernel.
4.4 Artificial Neural Netoworks (ANN)
Artificial Neural Networks are non-linear black-box
models and proven to be capable of approximating
any function given that the optimised architecture has
been established (Velten, 2009).
Single-hidden layer feedforward network with a
sigmoid activation function was fitted and trained for
1000 epochs. The number of hidden neurons was var-
ied (1-30) to optimise the network.
5 EXPERIMENTAL SETUP
All the data for a given subject (i.e. two gait patterns)
were placed within either training or a test subset.
Thus, 3-fold cross-validation was carried out divid-
ing 42 subjects into three groups so that at each itera-
tion the model was fitted on a training data comprising
56 gait patterns of 28 subjects (66.6%) and evaluated
on the 28 gait patterns belonging to 14 left out cases
(33.3%).
Automatic Detection of Gait Asymmetry
173

5.1 Evaluation Metrics
To enable comparison between speed conditions and
experimental scenarios, F1 score denoting a weighted
average of precision and recall was chosen to assess
the performance of each of the classifiers:
Precision =
T P
T P + FP
(2)
Recall =
T P
T P + FN
(3)
F1 = 2 ∗
Precision ∗ Recall
Precision + Recall
(4)
where:
• TP: cases correctly classified as a left limb
• TN: cases correctly identified as a right limb
• FP: cases falsely classified as left
• FN: cases falsely classified as right
6 RESULTS
6.1 Kinetics
The results outlined in Tables 1-3 show that on aggre-
gate level (column-wise mean), classification perfor-
mance dropped as the walking speed increased with
the highest average F1 score (86.71%) achieved using
discrete kinetic parameters as the feature vector and
this inverse correlation between speed condition and
F1 score was also noted across majority of models and
feature extraction methods.
At the individual model level (row-wise mean),
on average across all speeds ANNs trained on com-
plete kinetic waveforms outperformed other algo-
rithms (83.59%) yet k-NN was superior in identifying
correctly left/right gait patterns at the slowest (T01)
speed condition (91.46%).
Table 1: F1 scores - discrete kinetic parameters.
T01 T05 T08 Mean SD
DT 84.28% 55.72% 62.63% 67.54% 14.90%
k-NN 91.46% 72.08% 66.83% 76.79% 12.97%
SVM 83.88% 79.07% 63.13% 75.36% 10.86%
ANN 87.22% 74.83% 65.65% 75.90% 10.82%
Mean 86.71% 70.42% 64.56% 73.90% 5.24%
SD 3.50% 10.22% 2.01% 5.24% 4.37%
Table 2: F1 scores - complete kinetic waveforms.
T01 T05 T08 Mean SD
DT 87.35% 64.21% 69.46% 73.67% 12.13%
k-NN 84.77% 77.14% 68.89% 76.93% 7.94%
SVM 81.76% 75.08% 71.39% 76.08% 5.26%
ANN 82.46% 90.03% 78.29% 83.59% 5.95%
Mean 84.08% 76.61% 72.01% 77.57% 6.09%
SD 2.53% 10.59% 4.32% 5.81% 4.23%
Table 3: F1 scores - PCA-reduced kinetic waveforms.
T01 T05 T08 Mean SD
DT 76.37% 76.80% 69.22% 74.13% 4.26%
k-NN 82.46% 76.70% 69.94% 76.37% 6.27%
SVM 88.88% 80.08% 68.39% 79.12% 10.28%
ANN 86.32% 77.08% 78.26% 80.55% 5.03%
Mean 83.51% 77.66% 71.45% 77.54% 6.03%
SD 5.44% 1.62% 4.58% 3.88% 2.00%
6.2 Kinematics
As shown in Tables 4-5, in contrary to kinetics-driven
classification models’ performance for this modality
was not inversely correlated with the walking speed.
Surprisingly, the highest F1 score (70.77%) was
yielded by k-NN at the fastest condition (T08) yet on
average across all speeds it ranged between 65.33-
68.23%. Hence, joint angles were significantly less
discriminative than VGRFs.
Table 4: F1 scores - complete kinematic waveforms.
T01 T05 T08 Mean SD
DT 64.93% 64.89% 68.73% 66.18% 2.21%
k-NN 66.46% 66.07% 66.91% 66.48% 0.42%
SVM 66.67% 66.67% 67.36% 66.90% 0.40%
ANN 64.59% 63.70% 63.82% 64.04% 0.48%
Mean 65.66% 65.33% 66.70% 65.90% 0.72%
SD 1.05% 1.32% 2.07% 1.48% % 0.53
Table 5: F1 scores - PCA-reduced kinematic waveforms.
T01 T05 T08 Mean SD
DT 65.87% 66.70% 65.50% 66.02% 0.61%
k-NN 68.69% 68.34% 70.77% 69.27% 1.31%
SVM 65.76% 66.51% 67.91% 66.73% 1.09%
ANN 66.83% 67.66% 68.75% 67.75% 0.96%
Mean 66.79% 67.30% 68.23% 67.44% 0.73%
SD 1.36% 0.86% 2.18% 1.47% 0.67%
7 DISCUSSION
Human locomotion is elicited through a collaboration
of various systems and it is assumed that gait sym-
DATA 2020 - 9th International Conference on Data Science, Technology and Applications
174

metry can be viewed as the degree of order/disorder
or control of this interplay (Viteckova et al., 2018).
To assess inter-limb differences, gait pattern classifi-
cation was carried out based on kinetic and kinematic
data derived from treadmill and overground walking
at a range of speeds using different ML algorithms
and feature extraction approaches.
Gait asymmetry in healthy subjects was identified
and generally high classification accuracy was noted
for all models, however, k-NN and ANNs on average
outperformed SVMs and decision trees. By examin-
ing F1 maxima from the kinetic-based classification,
it can be argued that gait asymmetry gradually dissi-
pated as the walking speed increased. This resonates
with the dynamical systems theory and motor con-
trol research proposing a plausible explanation of an
enhanced movement coordination at faster velocities
of execution. According to these domains, limbs can
be modelled as coupled oscillators that are more eas-
ily controlled at higher movement frequencies whilst
when afforded to decouple at slower speeds, limbs
might employ distinct functional strategies leading to
the hypothesis of a non-dominant/dominant roles of
lower extremities (Gobble et al., 2003).
Another observation was a noticeable drop in clas-
sification performance when models relied on kine-
matic as opposed to kinetic data. This can be inter-
preted within the context of the study conducted by
Schlafly et al. (2019) in which a spectrum of artifi-
cially induced gait asymmetries was investigated. It
was concluded that the discriminatory power of fea-
tures of various modalities and combinations thereof
may depend on a particular type of gait asymmetry
being examined. Authors demonstrated that features
extracted from the force plate data (kinetic) exclu-
sively, best classified gait asymmetries caused by dis-
tally affixed mass to either limb. Conversely, when
a limb length and not the mass was manipulated, the
best result was obtained by incorporating both, kinet-
ics and kinematics. Thus, considering the fact that
forces provide an insight into the musculoskeletal dy-
namics that generate the movement and that these
were found to be more effective in differentiating be-
tween left/right gait patterns, it is then possible that
inter-limb differences present in healthy individuals
are manifested in kinetic inequalities.
When applied to the kinetic waveform, PCA had
a varied influence on the classification performance.
For example, SVM and ANN benefited from the di-
mensionality reduction for the slowest walking speed.
On the other hand, it had a negative or no effect on
the k-NN’s and DT’s results overall. As to the hyper-
parameters tested, both distance metrics examined in
k-NN produced similar results whereas the value of k
for the best F1 scores noted ranged predominantly be-
tween 8-14. This parameter is highly dataset-specific,
however, usually profoundly small values magnify the
effects of outliers whilst increasingly larger settings
yield smoother decision boundaries thereby introduc-
ing bias. In terms of SVMs, its performance was
superior when the linear kernel was adopted whilst
the least favourable results were observed for the rbf
kernel. It is possible that non-linear kernels did not
improve classifications performance due to already
large dimensionality of the data (Ben-Hur and We-
ston, 2010). To find the best decision tree, minimum
number of instances per leaf (MLS) and split crite-
rion (SC) were varied. The MLS imposes a rule on
how many instances in a given node are required to
justify the split, thereby providing a mean to control
a tree depth. In general, the best gait pattern classi-
fication accuracy was obtained when MLS was kept
either very low (1-4) or just above/below ten (7-13).
With regard to the branching criterion, trends gener-
ated by varying MLS were also remarkably congruent
between the Gini Diversity Index and Entropy. Fi-
nally, potentially due to a small sample size as for
ANNs, the number of hidden neurons did not have
a visible effect on classification performance.
8 CONCLUSION
Machine learning and gait analysis co-occur more fre-
quently in the literature than ever before. This study
used an alternative approach to quantify gait asym-
metry in which its assessment was considered as a bi-
nary classification problem where a given gait pattern
was assigned to one of the two available categories
namely, left or right limb. Consequently, F1 score
was computed and regarded as a quantitative mea-
sure of gait symmetry with low and high values denot-
ing symmetrical and asymmetrical gaits, respectively.
Future research should also examine ensemble meth-
ods and other cross-validation approaches. Addition-
ally, the role of laterality should be addressed but this
would require a dataset comprising a balanced num-
ber of right- and left- footed subjects. Also, provided
that sufficiently large dataset becomes available, so-
phisticated techniques e.g LSTM coupled with ad-
vanced methods to extract discriminative information
from signals such as time-frequency spectral analysis
via the wavelet transform could boost classification
performance.
Automatic Detection of Gait Asymmetry
175

REFERENCES
Alam, M. N., Garg, A., Munia, T. T. K., Fazel-Rezai, R.,
and Tavakolian, K. (2017). Vertical ground reaction
force marker for parkinson’s disease. PLOS One,
12(5):p.e0175951.
Beauchet, O., Annweiler, C., Dubost, V., and Allali, G.
(2009). Stops walking when talking: A predictor of
falls in older adults? European Journal of Neurology,
16(7):786–795.
Ben-Hur, A. and Weston, J. (2010). A user’s guide to sup-
port vector machines. In Carugo, O. and Eisenhaber,
F., editors, Data Mining Techniques for the Life Sci-
ences, pages 223–239. Humana Press.
Chao, Y., Laughman, R., Schneider, E., and Stauffer, R.
(1983). Normative data of knee joint motion and
ground reaction forces in adult level walking. Jour-
nal of Biomechanics, 16(3):219–233.
Fukuchi, C. A., Fukuchi, R. K., and Duarte, M. (2018).
A public dataset of overground and treadmill walking
kinematics and kinetics in healthy individuals. PeerJ,
6:e4640.
Fukuchi, C. A., Fukuchi, R. K., and Duarte, M. (2019). Ef-
fects of walking speed on gait biomechanics in healthy
participants: a systematic review and meta-analysis.
Systematic Reviews, 8(1):153.
Gobble, D. J., Marino, W. G., and Potvin, J. R. (2003). The
influence of horizontal velocity on interlimb symme-
try in normal walking. Human Movement Science,
22(3):271–283.
Halilaj, E., Rajagopal, A., Fiterau, M., Hicks, J. L., Hastie,
T. J., and Delp, S. L. (2018). Machine learning in
human movement biomechanics. Journal of biome-
chanics, 81:1–11.
Hamill, J., Bates, B. T., and M.Knutzen, K. (1984). Ground
reaction force symmetry during walking and run-
ning. Research Quarterly for Exercise and Sport,
55(3):289–293.
Hannah, R., Morrison, J., and Chapman, A. (1984). Kine-
matic symmetry of the lower limbs. Archives of phys-
ical medicine and rehabilitation, 65(4):155–158.
Hastie, T., Tibshirani, R., Witten, D., and James, G. (2013).
An Introduction to Statistical Learning: With Applica-
tions in R. Springer.
Inman, V. and Eberhart, H. (1953). The major determinants
in normal and pathological gait. The Journal of Bone
& Joint Surgery, 35(3):543–558.
Kutilek, P., Viteckova, S., Svoboda, Z., and Socha, V.
(2014). Kinematic quantification of gait asymmetry
based on characteristics of angle-angle diagrams. Acta
Polytechnica Hungarica, 11(5):25–28.
Lewek, M., Bradley, C. E., Wutzke, C., and Zinder, S. M.
(2014). The relationship between spatiotemporal gait
asymmetry and balance in individuals with chronic
stroke. Journal of Applied Biomechanics, 30(1):31–
36.
Mezghani, N., Dunbar, M. J., Ouakrim, Y., and Fuentes, A.
(2016). Biomechanical signal classification of surgi-
cal and non-surgical candidates for knee arthroplasty.
In 2016 International Symposium on Signal, Image,
Video and Communications, pages 287–290.
Muro, A., Zapirain, B. G., and Mendez-Zorrilla, A. (2014).
Gait analysis methods: An overview of wearable and
non-wearable systems, highlighting clinical applica-
tions. Sensors, 14(2):3362–3394.
Robinson, R. H., Herzog, W., and Nigg, B. M. (1987). Use
of force platform variables to quantify the effects of
chiropractic manipulation on gait symmetry. Jour-
nal of Manipulative and Physiological Therapeutics,
10(4):172–176.
Sadeghi, H., Allard, P., Prince, F., and Labelle, H. (2000).
Symmetry and limb dominance in able-bodied gait: a
review. Gait & Posture, 12(1):34–45.
Salazar, A. J., Cuevas, O. C. D. C., and Bravo, R. J. (2004).
Novel approach for spastic hemiplegia classification
through the use of support vector machines. In The
26th Annual International Conference of the IEEE
Engineering in Medicine and Biology Society, pages
466–469.
Schlafly, M., Yilmaz, Y., and Reed, K. B. (2019). Feature
selection in gait classification of leg length and distal
mass. Informatics in Medicine Unlocked, 15:100163.
Vaughan, C. L., Davis, B. L., and O’Connor, J. C. (1992).
Dynamics of human gait. Human Kinetics Publishers.
Velten, K. (2009). Mathematical Modeling and Simulation:
Introduction for Scientists and Engineers. John Wiley
& Sons.
Verghese, J., Wang, C., Lipton, R., and Holtzer, R. (2007).
Quantitative gaitdysfunction and risk of cognitive de-
cline and dementia. Journal of neurology, neuro-
surgery, and psychiatry, 78(9):929–935.
Viteckova, S., Kutilek, P., Svoboda, Z., and Krupicka, R.
(2018). Gait symmetry measures: A review of cur-
rent and prospective methods. Journal of the Indian
Medical Association, 42:89–100.
Wu, J. and Wu, B. (2015). The novel quantitative technique
for assessment of gait symmetry using advanced sta-
tistical learning algorithm. BioMed Research Interna-
tional, 2015(528971).
Zhang, J., Zhang, K., Feng, J., and Small, M. (2010).
Rhythmic dynamics and synchronization via dimen-
sionality reduction: application to human gait. PLOS
Computational Biology, 6(12):p.e1001033.
DATA 2020 - 9th International Conference on Data Science, Technology and Applications
176
