
Environmental Impact Assessment (EIA) of pH and Other Factors on
Organic Photovoltaic Performance Output
Abodunrin Temitope Jolaolu
1
, Emetere Moses Eterigho
1
and Ajayi Oluseyi Olanrewaju
2
1
Department of Physics, Covenant University, P.M.B. 1023, Ota, Nigeria
2
Department of Mechanical Engineering, Covenant University, P.M.B. 1023, Ota, Nigeria
*
corresponding author email address
Keywords: Dye-sensitized Solar Cell, Impact Assessment, Energy, pH.
Abstract: A methodical frame for evaluating the prospective ecological and health impacts of photovoltaics is necessary
to consider both their negative and positive underlying effects. These pros come with a probability to advance
carbon sequestration perspective. The cons are considered with a view to alleviate their negative consequences
or eliminating them altogether. In this work, we report the effect of pH and dye sol ambient temperature on
the environmental impact of three dye-sensitized solar cells, C.papaya, P.dulcis and C.longa to gauge their
environmental impact. In the wake of several generations of photovoltaic trends a precautionary check on
their effectiveness, stability, cost-competitiveness, storage time and ecological friendliness is a way of
isolating carbon for storage and transportation. Thus, although the objective of this project is to investigate
factors which are not tangible, discrete factors that impact photovoltaics will be analyzed using direct
qualitative techniques. Using valued environmental components with spatial boundaries, and software effort
estimation model to investigate the possibility for re-use, compactness and photo-corrosion among others.
The significance of this research is for subsequent moderation in planning, design and to redress newer models
of dye-sensitized solar cells technology for higher photovoltaic efficiency and lessen their photo-corrosive
influence on our ecological system.
1 INTRODUCTION
In the wake of so many hazardous emissions released
per second into the atmosphere from myriad
industrial and economical activities, it is imperative
to carry out a risk assessment on many of our research
efforts. This is in particular so because of the
dimensions of the changes involved; at the moment,
industry, transportation, and domestic uses routinely
discharge almost 10 Giga tons of carbondioxide
yearly to the atmosphere. It is equally notable that
there is no immediate hope for a radical change in the
spate of these emissions (Abdullahi et al., 2018).
Thus, a clarification of carbon sequestration and
carbon ‘sink’ needs to precede many of our lines of
research intervention. A carbon sink accumulates
more and more carbon into the atmosphere or ocean
whereas, a sequestrate serves as a carbon reservoir.
This artificial storage acts as a check for increasing
the atmospheric carbondioxide (Smit et al., 2014).
Real life scenario requires more cyclable carbon
reservoirs as fuel which readily get replenished as
they combust in oxygen to generate energy. In the
present circumstance, such a store should not act as a
trigger for global warming or its associative epidemic
hazardous effects. Consequently, calculation of the
risk involved in installation of any photovoltaic
becomes a standard measure of probability of any
harmful effects, such as its propensity for ‘carbon
sink or store’. The process of trapping and storing
carbondioxide as a means of decreasing its volume in
the atmosphere and mitigating climatic change is
defined as sequestration of carbon (Lal et al., 2013).
Inadvertently, there are natural carbon sequestration
processes but, that due to anthropogenic actions of
man leads to accruement of carbon dioxide in the
atmosphere. This follows up on carbon footprint and
is understandably a rising cause for concern in
climate issues (Park et al., 2011). Photovoltaics use
redox reactions, this by implication suggests innate
balance but, the nature of certain materials used
within their components reveals the contrary. An
illustration of electrolytes used is: leaky, volatile
compounds, corrosive or toxic liquids, this forms the
Jolaolu, A., Eterigho, E. and Olanrewaju, A.
Environmental Impact Assessment (EIA) of pH and Other Factors on Organic Photovoltaic Performance Output.
DOI: 10.5220/0009782501590168
In Proceedings of the 9th International Conference on Smart Cities and Green ICT Systems (SMARTGREENS 2020), pages 159-168
ISBN: 978-989-758-418-3
Copyright
c
2020 by SCITEPRESS – Science and Technology Publications, Lda. All rights reserved
159

epic of our environmental quest (Martelli et al.,
2011). Incorporation of a photoanode usually
involves cataclysmic reactions with concentrated
acid, pungent gases are emitted in the vicinity, this
brings a second perspective on the environment
(Olateju and Kumar, 2013). Preparation of the
counter electrode through masking it with platinum or
other carbon-based compounds is also an obvious
intrusion of carbon into the atmosphere (Botero et al.,
2013). It thus poses a high-level risk if photovoltaics
become a significant source of carbon source sink,
which has informed this research - a prospect of
orchestrating more collective carbon detention and
storing from improved changes in photovoltaic
fabrication and application techniques (Wich et al.,
2020). One of the greatest milestones of this century
is a need to stabilize the greenhouse gas
concentrations of the atmosphere (Müller et al.,
2020). To regulate these gaseous discharges, human
race can either lessen fossil fuel emissions directly or
diagnose instruments to get rid of greenhouse gases
once they are emitted (Heek et al., 2018). In this way,
sequestration of atmospheric carbon dioxide becomes
an appealing option as a substitute to help truncate the
astronomical rate of greenhouse gases and
accompanying changes to climate patterns. A priority
factor for consideration in this ecological theme is
reusability, it is difficult to sustain any technology
without any possibility for reuse (Ani and Basri,
2013). In order to carry out an effective valuation, a
program software will have been used. Although
many algorithms have played dual or more roles in
past researches whether applied individually or
corporately, many more are ongoing to unravel the
scientific facts embedded in present and future
numerical data (Bettinger et al., 2017). A search for
suitable software suited to the demands of this
particular research led to environmental impact
assessment (EIA). This is because, it was initially
written as a software programming tool established to
scale environmental impact of human activities on the
environment (Amundson and Biardeau, 2018).
Consequently, modification of EIA comes to play in
prior assessment of the effect of fabrication of dye-
sensitized solar cell on the environment with a view
of taking better decisions (Broday, 2020). This begins
with prior collection of data on the manufacturing
process, different stages of completion ranging from
scope to completion governed by EIA tool with a
determination to improve on the present by exploring
even safer and better alternatives (Zeleňáková et al.,
2020). Comprehensively, many research works have
focused on the effect of pH, because altering the pH
level in any ecosystem affects all living organisms
(Barandiaran and Rubiano-Galvis, 2019). There are
very few highlights on hazard footprints with specific
mention of vulnerability resulting from concentrated
acid interactions with titanium oxide as a naturally-
induced hazard which is another factor considered for
quantification of the afore-mentioned risk factors
(Wang and Su, 2020). The expected outcome is
higher Quality photovoltaics even with onset of time,
solvent deals in which neither sol gel gets evaporated
nor washed off by degeneracy, cleaner air quality
from cost-effective photovoltaic devices.
2 METHODOLOGY
Stoichiometric quantities of C.papaya, P.dulcis and
C.longa plants were air dried under conditions of
standard air mass in the laboratory. Their dried extract
was mixed in (5mg/5ml) methanol proportion, the pH
and temperature of each sample was recorded before
being affixed onto three separate titanium
frameworks already assembled on the indium doped
(ITO) conducting slides following standard
procedures described in previous researches
(Abodunrin et al., 2019). This procedure describes
the photoanode preparation, the counter electrode
comprised of masking a second pair of ITO with co-
axial deposition of soot over a naked flame, in a
simulated vacuum-like enclave. Each pair of anode
and counter electrode was fastened together with
clips, 5ml syringes were used to insert three drops of
aqueous electrolyte in-between the resultant ITO
sandwich. Excess electrolyte was allowed to tun off
but was noted for subsequent assessment in the
ensuing section. Each pair of ITO were connected in
parallel to a multimeter and variable resistive load
with the aid of flexible connecting wires to obtain
photovoltaic parameters (Abodunrin et al., 2019).
Experimental values of short circuit (I
sc
), open circuit
voltage (V
oc
), maximum power (P
max
), fill factor (ff)
and efficiency are the measurements taken. The
experimental set-up was taken outdoors and exposed
to conditions of standard airmass of 760mmHg. The
indoor air quality due to concentrated nitric acid
blended to a colloidal paste with titanium oxide
during preparation, calcination and subsequent
fabrication was determined by assigned values
consistent with EIA averages. The pH of the dye sol
of each dye was determined with using a pH meter
and the temperatures were recorded. In addition,
phytochemical screening of the extracts identified the
chromophores present in each dye (Abodunrin et al.,
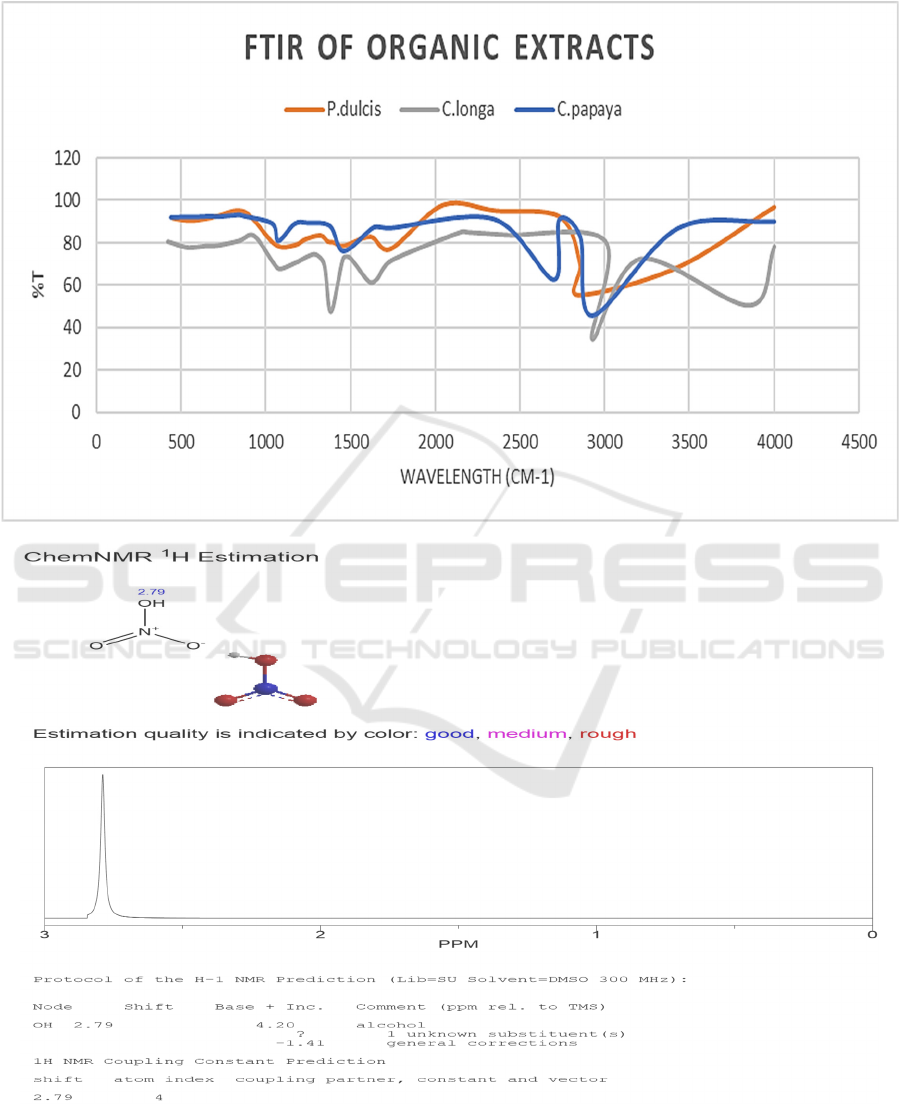
2019). The Fourier Infrared spectroscopy of each dye
would be used to study the strong reactions and their
SMARTGREENS 2020 - 9th International Conference on Smart Cities and Green ICT Systems
160

Figure 1: Comparison of pH and temperature of three organic extracts.
possible consequent emissions into the environment.
Detailed analysis of their performances relative to
images from modelling their scanning electron
micrographs was used to obtain vital statistics for
computation of EIA.
3 RESULTS AND DISCUSSION
The pH and temperature of the three organic dyes are
as presented in Figure 1. P.dulcis dye records the least
value in temperature, 27.1
o
C. This is closely followed
by C.longa with a value of 27.8
o
C and the relative
highest temperature reading is given by C.papaya
with a temperature of 28.1
o
C. The average normal
surrounding temperature is 27
o
C, P.dulcis is the
nearest in ambient temperature while C.papaya is the
farthest in this context. The Environmental
Complexity factor is calculated as shown in
Equations 1-4 (Ani and Basri, 2013).
3.1 List of EIA Equations
𝐸𝐶𝐹 1.4 0.3 𝐸
(1)
𝑇𝐶𝐹 0.6 0.01 𝑇
(2)
𝑈𝑈𝐶𝑃 𝑈𝑈𝐶𝑊 𝑈𝑅𝑊
(3)
𝑈𝐶𝑃 𝑈𝑈𝐶𝑃 𝑇𝐶𝐹 𝐸𝐶𝐹
(4)
Where ECF is the Environmental Complexity Factor,
TCF represents Technical Case Factor, UUCP
denotes the unadjusted Use Case Point, UCP
connotes the Use Case Points and URW is Unadjusted
Reaction Weight.
3.1.1 Environmental Complexity Factor
(ECF)
Higher values of environmental factor imply greater
impact on the UCP equation. Thus, assigned value of
one implies the factor has a weak impact in this
venture, two is average while three signifies a strong
impact. This means that zero-value is of no
consequence on the environment. For example,
temperature of P.dulcis would be assigned 0.1,
C.longa would be given 0.8 while C.papaya is given
1.1. In addition, pH of C.papaya is 7.32, this is a little
above neutral on the Universal indicator scale hence,
its value would be 0.32. C.longa has a pH of 6.90, the
impact would be slightly negative on the
environment, it is assigned a value of -0.1 and
P.dulcis has a value of 5.49, this is even more
negative due to its acidity. It is assigned a value of -
Environmental Impact Assessment (EIA) of pH and Other Factors on Organic Photovoltaic Performance Output
161

1.51 while in this context basicity of an alkaline dye
would be assigned positive values. Another factor
that contributes to negatively to the environment are
the drops of electrolyte introduced in-between each
dye cell to facilitate charge transport. The cumulative
effect is accorded a value or weight comprising of the
sum of its ambient temperature factor with the pH
factor multiplied by its apparent impact to yield its
calculated impact factor. The calculated factors are
added together to produce the Environmental factor
as shown in Table 1.
Table 1: Break down of ECF parameters.
Factor Dye Weight Assessment Impact
E
1
C.papaya 1.1+0.32
=1.42
3 4.26
E
2
P.dulcis 0.1‐0.10
=0
3 0
E
3
C.longa 0.8‐1.51
=0.71
3 ‐2.13
TotalE
factor
‐2.13
3.1.2 Technical Complexity Factors (TCF)
Arbitrary values between 0 to 3 are assigned
subjectively. The factors revolve around re-use, and
recycle viability. Responses for each application that
has a high influence like efficiency, 3 is awarded. The
higher the efficiency, the more viable it becomes in
its universal adoption. Response time infers how fast
the device responds to the required stimulus of
operation as this is paramount, it is allotted 3.
Kinematics refers to the excitation state of the
reactants in a dye-sensitized solar cell, whether their
momentum is elastic and the principle of conservation
of energy and linear momentum is conserved. This
decides the equilibrium of the reaction, either the
forward or backward reaction is occurring and when
they nullify to reverse each other. Portability is the
degree of compactness and ease of transporting the
device which is a prerequisite to the realization in the
primary function of any photovoltaic. A bulky
photovoltaic would experience transportation
challenges and limitation in its universal adoption.
The output efficiency is directly associated to the
photovoltaic performance of each dye-sensitized
solar cell. A zero is given to any factor that does not
have any influence on the study. A midpoint value of
2 is assigned to factors that are neither so strong yet
have a measure of influence on this study. Individual
factor’s weight is multiplied by its perceived
complexity factor to give a resultant calculated factor.
The calculated factors are summed to produce the
Total Technical Factor.
Table 2: Technical Factors of EIA.
Factor D Wt Assessment Impact
T
1
Response
Time
3 3 9
T
2
End user
Efficienc
y
0 1 0
T
3
Kinematic
of
Reaction
2 3 6
T
4
Reusability 1 0 0
T
5
Usability 3 3 9
T
6
Portability 1 2 2
T
7
Output
Efficienc
y
3 3 9
Total T
Factor
35
Key: D stands for Description, Wt connotes
Weight
3.1.3 Phytochemical Result in Terms of EIA
The outcome of phytochemical screening of the three
dyes is as shown in Table 3. A phytochemical
screening refers to the process of extracting,
identifying the bioactive substances such as:
antioxidants, flavonoids, tannins and so on. Presence
of any phytoconstituent is assigned a value of 1, while
its absence has no value and is given zero. The
significance of phytochemicals in dye-sensitized
solar cells is that, they contribute to the ionic radical
available for the redox reaction. It implies that, the
measure of effectiveness in a dye-sensitized solar cell
is a direct consequence of the metabolites available in
its bio-constituents. They also provide necessary
immunity for preserving the life cycle of the dye-
sensitized solar cell throughout. Hence the UUCW is
calculated from the product obtained from the number
of phytochemicals, weight and the number of cases as
shown in Table 4. In this project, loss of potency in
the phytochemical constituents is not given a
consideration such as the absorbance in the UV/Vis
region over a period of time. Thus, by tacit agreement
the electrolyte activates the dye-sensitized solar cell
whenever it is in operation. Furthermore, since each
phytochemical assist in the electrochemical
equilibrium, each is awarded the same strength, a
value of unity.
SMARTGREENS 2020 - 9th International Conference on Smart Cities and Green ICT Systems
162

Table 3: Phytochemicals in organic extracts.
Ch Ta Sa Fl Al Qu Gl Ca Te Ph St
C.p
+ ‐ + + + ‐ ‐ + ‐ + ‐
P.d
‐ + + + + ‐ ‐ + ‐ + ‐
C.l
+ ‐ + + + ‐ ‐ + ‐ ‐ ‐
Key: Ch (CHO); Ta (Tannin); Sa (Saponin); Fl
(Flavonoid); Al (Alkaloid); Qu (Quinone); Gl (Glycoside);
Ca (Cardiac Glycoside); Te (Terpenoid); Ph (Phenol); St
(Steroid); + indicates presence, - means absence
C.p represents C.papaya, P.d stands for P.dulcis, C.l
represents C.longa
The significance of this result is that, with respect
to their electrochemical index, C.longa < C.papaya =
P.dulcis as indicated on Table 4. Relating this to the
ECF, the electrolyte in C.longa would require more
energy to raise the Fermi potential for excitation.
Hence, the negative impact of -2.13.
Table 4: Phytochemicals in terms of UUCW.
Use case
complexity
Number of
phytochemicals
present
Wt Number
of use
cases
Pdt
C.papaya 6 1 11 66
P.dulcis 6 1 11 66
C.longa 5 1 11 55
Total UUCW 187
Key: Wt represents Weight, Pdt stands for Product
3.1.4 Unadjusted Reaction Weight (URW)
The appearance of each functional group in a Fourier
Infrared Spectrograph is a characteristic that
distinguishes it from others in a chemical reaction as
shown in Appendix I. In effect, each property
identified is assigned a weight: -1 is given to the
unidentified wavelength frequencies, 1 is assigned to
the weak (w) intensity, m is allotted 2 for medium
intensity while
3, 4 and 5 is given to strong (s), strong – narrow
(s,n) and strong -broad (n,s) intensities respectively.
Their occurrences connote the number of times they
appear, the product symbolizes their cumulative
frequency. The significance of the strength of
reaction determines the direction of the kinematics of
the overall dye-sensitized solar redox reaction and the
Fermi level in the photovoltaic.
Table 5: FTIR of P.dulcis dye.
P.dulcis
Wavelength FunctionalGroup Intensity
3423.76; 2926.11;
2852.84
O‐Hstretching
s,b
2426.53 Unidentified
2085.12 CO
2
stretching s
1741.78 C=Ostretching s
1658.84;1608.69 C=C stretching in
alkene di‐
substitution
w
1498.74 Unidentified
1456.30 Unidentified
1384.94; 1346.36;
1298.14; 1253.77;
1207.48; 1182.40;
1084.03;1043.52
O‐H bending in
carboxylicacid
m
931.65 Unidentified
842.92;715.61;
642.32;574.81
C‐Cl stretching in
alkylhalides
s
522.73; Unidentified
s: strong; w: weak; n: narrow; m: medium; b: broad
Table 6: FTIR of C.longa.
C.longa
Wavelength Functional Group Intensit
y
3853.90; 3421.83 O-H stretchin
g
s
, b
2926.11; 2852.81 Aci
d
O-H
s
, n
2426.53 O-H stretchin
g
w
2285.72; 2085.12 O=C=O in CO
2
s
1741.78; 1658.84 C-H bending in
aromatics
W
1608.69 C=C stretch in
alkene
disubstitute
d
w
1498.74; 1456.30 C-C stretch in ring
aromatics
m
1384.94;
1346.36
Symmetric nitro
compounds
m
1298.14;
1253.77;
1207.48; 1182.40
Acyl stretching s
1084.03; 1043.52 C-O stretching in
Alkoxy
m
931.65 Unidentifie
d
842.92 C-Cl stretching in
alkyl
s
715.61; 642.32 Meta di-substituted
C-H
b
en
d
w
574.81; 522.73 C-Br Stretching in
alk
y
l
s
424.35 Unidentifie
d
Key: s: strong; w: weak; n: narrow; m: medium; b: broad
Environmental Impact Assessment (EIA) of pH and Other Factors on Organic Photovoltaic Performance Output
163
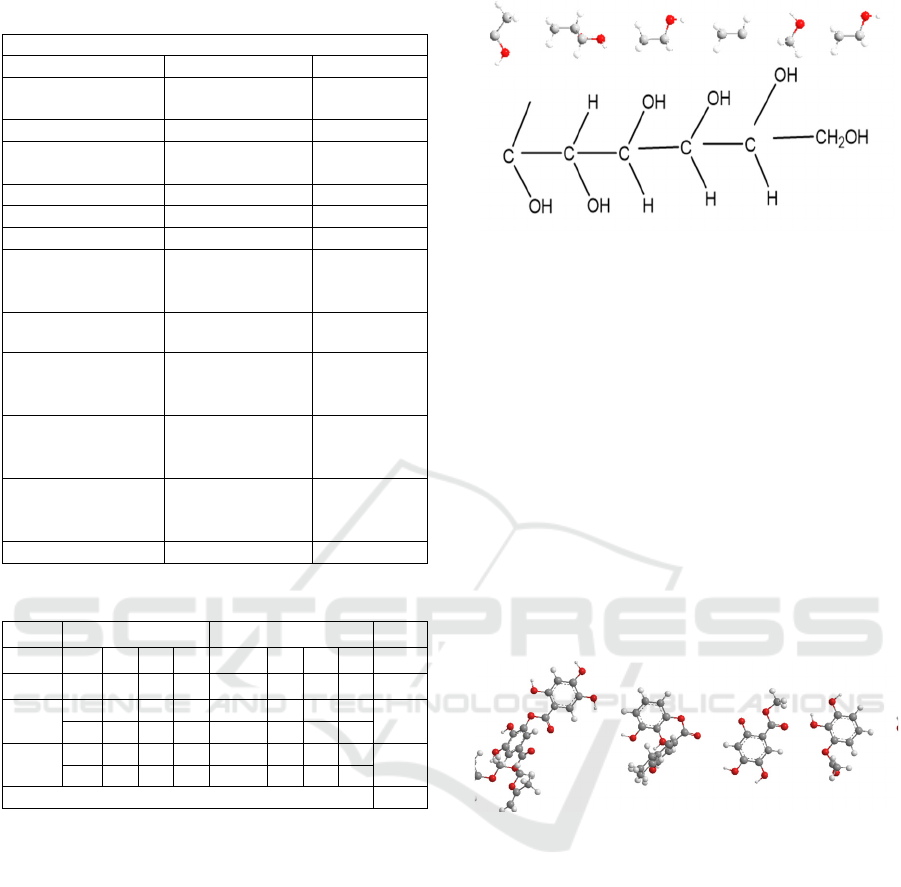
Table 7: FTIR of C.papaya.
C.
p
a
p
a
y
a
Wavelen
g
th Functional Grou
p
Intensit
y
3429.55; 2926.11 N-H stretching in
2
o
amine
s
2854.74 C-H stretchin
g
m
2729.37; 2507.54 O-H stretching in
carboxylic aci
d
s,b
2019.54 Unidentifie
d
1735.99; 1637.62 C-H
b
endin
g
w
1458.23 Unidentifie
d
1377.22;
1244.13; 1168.90;
1072.46; 1037.74
C-F stretching in
Fluoric
compounds
s
873.78 C=C bending in
alkene di-
substitute
d
w
839.06; 723.33;
665.46
C-Cl stretching
in alkyl
compounds
s
597.95; 515.01 C-Br stretching
in alkyl
com
p
ounds
w
437.86 Unidentifie
d
Table 8: FTIR of dyes in terms URW.
Dye Weight Occurrences Pdt
P.d S m w U s m w U
3-5 2 1 -1 3,0,1 2 1 4 15
C.l
S
m w U
s
m w U
29
3-5 2 1 -1 4,1,1 3 4 2
C.p
S
m w U
s
m w U
16
3-5 2 1 -1 3,0,1 1 3 3
URW
Total
60
C.p represents C.papaya, P.d stands for P.dulcis, C.l
represents C.longa
3.1.5 Stereochemistry of Dyes on EIA
The interpretation of the dye molecular structure with
regards to their atomic position in 3-dimensional
space is required for the EIA. Thus, the
phytochemicals will be investigated for their reaction
in the applied photovoltaic. In particular,
carbohydrate presence would be examined as
illustrated in Figure 2.
The chemical formula differs from the
characteristic C
6
H
12
O
6
due to the chemical reaction in
the photovoltaic. Element composition conforms with
the standard CHO in organic compounds, in effect
these elements have a positive photo degeneracy
quotient.
Chemical Formula: C
12
H
30
O
6
Exact Mass: 270.20
Molecular Weight: 270.37
m/z: 270.20 (100.0%), 271.21 (13.0%). 272.21 (1.2%)
Elemental Analysis: C, 53.31; H, 11.18; O, 35.51
Figure 2: Analysis of Carbohydrate in dyes.
It is pertinent to also explore the sole presence of
tannins in P.dulcis, the reaction interpretation is as
shown in Figure 3. The presence of tannins influenced
the unadjusted reaction weight (URW) to give the
least value. It is also noteworthy that, tannins
probably assisted P.dulcis in actualizing the zero
impact on the environmental complexity factor
(ECF). This is attributable to its numerous ligands
which facilitate its articulation with other bio-
molecules. Hence, it has better photo degeneracy than
Carbohydrates.
Chemical Formula: C
61
H
65
O
29
Exact Mass: 1261.36
Molecular Weight: 1262.16
m/z: 1261.36 (100.0%), 1262.36 (66.0%), 1263.37
(21.4%), 1263.37 (6.0%), 1264.37 (4.6%), 1264.37 (3.9%)
Elemental Analysis: C, 58.05; H, 5.19; O, 36.76
Figure 3: Analysis of Tannin in P.dulcis dye.
The presence of flavonoid in all three organic
dyes makes available bio-catalysts in the respective
photovoltaic reactions. It also offers a large store of
carbon atoms from the C
6
-C
3
-C
6
molecular
framework. The three organic photovoltaic cells act
as a form of carbon sequestrate as shown in Figure 4.
SMARTGREENS 2020 - 9th International Conference on Smart Cities and Green ICT Systems
164
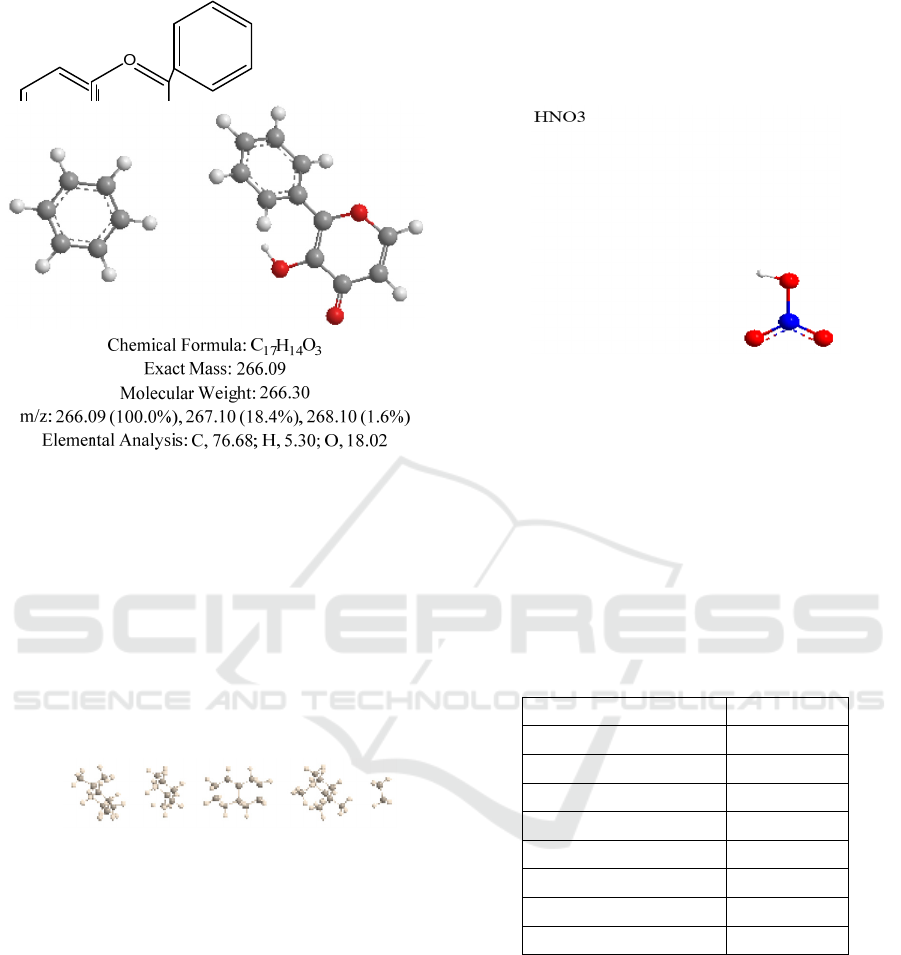
Figure 4: Interaction of Flavonoid in dyes.
The interaction of saponins in the three
photovoltaic cells will be considered in order to
assess the environmental impact. Saponins provide
the underlying foundation for the assortment of
functional groups attachment and determines the
general shape of the molecule. Saponins serve a
steroidal physiological function keeping the other
bio-substances active. Their ligands combine with
other functional groups during the chemical reaction
in the photovoltaic as shown in Figure 5.
Chemical Formula: C
37
H
72
Exact Mass: 516.56
Molecular Weight: 516.98
m/z: 516.56 (100.0%), 517.57 (40.0%), 518.57 (7.8%)
Elemental Analysis: C, 85.96; H, 14.04
Figure 5: Analysis of Saponin Effect on Photovoltaic.
Interestingly, the phenolic ring is a recurrent
feature in both saponins and flavonoids. A third
consistent functional group in the dyes is the
Alkaloid. Phenols constitute the major class of
secondary metabolites in plants. Their aromatic
nature is responsible for pigmentation, flavour (not
applicable in this study) and acerbity. Although they
possess -OH functional group similar to alkaloids,
they exhibit stronger potency in chemical reactions.
These interactions with the concentrated
trioxonitrate (V) acid and titanium will be discussed
with a focus on their EIA impact. The energy and
gradient of applying the concentrated trioxonitrate
(V) acid on the titanium was run with CHEM DRAW
and the output is as shown in Figure 6.
Figure 6: A model of Concentrated HNO
3
.
The Energy (MMFF94) and Gradient was
determined using software program estimate. The
total energy for this frame was given as, 15.976
kcal/mol. The RMS Gradient was given as 44.260.
Thus, the MM2 Calculation completed successfully.
The MM2 Dynamics was obtained from Pi
System: 5 4 6.
Some parameters are assigned (Quality = 1). The
remaining associated properties were calculated and
the result is as shown on Table 9.
Table 9: Dynamics of Reaction.
Stretch 4.6807
Bend 3.1011
Stretch-Bend -0.2023
Torsion -0.5171
Non-1,4 VDW -0.0943
1,4 VDW 2.2077
Charge/Charge 0.0000
Charge/Dipole -5.7107
Dipole/Dipole 6.3333
The total energy for this frame: 9.799 kcal/mol
The energy of the reaction was the second value determined, in
this context of the photovoltaic reaction and the environmental
impact.
The Equations of the redox reaction in the
photovoltaic cells is as indicated in Equations 5-7
(Cadien and Nolan, 2012). The dye (D) absorbs
photons of energy from the sun and becomes excited
𝐷
∗
as shown in Equation 5, the dye is affixed to the
titanium frame. The oxidized or excited dye gets
reduced by iodide as illustrated in Equation 6. The
Environmental Impact Assessment (EIA) of pH and Other Factors on Organic Photovoltaic Performance Output
165

formation of iodide radical on the oxide surface is
shown in Equation 7.
𝑇𝑖𝑂
𝐷
⁄
ℎ𝑣→𝑇𝑖𝑂
𝐷
∗
⁄
(5)
𝑇𝑖𝑂
𝐷
∗
⁄
2𝐼
→𝑇𝑖𝑂
𝐷
⁄
𝐼
(6)
2𝐼
→𝐼
𝐼
(7)
The effect of concentrated nitric acid on the
environment is shown in the Appendix. The graph
illustrates a sine crest, depicted by an initial rise in the
density of the molecules of the acid as it reaches a
peak. As diffusion occurs with air molecules colliding
with the fumes given off from the acid, the peak
gradually slopes down until there is equilibrium.
4 CONCLUSIONS
Environmental Complexity Factor (ECF) from
Equation 1 gives 2.639, Technical Complexity Factor
gives 0.95 from Equation 2, Unadjusted case product
in Equation 3 is given as 247, Use Case Point from
Equation 4 gives 421.55 in 2 decimal places. It is
generally difficult to gauge the environmental effect
based on this outcome unless there is a standard for
comparison. Hence, at this point it is imperative to
introduce an index. The first is a comparison of each
dye relative to the sum-total of the effect of all the
dyes. On this basis, individual assessment for the dyes
give 8.544, 8.468 and 15.68 for C.papaya, P.dulcis
and C.longa respectively. C.longa dye has close to the
addition of the individual effects of C.papaya and
P.dulcis dyes. This is a direct consequence of the
unadjusted reaction weight (URW) factor. Converse
to conventionality, this project reveals that all organic
dyes have an effect on the environment, although
their impact varies for different photovoltaics.
Another salient factor becomes measuring the level of
impact, in terms of photo degeneracy relative to fossil
fuels. In terms of degradation, each organic dye
produces negligible effect but the combination of
dyes has a multiplicity effect on the environment
which is minimal with respect to fossils. C.longa has
almost double the environmental footprint of
C.papaya and P.dulcis as indicated in this result. The
photo degeneracy of C.longa is double in its
consequence. In terms of the FTIR spectroscopy,
C.longa shows CO
2
at two wavelength frequency
peaks, C.papaya shows in just one, P.dulcis shows
none. This is a direct consequence of their carbon
sequestration characteristic, P.dulcis is not a carbon
sequestrate. Eventually, this study shows a direct
correlation between the environmental footprint of
the dyes through their CO
2
reaction. In terms of
carbon sequestration, C.longa dye is determinedly the
best of all three dyes in ultimately reducing the
greenhouse effect.
The outcome of this project prescribes the
following measures:
1. The environmental footprint of dyes should
be one of the foundational studies carried out
before their subsequent use in photovoltaics.
2. A preliminary information on Fourier
Infrared spectroscopy of any extract should
be a prerequisite source of information on
the reaction that each dye content would
promote.
3. Promoting the natural photovoltaic
processes is a simple but effective means of
reducing the atmospheric carbondioxide
levels. This is because, dispersed
carbondioxide sources are very challenging
to harness for cost effective carbon
separation and capture methods.
ACKNOWLEDGEMENTS
The authors of this work are immensely grateful to
Covenant University for providing an appropriate
ambience required for the investigation of this
research. They also wish to appreciate the
technologists at the Chemistry department of
Redeemers’ University, Ede for the Fourier Infrared
spectroscopy of the organic dyes. Their gratitude goes
to the technologists at the Biochemistry laboratory of
Covenant University for their expertise in identifying
the phytochemicals present in each of the dye.
REFERENCES
Abdullahi, A.C., Siwar, C., Shaharudin, M.I., Anizan, I. J.,
2018. Carbon Sequestration in Soils: The Opportunities
and Challenges. Intechopen, 79347.
Smit, B., Reimer, J.A., Oldenburg, C.M., Bourg, I.C., 2014.
Introduction to Carbon Capture and Sequestration. The
Berkeley Lectures on Energy, 1: 596.
Lal, R., Lorenz, K., Hüttl, R.F., Schneider, B.U., von Braun,
J., 2013. Ecosystem Services and Carbon Sequestration
in the Biosphere. Springer Books: 467.
Park, S.K., Ahn, J.H., Kim, T.S., 2011.Performance
evaluation of integrated gasification solid oxide fuel
cell/gas turbine systems including carbon dioxide
capture. Applied Energy, 88(9): 2976-2987.
Martelli, E., Kreutz, T., Carbo, M., Consonni, S., Jansen,
D., 2011. Shell coal IGCCS with carbon capture:
SMARTGREENS 2020 - 9th International Conference on Smart Cities and Green ICT Systems
166

Conventional gas quench vs. innovative configurations.
Applied Energy, 88(11): 3978-3989.
Olateju, B., and Kumar, A. 2013.Techno-economic
assessment of hydrogen production from underground
coal gasification (UCG) in Western Canada with carbon
capture and sequestration (CCS) for upgrading bitumen
from oil sands. Applied Energy, 111: 428-440.
Botero, C., Field, R.P., Herzog, H.J., Ghoniem, A.F., 2013.
Impact of finite-rate kinetics on carbon conversion in a
high-pressure, single-stage entrained flow gasifier with
coal–CO
2
slurry feed. Applied Energy, 104: 408-417.
Wich, T., Lueke, W., Deerberg, G., Oles, M., 2020.
Carbon2Chem®-CCU as a Step Toward a Circular
Economy. Frontiers in Energy Research, 7: 162.
Müller, L.J., Kätelhön, A., Bachmann, M., Zimmermann,
A., Sternberg, A., Bardow, A., 2020. A Guideline for
Life Cycle Assessment of Carbon Capture and
Utilization. Frontier in Energy Research, 8:15.
Heek, J.O., Arning, K., Linzenich, A., Ziefle, M., 2018.
Trust and Distrust in Carbon Capture and Utilization
Industry as Relevant Factors for the Acceptance of
Carbon-Based Products. Frontier in Energy Research,
6: 73.
Ani, Z.C., Basri, S., 2013. A Web-Based Tool Support for
Automating Software Effort Estimation. Information
Systems International Conference (ISICO).
Bettinger, P., Boston, K., Siry, J.P., Grebner, D.L., 2017.
Forest Management and Planning, Academic Press, 2
nd
edition.
Amundson, R., and Biardeau, L., 2018. Opinion: Soil
carbon sequestration is an elusive climate mitigation
tool. Proceedings of the National Academy of Sciences
of the United States of America, 115 (46): 11652-
11656.
Broday, D., Dayan, U., Aharonov, E., Laufer, D., Adel, M.,
2020. Emissions from gas processing platforms to the
atmosphere-case studies versus benchmarks.
Environmental Impact Assessment Review, 80: 106313.
Zeleňáková, M., Labant, S., Zvijáková, L., Weiss, E.,
Čepelová, H., Weiss, R., Jitka Fialová, J., Minďaš, J.,
2020. Methodology for environmental assessment of
proposed activity using risk analysis. Environmental
Impact Assessment Review, 80: 106333.
Barandiaran, J., Rubiano-Galvis, S., 2019. An empirical
study of EIA litigation involving energy facilities in
Chile and Colombia. Environmental Impact Assessment
Review, 79: 106311.
Wang, Q., Su, M., 2020. Drivers of decoupling economic
growth from carbon emission – an empirical analysis of
192 countries using decoupling model and
decomposition method. Environmental Impact
Assessment Review, 81: 106356.
Abodunrin, T.J., Emetere, M.E., Ajayi, O.O., Uyor, U.O.,
Popoola, O., 2019. Investigating the prospect of micro-
energy generation in S. Anisatum Dye-sensitized solar
cells (DSCs). Journal of Physics: Conference Series,
1299 (1): 012028.
Abodunrin, T. J., Boyo, A. O., Usikalu, M. R., Ajayi, O. O.,
2019. Investigation of effect of batch-separation on the
micro-energy generation in M.indica L. dye-sensitized
solar cells. Procedia Manufacturing, 35: 1273-1278.
Abodunrin, T.J., Boyo, A.O., Usikalu, M.R., Emetere,
M.E., 2019. Investigating the Influence of Selective Co-
sensitization of Two N719 Dyes on the Micro-Energy
Generation from Dye-sensitized Solar Cells. Journal of
Physics: Conference Series 1299 (1), 012027.
Cadien, K.C., Nolan, L., 2012. CMP Method and Practice
in Handbook of Thin Film Deposition, Science Direct,
3rd Edition.
Environmental Impact Assessment (EIA) of pH and Other Factors on Organic Photovoltaic Performance Output
167
APPENDIX
SMARTGREENS 2020 - 9th International Conference on Smart Cities and Green ICT Systems
168
