
Software Test Automation Maturity: A Survey of the State of the Practice
Yuqing Wang
1
, Mika V. Mäntylä
1
, Serge Demeyer
2
, Kristian Wiklund
3
, Sigrid Eldh
3
and Tatu Kairi
4
1
M3S Research Unit, University of Oulu, Oulu, Finland
2
Universiteit Antwerpen & Flanders Make, Antwerp, Belgium
3
Ericsson AB, Stockholm, Sweden
4
Eficode, Helsinki, Finland
Keywords:
Software, Test Automation, Maturity, Improvement, Assessment, Best Practice.
Abstract:
The software industry has seen an increasing interest in test automation. In this paper, we present a test automa-
tion maturity survey serving as a self-assessment for practitioners. Based on responses of 151 practitioners
coming from above 101 organizations in 25 countries, we make observations regarding the state of the practice
of test automation maturity: a) The level of test automation maturity in different organizations is differentiated
by the practices they adopt; b) Practitioner reported the quite diverse situation with respect to different practices,
e.g., 85% practitioners agreed that their test teams have enough test automation expertise and skills, while 47%
of practitioners admitted that there is lack of guidelines on designing and executing automated tests; c) Some
practices are strongly correlated and/or closely clustered; d) The percentage of automated test cases and the use
of Agile and/or DevOps development models are good indicators for a higher test automation maturity level; (e)
The roles of practitioners may affect response variation, e.g., QA engineers give the most optimistic answers,
consultants give the most pessimistic answers. Our results give an insight into present test automation processes
and practices and indicate chances for further improvement in the present industry.
1 INTRODUCTION
With the rise of agile development and the adoption
of continuous integration, the software industry has
seen an increasing interest in test automation (Autoine
et al., 2019). Many organizations invest in test automa-
tion but fail to reap the expected benefits (Garousi
and Mäntylä, 2016). Several process-related prob-
lems aggravate these failures: unrealistic goals, lack
of management support, the undefined test approach,
shortage of expertise and resources, and so forth (Rafi
et al., 2012; Sauer et al., 2016). Prior researchers refer
to these problems as lack of test automation matu-
rity which obstructs a true continuous improvement
paradigm (Kasurinen et al., 2010).
Despite the research efforts on test automation
maturity are increasing, there is little known about
the state of practice of test automation maturity in
the present industry (Rodrigues and Dias-Neto, 2016;
Wang, 2018). It is important to get an understanding
of the current test automation processes and practices
by empirical studies in order to observe the oppor-
tunities for continuous improvement and expand the
contribution and impact of test automation maturity
research (Eldh et al., 2014; Garousi et al., 2020).
In this paper, we explore the state of practice of
test automation maturity regarding the adoption of test
automation practices. This survey study intends to
answer the following research questions:
• RQ1 – Process Maturity:
How mature are cur-
rent test automaton processes based on adopted
practices?
• RQ2 – Practice Maturity:
Which practices are
more mature and immature in the industry?
• RQ3 – Practice Correlation:
Is there a correla-
tion between the adopted test automation prac-
tices?
• RQ4 – Organizational Factors:
What are the
characteristics of organizational units related to
test automation maturity?
• RQ5 – Response Variation:
How do the current
roles of practitioners (respondents) affect the re-
sponse variation?
The survey itself is based on an extensive literature
survey and validated with four industry experts. We
distributed the survey through a variety of channels
and received 151 responses from more than 101 or-
ganizations located in 25 different countries, most of
them from Finland, Belgium and Netherlands. The
detailed survey results can be found in the rest of this
paper.
Wang, Y., Mäntylä, M., Demeyer, S., Wiklund, K., Eldh, S. and Kairi, T.
Software Test Automation Maturity: A Survey of the State of the Practice.
DOI: 10.5220/0009766800270038
In Proceedings of the 15th International Conference on Software Technologies (ICSOFT 2020), pages 27-38
ISBN: 978-989-758-443-5
Copyright
c
2020 by SCITEPRESS – Science and Technology Publications, Lda. All rights reserved
27

The remainder of this paper is organized as fol-
lows: Section 2 presents the related work. Section 3
describes the research method. Section 4 presents
survey results. Section 5 discusses the implication
of survey results. Section 6 states threats to validity.
Section 7 concludes this paper and states the future
work.
2 RELATED WORK
Test automation is an important part of software de-
velopment process (Pocatilu, 2002). It consists of
a set of practices conducted in key process areas
(KPAs), e.g., test design, test execution, test report-
ing (Koomen et al., 2013). Test automation maturity
refers to the level of maturity of a test automation
process. Achieving the high level of test automation
maturity requires that mature practices are performed
in each KPA (Mitchel, 1994). Several examples of the
negative effects of immature practices have been re-
ported in the literature. Selecting the wrong test tools
for the problems at hand may impact the organizational
performance (Garousi et al., 2017). Automating test
cases better suited for manual testing may waste time
and money (Garousi et al., 2017). Defining inappropri-
ate metrics is likely to guide your test automation in
the wrong direction (Walia et al., 2017).
In prior research, Wang et al. (2019) studied 25
sources (including 18 test maturity models, 3 journal
papers, and 4 recent software testing related technical
reports) that covering test automation maturity topics.
Referring to their research results, based on those 25
sources, an organization should focus on 13 KPAs to
conduct test automation practices. The mature prac-
tices must be performed in each KPA were synthesized,
see Table 1. Those mature practices have been proven
to be valid in the present industry by test automation
experts from both academia and industry.
3 RESEARCH METHOD
To answer research questions of this study, we con-
ducted a test automation maturity survey in the indus-
try. The survey was designed and executed following
the ‘Guidelines for Conducting surveys in Software
Engineering’ from Linåker et al. (2015). We designed
and conducted our survey in six stages: (1) sampling
and distribution plan, (2) survey design, (3) survey
validity, (4) survey execution and data collection, (5)
measurement of response quality, (6) data analysis.
Each stage is described in the following sub-sections.
Table 1: Best practices in KPAs (Wang et al., 2019).
KPA Mature practice
K01
Test automation
strategy
Set explicit strategic plans
for test automation
K02 Resources
Provide enough resources
(e.g., skilled people, costs,
efforts) for test automation.
K03 Test
organization
Assemble and collaborate
skilled test staffs perform
test automation practices.
K04 Knowledge
transfer
Collect and share test au-
tomaton related knowledge
K05 Test tools
Use right test tools to sup-
port testing activities.
K06 Test
environment
Set up test environment with
required software, hardware,
test data, etc., to execute au-
tomated tests
K07 Test
requirements
Derive explicit test automa-
tion requirements.
K08 Test design
Use the specific test design
techniques to create main-
tainable test cases for test
automation.
K09 Test execution
Prioritize and execute auto-
mated test cases
K10 Verdicts
Collect and report useful re-
sults of executing automated
test cases.
K11
Test automation
process
Define the specific proce-
dures to conduct test au-
tomation.
K12 Measurements
Use right metrics to measure
the quality and performance
of test automaton.
K13
Software Under
Test (SUT)
Prepare the testable SUT to
be automatically tested.
(1) Sampling and Distribution Plan.
The first au-
thor defined a sampling and distribution plan that
specifies the process to select a sample; the second
and third authors reviewed this plan. We planned to
reach respondents based on their interests in the sur-
vey and accessibility using the Convenience Sampling
method (Etikan et al., 2016). This is the dominant
approach widely used in survey and empirical research
in SE (Sjøberg et al., 2005). The target population
was identified as practitioners directly working on test
automation in the whole industry. Social media’s inter-
est groups as well as the network of industry contacts
were planned to be used to reach the target population
and distribute the survey.
(2) Survey Design.
The survey in this study was ad-
ministered using an online survey tool Limesurvey.
The survey consists of three main parts. Part 1 intro-
duces the survey, including details about the content, a
ICSOFT 2020 - 15th International Conference on Software Technologies
28

consent statement, steps to answer the survey, and the
names of the principal researchers.
Part 2 contains test automation maturity ques-
tions (Table 2). Those questions were defined accord-
ing to mature practices that must be performed in KPAs
as presented in Table 1. Each question addresses at
least one KPA, see Table 2. As the questions were
revised according to the feedback of industry experts
(see Section 3), there is no one-to-one mapping be-
tween questions and KPAs. The purpose of asking
those questions is to examine the maturity state of
practitioners’ test automation processes by checking
if they are performing mature practices in the present
industry. To answer the question, respondents were
expected to indicate their degree of agreement with the
statement of each question by using a six-point scale:
1- strongly disagree, 2 - disagree, 3 - slightly disagree,
4 - slightly agree, 5 - agree, 6 - strongly agree. In addi-
tion to the scale, we also offered a ‘no answer’ option.
The higher point marked in the scale means more ma-
ture practices were performed. If a respondent marks
a higher point for all questions, it would correspond
with a higher level of test automation maturity. Part 2
of the survey finished with a free-text field to gather
more detailed insights into responses.
Part 3 presents background questions to collect
demographic information of respondents and their or-
ganizational units to conduct test automation. Kitchen-
ham and Pfleeger (2002) recommended putting such
questions at the end in order to ensure potential re-
spondents will not be deterred from completing the
survey.
To boost the response rate, we implemented a re-
ward mechanism. We sent an individual report with
a snapshot of the results and a comparison against
a baseline of average responses. Ghazi et al. (2018)
reported that software practitioners may not want to
participate in a survey that collects information about
respondents. Therefore, we designed the survey to
be anonymous, both in collecting the responses and
reporting the survey results. Also, the survey adheres
to the European General Data Protection Regulation
(GDPR).
(3) Survey Validity.
We conducted an expert review
and a small-scale pilot to evaluate the validity of our
survey, in order to examine whether it measures what
was intended and avoid potential measurement er-
rors (Litwin, 1995).
Four industrial experts were selected from our net-
work to participate in the review. They come from
three Swedish and Finnish companies. The important
criterion to select industrial experts was "hands-on ex-
perience with test automation". The selected experts
have been working on test automation for decades.
We allowed all experts to assess a survey sample via
the Limesurvey system. They were asked to review
all survey questions and give suggestions for revision.
Several online meetings were conducted. As the result,
the following revisions were made to the survey: a)
revise survey questions; b) make survey questions to
be close to everyday situations in an industrial con-
text; c) add concrete industrial examples to explain the
practices.
After the expert review, we piloted our survey with
three practitioners. They work in the same test automa-
tion team; each answered the survey independently.
We compared the responses of three practitioners, and
found that the differences are rather small which con-
firmed that the questions were understandable.
(4) Survey Execution and Data Collection.
The
survey was activated in the Limesurvey system in
December 2018, and remained open until June 2019.
Survey researchers recommend to ensure the longer
duration of availability of online surveys, in order to
boost the response rate (Nulty, 2008).
The survey was distributed to the target popula-
tion by different methods. First, we posted the sur-
vey in software testing related groups in social media:
LinkedIn, Facebook, Twitter, and Reddit. Second, we
used the email list of TESTOMAT project and FiSTB
(mailing list of software testing practitioners in Fin-
land) to distribute the survey. Within TESTOMAT
project, we requested at least one person from each
partner company to answer our survey. Third, nine
principal contact people from our industry network
further distributed our survey in their networks. They
sent the survey to potential respondents in their indus-
try contacts via individual emails.
Table 3 shows the statistics about data collection in
different distribution channels. In this table, ‘Reached
audience’ refers to the number of people who view our
posts or emails. ‘Interested respondents’ indicate the
number of people visited our survey system. ‘Received
responses’ indicate the number of people who actually
answered the survey.
(5) Measurement of Response Quality.
The qual-
ity of responses in an online survey is rather difficult to
control due to its openness (Nulty, 2008). In this sur-
vey, we used the standard to measure response quality
for online surveys from Ganassali (2008). We col-
lected the following measures to assess the quality of
157 responses in our initial pool:
•
The response rate: the number of received re-
sponses divided by the number of interested re-
spondents (see Table 3).
Software Test Automation Maturity: A Survey of the State of the Practice
29

Table 2: Test automation maturity questions in the Part 2.
Survey questions KPA(s)
SQ1-Strategy
. We have a test automation strategy that defines ‘what test scope will be automated to what
degree, when, by whom, by which methods, by what test tools, in what kind of environment’.
K01
SQ2-Resources
. We allocate enough resources for test automation, e.g., skilled people, the funding, the time
& effort, test environment with the required software, hardware, or test data for test automation.
K02
SQ3-Roles. We clearly define roles and responsibilities of stakeholders in test automation. K03
SQ4-Knowledge
. We are systematically learning from prior projects. We collect and share expertise, good test
automation practices, and good test tools for future projects.
K04
SQ5-Competence
. Our test team has enough expertise and technical skills to build test automation based on
our requirements.
K03
SQ6-Tools. We currently have the right test tools that best suit our needs. K05
SQ7-Test environment. We have control over the configuration of our test environment. K06
SQ8-Guidelines
. We have guidelines on designing and executing automated tests. Those guidelines include,
e.g., coding standards, test-data handling methods, specific test design techniques to create test cases, processes
for reporting and storing test results, the general rules for test tool usage, or information on how to access
external resources.
K08,K09
SQ9-Prioritization. We effectively prioritize and schedule automated test cases for the execution. K09
SQ10-Test results
. We are capable to manage and integrate test results collected from different sources (e.g.,
different test tools, test levels, test phases) into a big picture, and then report useful information to the relevant
stakeholders
K10
SQ11-Process. We organize our test automation activities in the stable and controllable test process. K11
SQ12-SUT
. Our Software Under Test enables us to conduct our test automation, e.g., maturity, running speed,
or testability of our Software Under Test is not a problem for our test automation.
K13
SQ13-Metrics. We have the right metrics to measure and improve our test automation process. K12
SQ14-Testware
. Our testware (e.g., test cases, test data, test results, test reports, expected outcomes, and other
artifacts generated for automated tests) is well organized in a good architecture and it is easy to be maintained.
K08
SQ15-Efficient&Effective
. We create automated tests that are able to produce accurate and reliable results in
timely fashion.
K09
SQ16-Satisfaction
. We create automated tests can meet the given test purposes and consequently bring
substantial benefits for us, e.g., better detection of defects, increase test coverage, reduce test cycles, good
Return on Investment, better guarantee product quality.
K07
Table 3: Statistics on data collection.
Channels Reached Interested Received
audience audience responses
Social media:
LinkedIn >330* 81 32
Facebook >617** 9 5
Twitter 2250 19 4
Reddit 75 10 2
Email lists:
TESTOMAT 89 83 31
FiSTB 920 41 14
Individual 113 91 46
emails
Total >4394 334 157
∗
Linked In only allows to track post views for individual accounts. Our o-
riginal post had 330 views and it was shared by 5 reposts.
∗∗
Facebook does not track post views for individual accounts. 617 is the
total member count for all test automation interest groups where we posted
the survey.
•
The dropout rate: the ratio of respondents who
started the survey but never reached the end.
•
The “same response” rate: the ratio of respondents
who have selected the same response from 6 point
scale for all questions in part 2 of the survey.
•
The “no answers” rate: the ratio of respondents
having more than 50% of ’no answers’ on ques-
tions in part 2 of survey.
Table 4 shows the measurement results. To im-
prove the overall response quality, we removed 6 re-
sponses we deemed inadequate based on the quality
measurements listed above. Thus we removed re-
sponses that (a) failed to reach the end of the survey;
(b) had the same response for all questions in part 2;
(c) had more than 50% ‘no answers’. At the end, a
final pool of 151 responses was collected.
Table 4: Measures for the response quality.
The response rate: 47.0%
The dropout rate: 5.1%
The same response rate: 1.9%
The ‘no answers’ rate: 1.9%
(6) Data Analysis.
The survey data was exported
from the Limesurvey system and imported into R for
data analysis. Responses on the 6-point scale were
recorded in a score 1-6; ‘no answer’ converts to ‘NA’.
The total score of all questions of each response was
recorded as maturity score. The data analysis methods
ICSOFT 2020 - 15th International Conference on Software Technologies
30

for certain research questions are described as follows:
a. NA omit. In ‘RQ1 – Process Maturity’, we omit-
ted 24 responses having NA value(s) and only analyzed
the remaining 127. Since NA has no numeric value, it
may affect the calculation of final maturity score (that
indicates the level of test automation maturity) of a
response.
b. Correlation coefficient. To answer ‘RQ3 – Prac-
tice Correlation’, the Kendall Rank (KR) correlation
coefficient (
r
k
) was computed between the responses
to each test automation maturity question and another
in part 2 of our survey. KR correlation coefficient
method was finally selected, as our variables (survey
questions) are measured on an ordinal scale and follow
a monotonic relationship (Puth et al., 2015). In this
study, R package ‘col’ was used to compute
r
k
, and NA
values were automatically excluded in the computing
operations by using R function ‘na.exclude()’. Co-
hen’s Cohen (1988) interpretation is used to describe
the strength of the correlation based on the absolute
value of
r
k
: weak correlation (
r
k
=.10-.29), medium
correlation (
r
k
=.30-.49); strong correlation (
r
k
>.50).
Cluster analysis was performed to identify multiple
types of practices that fall into relative clusters. R
package ‘hclust’ was used to plot the hierarchihcal
clustering based on r
k
-based distance.
c. Negative binomial regression analysis. To an-
swer ‘RQ4 – Organizational Factors’ and ‘RQ5 – Re-
sponse Variation’, negative binomial (NB) regression
analysis was carried out. We selected this regression
model for three reasons: a) regression analysis is sta-
tistical method to examine the relationship among vari-
ables; b) the values of our dependent variable are non-
negative integers, making NB regression better choice
than normal linear regression; c) NB regression allows
for more variability and dispersion compared to linear
regression.
In ‘RQ4 – Organizational Factors’, we built the
NB regression model with characteristics of organiza-
tional units as independent variables and respondents’
maturity score as the dependent variable. Thus, the
independent variables include: the organizational level,
the size, who performs (test automation), percentage
of automated test cases, and software development life-
cycle (SDL). The SDL related variables were created
according to three groups of models: agile, traditional
(Waterfall and Rational Unified Process), and DevOps.
This SDL classification was introduced by Noll and
Beecham (2019). In our classification, DevOps is not
combined with agile and it was created as an indepen-
dent category, since it extends agile principles (Vir-
mani, 2015).
In ‘RQ5 – Response Variation’, we built the NB
regression model with the roles of respondents as in-
dependent variables and respondent’s maturity score
as the dependent variable. The roles of respondents
related variables include job positions and work areas.
The categorical variables were transformed into
dummy variables. We used R function ‘glm.nb()’ to
build NB regression models and NA values were auto-
matically excluded in computing operations by using
R function ‘na.exclude()’. The analysis on the models
was performed to answer research questions.
4 RESULTS
To present the survey results, we first provide an
overview of the respondent profile and organizational
unit profile. Next, we answer each research question
in turn.
Respondent Profile.
Based on our statistics, 151 re-
spondents of our survey come from more than 101
organizations in 25 different countries. Since our sur-
vey was anonymous, we only counted the number of
organizations that respondents voluntarily provided.
Table 5 shows the classification of respondents by
country. It is noted that approximately 84.7% of re-
spondents (N=128) come from Europe. Respondents
coming from Finland (27.8%), Belgium (16.6%), and
Netherlands (13.2%) made a substantial contribution.
The rest of respondents scattered over other countries
in the world. Table 6 shows the classification of re-
spondents by sector. Based on that, we see that test
automation has been widely adopted in a variety of
sectors.
Table 5: Respondents by country.
Country N (%) Country N (%)
Europe: Asia:
Finland 42 (27.8 %) China 6 (4.0%)
Sweden 11 (7.3%) Vietnam 2 (1.3%)
Belgium 25 (16.6%) India 3 (2.0%)
Netherlands 20 (13.2%) Americas:
German 7 (4.6%) USA 3 (2.0%)
UK 3 (2.0 %) Canada 3 (2.0%)
Spain 9 (6.0%) Others: 6 (4%)
Turkey 4 (2.6%)
Other Europe 7 (4.6 %)
Table 7 shows the classification of respondents
by job position and work area. Over half of the re-
spondents (56.2%) have the technical role of testers,
QA engineers, and developers. A smaller yet sub-
stantial proportion of respondents (33.1%) having the
managerial role of test leads, managers, and directors.
The 10.6 % of respondents have other roles like con-
sultant and environment architect in test automation.
Software Test Automation Maturity: A Survey of the State of the Practice
31
Table 6: Respondents by sector.
Sector Responses
Automotive 10 ( 6.6 % )
Transportation & logistics 18 (11.9 %)
Energy and utilities 11 (7.3%9
Financial services 20 (13.2%)
Healthcare and life sciences 16 ( 8.8 %)
Government and public sector 13 (8.6 %)
Telecommunication 7 (4.6%)
Software 94 (62.3%)
Data processing and hosting 15 ( 9.9%)
Industrials 10 (6.6%)
Technology hardware and equipment 9 (6%)
Others 27 (17.9%)
∗
Note that a respondent can work in multiple sectors.
Table 7: The current roles of respondents.
Responses
%
Job positions:
Test Lead/Manager/Director
50 33.1%
Tester 28 18.5%
QA Engineer 28 18.5%
Developer 29 19.2%
Consultant 9 6.0%
Other 7 4.6%
Work areas*:
Test management 76 50.3%
Test tool selection 64 42.4%
Test tool usage 86 57.0%
Test design 83 55.0%
Test execution 70 46.4%
Test environment 89 58.9%
Test requirements 91 60.3%
Measurements 64 42.4%
Others 12 7.9%
∗
Note that a respondent can work in several areas.
Respondents are working in a variety of areas in test
automation.
Organizational Unit Profile.
Table 8 shows the or-
ganizational unit profile of respondents, i.e. the unit
that conducts test automation. We see that respon-
dents’ test automation processes are mainly organized
at the team level (34.4%), the project level (30.5%),
and equally important the whole organization level
(32.5%). Only few are organized at another level
(2.6%). The organizational units differ in size; we have
more responses from smaller organizational units.
Respondents reported that their test automation
processes are mainly conducted by in-house test team
(62.9%) and developers (50.3%) in their organizational
units. In only 19.2% of the cases, test automation is
outsourced.
As for the percentage of automated cases, about
half of the respondents reported that they automate less
than 50% test cases. Only about 10% of respondents
Table 8: Organizational unit profile.
Responses
The level:
The team level 52 (34.4%)
The project level 46 (30.5%)
The organization level 49 (32.5%)
Other level 4 (2.6%)
The size:
Micro size (1-10 employees) 35 (23.2%)
Small size (11-50 employees) 52 (34.4%)
Middle size (51-250 employees) 37 (24.5%)
Large size (>250 employees) 27 (17.9%)
Who performs test automation:
In-house test team 95 (62.9%)
Outsourced test team 29 (19.2%)
Developers 76 (50.3%)
Other 11 (7.3%)
% of automated test cases:
<10% 31 (20.5%)
10-50% 46 (30.5%)
50-90% 33 (21.9%)
>90% 16 (10.5%)
We don’t know 8 (5.3%)
We don’t measure 17 (11.3%)
ab
Software development lifecycle:
Agile: 137 90.7%
Scrum 98 (64.9%)
Kanban 48 (31.8%)
Scaled Agile Framework 25 (16.6%)
Feature Driven Development 17 (11.3%)
Test-Driven Development 16 (10.6%)
Behavior-Driven Development 7 (4.6 %)
Lean Software 11 (7.3%)
eXtreme Programming 6 (4.0%)
DevOps 43 (28.5%)
Traditional: 39 (25.8% )
Rational Unified Process 5 (3.3%)
Waterfall or waterfall like 34 (22.5%)
Other: 6 ( 4.0% )
a
Note that some organizational units are adopting several software de-
velopment models.
b
The classification of software development lifecycle models was no-
ted in Section 3
confirmed that they have over 90% of automated test
cases.
With regard to the software development lifecycle,
agile is almost universally adopted (137 out of 151
responses). About one-third (N=43) of the responses
reported that they use DevOps. Almost all (42 out of
43 responses) combine the adoption of DevOps with
Agile models. For the traditional approach, one-fifth
(N=34) of the responses stated that they follow a water-
fall model, where 12 of them only follow this model.
Several mentioned that Rational Unified Process is
adopted.
ICSOFT 2020 - 15th International Conference on Software Technologies
32
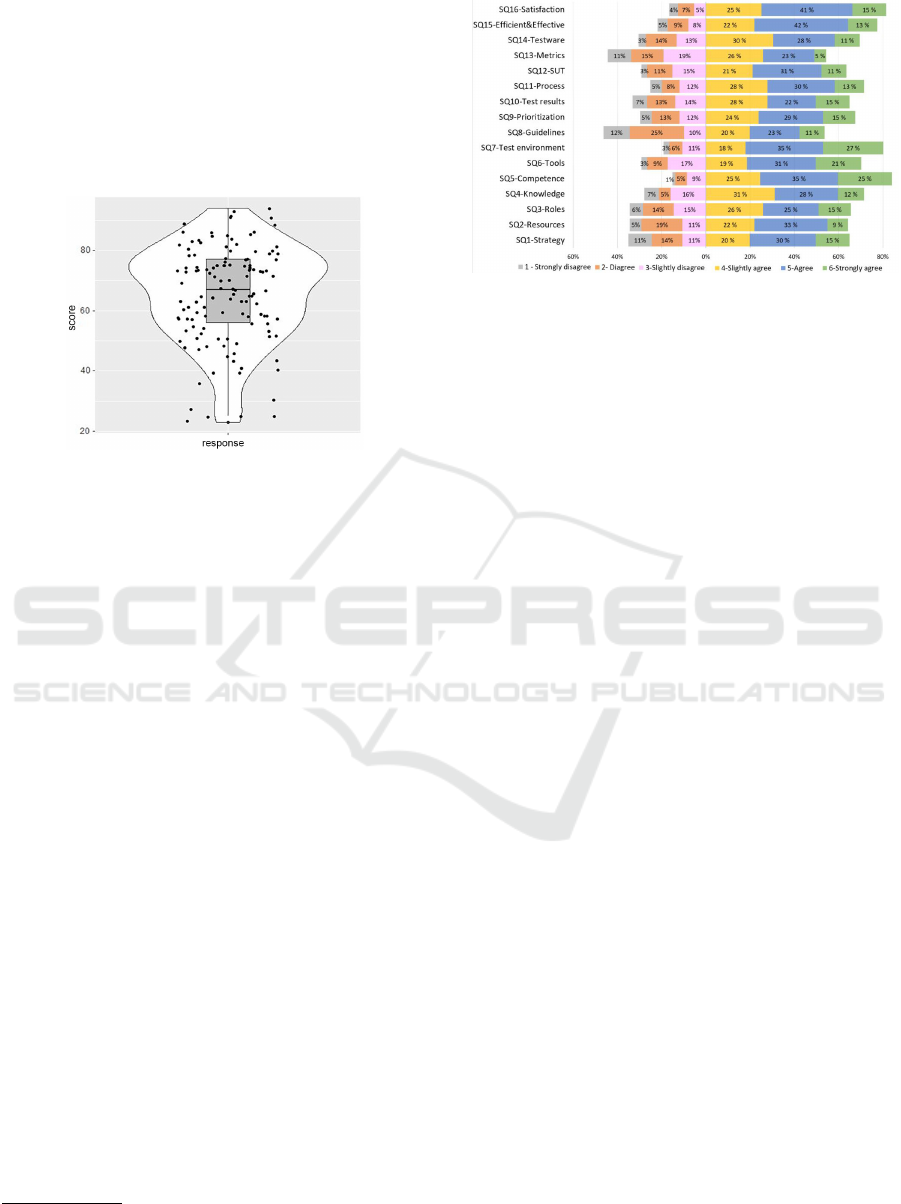
RQ1 – Process Maturity.
Figure 1 shows a violin
plot with jittered dots
1
to visualize the distribution of
total maturity scores of responses on test automation
maturity questions in part 2 of our survey. One can
see from this plot, the level of test automation maturity
in different organizational units of respondents was
differentiated by their maturity scores, i.e., from the
Minimum(23) to the Maximum (94).
Figure 1: Overview of maturity scores of responses.
The violin is skewed to the top, peaking around the
interquartile range (IQR), aka. the midspread, from
56 to 77. One can see that the range of IQR is still
distant from both the Minimum (23) and Maximum
(94). This implies that many test automation processes
are relatively mature but there is the potential for the
further improvement.
Several jittered dots above the score of 90 suggest
that some response scores fairly close to the maximal
points to be awarded (96) in the survey. This implies
that some have reached a self-acclaimed high level of
test automation maturity. In contrast, many dots are
scattered in the first quartile, and there are several dots
below the score of 30 in the violin. There is the long
distance between those dots and the Maximum. These
results imply that some are still very far from being
mature, and there is plenty of room for improvement.
RQ2 – Practice Maturity.
Figure 2 shows the
overview of responses to test automation maturity
questions in part 2 of our survey. Agreed responses
(i.e., who rate 4-6 from slightly agree to strongly agree)
are stacked to the right of a vertical baseline on ‘0%’
on the x-axis. Disagreed responses (i.e., who rate 1-3
from strongly disagree to strongly agree) are stacked
to the left of the same baseline. Note that since ‘no
answer’ exists for a certain survey question, the to-
tal percentage of all agreed responses and disagreed
responses may be not equal to 100%.
1
Violin plot - jitter https://www.tutorialgateway.org/r-
ggplot2-jitter/
Figure 2: Survey responses on maturity questions.
The percentage of agreed responses on each ques-
tion is in the range of 54% (N=82) to 85% (N=128).
It may be noted that the situation is quite diverse with
respect to different practices. We further compared
the percentage of agreed responses and disagreed re-
sponses, in order to know which practices are more
mature and immature in the industry:
‘SQ5-Competence’ has the largest percentage
(85%) of agreed responses, suggesting that, 85% of
responses agreed that their test team has enough exper-
tise and technical skills for test automation. Besides,
‘SQ7-Test environment’ and ‘SQ16-Satisfaction’ also
have more than 80% agreed responses. This indicates
that the majority of responses agreed that they have
the control over configuration of their test environ-
ment, and their automated tests can meet the given test
purposes and bring substantial benefits.
‘SQ8-Guidelines’ has the largest percentage (47%)
of disagreed responses. This suggests that there is lack
of guidelines on designing and executing automated
tests in general. In the free-text answers, 5 respondents
highlighted the difficulty in defining such guidelines.
It is followed by ‘SQ13-Metrics’, which has 45% dis-
agreed responses. This means that many still do not
have the right metrics to measure and improve test au-
tomation processes. 3 respondents indicated the lack
of right metrics in the free text answers.
RQ3 – Practice Correlation.
Figure 3 is a corre-
lation plot that shows KR correlation coefficient
r
k
values between each pair of test automation maturity
questions in part 2 of our survey. As indicated by
the color key, more negative values are represented
by more dark red color and more positive values are
represented by more dark blue. The number inside the
color key represents the r
k
.
As shown in the correlation plot,
r
k
ranges in val-
ues from 0.24 to 0.60. This indicates that adopted best
practices are positively correlated with another in ei-
ther the strong, moderate, or weak relationship. The
Software Test Automation Maturity: A Survey of the State of the Practice
33
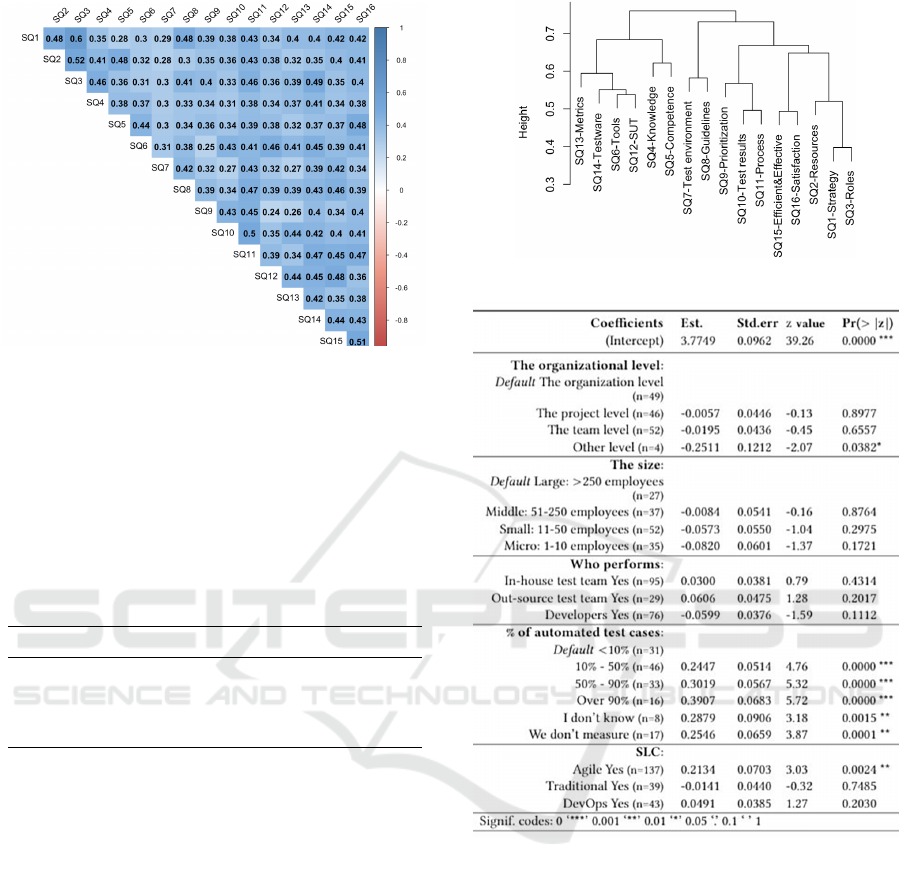
Figure 3: Correlation matrix.
number of pairs of survey questions having a moderate
relationship (r
k
=.30-.49) is largest.
Table 9 lists the pairs of survey questions that have
a strong correlation (
r
k
>
.50). PS01 has the highest
r
k
= .60. This shows that the strongest correlation ex-
ists between the practices to define ‘test automation
strategy’ and ‘the roles and responsibilities of stake-
holders’.
Table 9: The strong correlation group.
Ref. The pair r
k
PS01 ‘SQ1-Strategy’-‘SQ3-Roles’ .60
PS02 ‘SQ2-Resources‘-‘SQ3-Roles’ .52
PS03 ‘SQ15-Efficient&Effective’-‘SQ16-Satisfaction’ .51
PS04 ‘SQ10-Test results’-‘SQ11-Process’ .50
Figure 4 is a plot that shows the hirarchical clus-
tering results based on
r
k
-based distance of test au-
tomation maturity questions in part 2 of our survey.
Multiple test automation maturity questions clustered
at lower Height (H) meaning that the practices (men-
tioned in those questions) have the close correlation.
The number of clusters was identified to illustrate dif-
ferent types of practices that have the close correlation.
There is the close correlation among test manage-
ment related practices. This can be seen from Figure 4,
‘SQ2-Resources’ joints PS01 (‘SQ1-Strategy’-‘SQ3-
Roles’) with H
≈
.55. Besides, some technical related
practices also are closely clustered. ‘SQ14-Testware’
joins the pair (‘SQ6-Tools’-‘SQ12-SUT’) with H
≈
.55.
One can see that ‘SQ9-Prioritization’ joints the pair
PS04 (‘SQ10-Test results’-‘SQ11-Process’) at H
≈
.55.
RQ4 – Organizational Factors.
Figure 5 shows the
NB regression model for RQ4. One can see some
characteristics of organizational units are related to
Figure 4: Cluster dendrogram.
Figure 5: NB regression model 1.
test automation maturity:
Test automation processes managed in the organi-
zation level tend to be associated with the higher level
of maturity. This can be seen from Figure 5, ‘the or-
ganization level’ was coded as the default, while other
levels have a coefficient in the range of -0.0057 to -
0.2511. However, the differences among those levels
may be not statistically significant, since each level
has p-value > 0.05.
Larger organizational units appear to be associated
with the higher level of test automation maturity, ac-
cording to coefficients of the size variable. The default
is ‘Large’. ‘Middle’, ‘Small’, and ‘Micro’ have a coef-
ficient - 0.0084, - 0.0573, - 0.0820 respectively. The
result is consistent with the predication for the orga-
nizational level variable, which indicates that test au-
ICSOFT 2020 - 15th International Conference on Software Technologies
34
tomation processes managed at the organization level
tend to be more mature. However, as each of size
variable has a p-value
>
0.05, the differences among
the sizes of organizational units are not statistically
significant.
Test automation processes performed by develop-
ers may be associated with the lower level of maturity.
Regarding to ‘Who performs (test automaton)’ related
variables, ‘Developer Yes’ is the only one has a nega-
tive coefficient -0.0599. ‘In-house test team Yes’ and
‘Out-source test team Yes’ have a positive coefficient
0.0300 and 0.0606 respectively. However, again the
differences among ‘who performs (test automation)’
options are not statistically significant, as the absence
of significant codes in each variable.
The higher percentage of automate test cases is
significantly associated with the higher level of test
automaton maturity. ‘
< 10%
’ was coded as the de-
fault. ‘10%-50%’, ‘50%-90%’, and ‘over 90%’ have
a coefficient 0.2447, 0.3019, and 0.3907 respectively.
A coefficient of ‘10%-50%’ is less than a coefficient
of 50%-90%’, which is less than a coefficient of‘over
‘90%’. Nevertheless, all ‘10%-50%’, 50%-90%’, and
‘over ‘90%’ have a p-value = 0.0000, suggesting the
significant association.
Test automation processes that follow the modern
software development model Agile and DevOps tend
to reach the higher level of maturity, compared to the
ones following traditional Waterfall and Rational Uni-
fied Process models. ‘Agile Yes’ and ‘DevOps Yes’
have a positive coefficient 0.2134 and 0.0491 respec-
tively, while ‘Traditional Yes’ has a negative coeffi-
cient -0.0141. The presence of significant code ‘**’ for
‘Agile Yes’ confirms that the adoption of Agile meth-
ods is significantly associated with the higher level of
test automation maturity. Besides, almost the all (42
out of 43) adopt the DevOps combined with Agile, as
noted in Section 4. This means that combining the
adoption of DevOps and agile is associated with the
higher level of test automation maturity than adopting
agile alone.
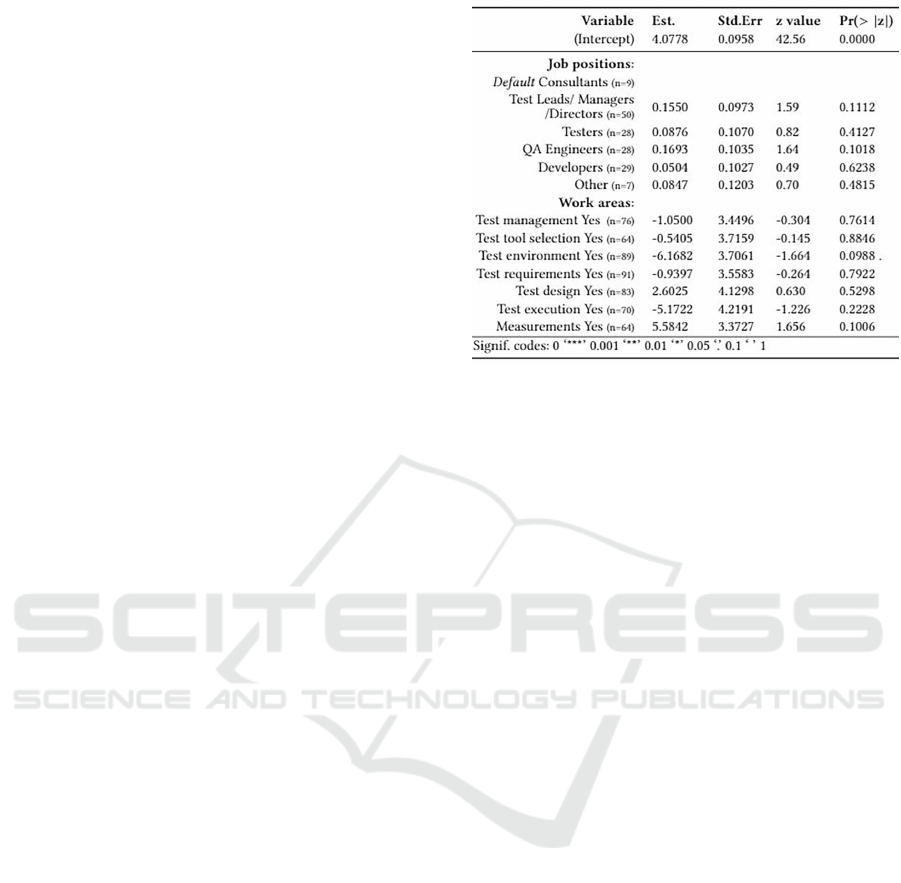
RQ5 – Response Variation.
Figure 6 is a NB re-
gression model for ‘RQ5 – Response Variation’. It
illustrates that the response variation among practition-
ers with different roles are explicable:
Consultants are likely to give the most pessimistic
answers. Referring to the job position variable, one
can see that compared to the default ‘Consultants’,
others have a positive coefficient in the range of 0.0876-
0.1693.QA engineers tend to give the most optimistic
answers, since ‘QA Engineers’ has a highest-positive
coefficient 0.1693.
Practitioners work in Test environment and Test
Figure 6: NB regression model 2.
execution KPAs provide the most pessimistic answers.
The ‘Test environment Yes’ variable has a lowest neg-
ative coefficient -6.1682. This is followed by ‘Test
execution Yes’ variable that has a coefficient -5.1722.
The other work areas related variables have a coeffi-
cient greater than -1.0500, which is distant from them.
The more optimistic answers are provided by prac-
titioners working in Test design and Measurements
KPAs. ‘Test design Yes’ and ‘Measurements Yes’
have a coefficient of 2.6025 and 5.5842, while others
have the negative one from -0.61682 to -0.5405. The
variable ‘Measurements Yes’ has the greatest positive
coefficient, suggesting that practitioners work in the
measurements KPA tend to give the most optimistic
answers.
The above results indicate that the current roles
(regarding to job positions and work areas) of practi-
tioners may lead to the response variation, but they are
not statistically significant (p-value>0.05).
5 DISCUSSION
We summarize survey results to each research question
and discuss their implications.
RQ1 – Process Maturity.
Referring to the result
of RQ1, the level of test automation maturity in re-
spondent organizations is differentiated by the prac-
tices they adopt. Some test automation processes
are more mature than others based on adopted prac-
tices. This study result is aligned with the finding
of ISTQB’s recent Worldwide Software Testing Prac-
tices Report ISTQB (2018), which surveyed thousands
of test practitioners in the world. This report states
that the level of test automation maturity may vary
Software Test Automation Maturity: A Survey of the State of the Practice
35

from one to another among organizations since test au-
tomation practices they performed are different. This
indicates that there are potentials to further improve
some test automaton processes, especially for the ones
that are far from being mature, by performing recom-
mended mature practices.
RQ2 – Practice Maturity.
In our survey, most of
responses agreed that their test team has enough exper-
tise and technical skills for test automation, have the
control over the configuration of their test environment,
and they create automated tests to meet the given test
purposes and bring substantial benefits. Those results
are partially opposite with the World quality report
2018-19 (Capgemini et al., 2018), which noted that
the present industry performs immature practices to
set up test environment and cultivate test automation
expertise and skills of test teams. The possible reason
could come from the differences in survey setup and
respondents. Besides, based on our survey responses,
there is lack of guidelines on designing and executing
automated tests and the right metrics to measure and
improve test automation processes in general. We be-
lieve that those immature practices perceived by the
practitioners are example gaps between academia and
industry and need to be addressed. They point out
important future research topics:
• Guidelines:
What guidelines should be provided
to test practitioners for designing and executing
automated tests, so that the development and main-
tenance effort will be minimal.
• Test Automation Metrics:
What are the most im-
portant test automation metrics, how to find right
test automation metrics, why the one thinks its
current test automation metrics are not right.
RQ3 – Practice Correlation.
Pocatilu (2002) indi-
cates that “test automation practices are interdepen-
dence and consecutive, as each type of practice may
result in intermediate deliveries to be used by others”.
By extending his research, we confirmed that all test
automation practices are positively correlated in prac-
tical context. The description to some test automation
practices in his research could explain some clusters
of practices in our study :
•
A cluster of test management related practices
(SQ1-Strategy-SQ3-Roles-SQ2-Resources): Test
automation strategy defines action steps that will
be performed to allocate resources and define roles
and responsibility of stakeholders.
•
A cluster of technical related practices (SQ6-Tools-
SQ12-SUT-SQ14-Testware): the use of suitable
test tools may be helpful to create the maintainable
testware and test automation testability features
into a SUT.
Based on above discussion, we argue that, for prac-
titioners, it is important to pay attention to the ripple
effect of different practices, especially for the ones that
are strongly correlated and closely clustered. Lack of
any necessary practices may harm their test automaton
maturity.
RQ4 – Organizational Factors.
We found that the
high level of test automation maturity achieved in orga-
nizational units, which are managed at the organization
level with large size, have in-house test team or/and
out-source test team, automate the high percentage
of test cases, and follow the modern software devel-
opment model Agile and/or DevOps. Those results
suggest that organization factors may affect test au-
tomation maturity. Some factors like percentage of
automated cases and the adoption of agile and DevOps
have been examined by prior research (Garousi and
Mäntylä, 2016). We argue that the rest also should
be studied. By identifying them and understanding
their impact can help organizations to better use and
implement test automation in the organizations.
RQ5 – Response Variation.
The results of RQ5
confirmed that the roles of respondents may lead to
the response variation in our survey. The previous
study (Wang et al., 2019) pointed the response varia-
tion is likely to introduce the bias to assessment results
of test automation maturity. Consequently, we believe
that, when assessing test automation maturity of an
organization, it is necessary to involve practitioners
with different roles to avoid the assessment bias. How-
ever, as our survey was anonymous, it is difficult to
compare the impact of respondents’ roles on the as-
sessment result at a same organization. The further
study is needed to validate what impact each type of
roles has.
6 THREATS TO VALIDITY
The threats to this study and approaches taken to mini-
mize their impact were explored, according to a stan-
dard checklist in software engineering from Wohlin
et al. (2012).
Construct Validity
refers to the extent to which
the study present the theory behind it. To ensure the
construct validity, we developed our survey according
to the prior literature, reviewed it with industry experts,
and did the small-scale piloting before actually exe-
cuting it. The survey was designed and executed by
ICSOFT 2020 - 15th International Conference on Software Technologies
36

following the standard guidelines in software engineer-
ing.
Conclusion Validity
is concerned with the extent
to which correct conclusions are made through obser-
vations of the study. In this study, all the conclusions
to each research question were drawn according to
statistical results and are traceable to raw survey data.
However, since this survey was anonymous and fol-
lowed the GDPR, sharing the raw data of survey is not
allowed.
Internal Validity
focus on how the study really
cause the outcomes. In our study, threats to internal
validity lie in the convenience sampling and survey
execution. The participants from diverse places are
likely to bias the survey results. To avoid that, in the
survey design, we studied main types of response bias
and took the corresponding steps to control them, e.g.,
to avoid social desirability bias, the anonymity of the
responses and result reporting were maintained. We
measured the response quality and removed bad re-
sponses before analyzing and reporting survey results.
External Validity
is concerned with how the study
results can be generalized. Selection bias may be a
threat to external validity of this study. As most re-
sponses were received from Europe, population dif-
ferences should be considered in the generalization of
study results to rest of the world.
7 CONCLUSION
Software organizations should assess and improve
their test automation maturity for continuous improve-
ment. They need a benchmark of the current state of
their test automation processes and practices to iden-
tify improvement steps.
In this paper, we conducted a test automation ma-
turity survey with 151 practitioners coming from more
than 101 organizations in 25 countries. Based on sur-
vey responses, we made several observations about the
state of test automation practice in the present industry
and discussed the implications of study results, see
Section 5.
This study has contributions to both academia and
industry. It can help researchers and practitioners to
understand the state of practice of test automation ma-
turity in the present industry. For the industry side, the
survey in this study and survey results together may
help them to benchmark their test automation maturity
and make the comparison with others in the indus-
try. This would help practitioners to better understand
and conduct test automation processes. On the other
side, our study is connected to the previous literature
and extends the research in this area, as discussed in
Section 5. By reviewing study results, researchers
can find research topics which are interested to both
academia and industry in the research scope of test
automation maturity. Based on the findings we also
suggested some follow-up research topics in this area,
see Section 5.
As a future study, we intend to do in-depth analysis
of other factors that may affect test automation matu-
rity, such as test tools and frameworks, test case design
techniques, etc. We aim to integrate all results to es-
tablish a coherent framework for organizing current
best practices in a validated improvement ladder.
ACKNOWLEDGEMENTS
This study is supported by TESTOMAT Project
(ITEA3 ID number 16032), funded by Business Fin-
land under Grant Decision ID 3192/31/2017.
REFERENCES
Autoine, A., Rabikumer, S., and Christine, B. (2019). Contin-
uous testing report 2019. Technical report, Capgemini.
Capgemini, Sogeti, and Microfocus (2018). World quality
report 2018-19. Technical report.
Cohen, L. H. (1988). Life events and psychological function-
ing: Theoretical and methodological issues, volume 90.
Sage Publications, Inc.
Eldh, S., Andersson, K., Ermedahl, A., and Wiklund, K.
(2014). Towards a test automation improvement model
(taim). In 2014 IEEE Seventh International Confer-
ence on Software Testing, Verification and Validation
Workshops, pages 337–342.
Etikan, I., Musa, S. A., and Alkassim, R. S. (2016). Compar-
ison of convenience sampling and purposive sampling.
American journal of theoretical and applied statistics,
5(1):1–4.
Ganassali, S. (2008). The influence of the design of web
survey questionnaires on the quality of responses. In
Survey research methods, volume 2, pages 21–32.
Garousi, V., Felderer, M., and Hacalo
˘
glu, T. (2017). Soft-
ware test maturity assessment and test process improve-
ment: A multivocal literature review. Information and
Software Technology, 85:16–42.
Garousi, V., Felderer, M., Kuhrmann, M., Herkilo
˘
glu, K.,
and Eldh, S. (2020). Exploring the industry’s chal-
lenges in software testing: An empirical study. Journal
of Software: Evolution and Process.
Garousi, V. and Mäntylä, M. V. (2016). When and what to
automate in software testing? a multi-vocal literature
review. Information and Software Technology, 76:92–
117.
Ghazi, A. N., Petersen, K., Reddy, S. S. V. R., and Nekkanti,
H. (2018). Survey research in software engineering:
Software Test Automation Maturity: A Survey of the State of the Practice
37

Problems and mitigation strategies. IEEE Access,
7:24703–24718.
ISTQB (2018). Worldwide software testing practices survey
2017-18. Technical report.
Kasurinen, J., Taipale, O., and Smolander, K. (2010). Soft-
ware test automation in practice: empirical observa-
tions. Advances in Software Engineering, 2010.
Kitchenham, B. and Pfleeger, S. L. (2002). Principles of
survey research: part 5: populations and samples. ACM
SIGSOFT Software Engineering Notes, 27(5):17–20.
Koomen, T., Broekman, B., van der Aalst, L., and Vroon, M.
(2013). TMap next: for result-driven testing. Uitgeverij
kleine Uil.
Linåker, J., Sulaman, S. M., Maiani de Mello, R., and Höst,
M. (2015). Guidelines for conducting surveys in soft-
ware engineering.
Litwin, M. S. (1995). How to measure survey reliability and
validity, volume 7. Sage.
Mitchel, H. K. (1994). Software : A maturity model for
automated software testing.
Noll, J. and Beecham, S. (2019). How agile is hybrid ag-
ile? an analysis of the helena data. In International
Conference on Product-Focused Software Process Im-
provement, pages 341–349. Springer.
Nulty, D. D. (2008). The adequacy of response rates to online
and paper surveys: what can be done? Assessment &
evaluation in higher education, 33(3):301–314.
Pocatilu, P. (2002). Automated software testing process.
Economy Informatics, 1:97–99.
Puth, M.-T., Neuhäuser, M., and Ruxton, G. D. (2015). Ef-
fective use of spearman’s and kendall’s correlation co-
efficients for association between two measured traits.
Animal Behaviour, 102:77–84.
Rafi, D. M., Moses, K. R. K., Petersen, K., and Mäntylä,
M. V. (2012). Benefits and limitations of automated
software testing: Systematic literature review and prac-
titioner survey. In Proceedings of the 7th International
Workshop on Automation of Software Test, pages 36–42.
IEEE Press.
Rodrigues, A. and Dias-Neto, A. (2016). Relevance and
impact of critical factors of success in software test
automation lifecycle: A survey. In Proceedings of the
1st Brazilian Symposium on Systematic and Automated
Software Testing, page 6. ACM.
Sauer, J., Chavaillaz, A., and Wastell, D. (2016). Expe-
rience of automation failures in training: effects on
trust, automation bias, complacency and performance.
Ergonomics, 59(6):767–780.
Sjøberg, D. I., Hannay, J. E., Hansen, O., Kampenes, V. B.,
Karahasanovic, A., Liborg, N.-K., and Rekdal, A. C.
(2005). A survey of controlled experiments in software
engineering. IEEE transactions on software engineer-
ing, 31(9):733–753.
Virmani, M. (2015). Understanding devops & bridging the
gap from continuous integration to continuous delivery.
In Fifth International Conference on the Innovative
Computing Technology (INTECH 2015), pages 78–82.
IEEE.
Walia, M., Gupta, A., and Singla, R. K. (2017). Improve-
ment in key project performance indicators through
deployment of a comprehensive test metrics advisory
tool. International Journal of Advanced Research in
Computer Science, 8(5).
Wang, Y. (2018). Test automation maturity assessment. In
2018 IEEE 11th International Conference on Software
Testing, Verification and Validation (ICST), pages 424–
425. IEEE.
Wang, Y., Mäntylä, M., Eldh, S., Markkula, J., Wiklund,
K., Kairi, T., Raulamo-Jurvanen, P., and Haukinen, A.
(2019). A self-assessment instrument for assessing test
automation maturity. In Proceedings of the Evaluation
and Assessment on Software Engineering, pages 145–
154. ACM.
Wohlin, C., Runeson, P., Höst, M., Ohlsson, M. C., Reg-
nell, B., and Wesslén, A. (2012). Experimentation in
software engineering. Springer Science & Business
Media.
ICSOFT 2020 - 15th International Conference on Software Technologies
38
