
Community-governed Services on the Edge
Jo
˜
ao Mafra, Francisco Brasileiro and Raquel Lopes
Department of Computing and Systems, Federal University of Campina Grande, Campina Grande, Brazil
Keywords:
Edge-computing, Community, Analytics, Privacy.
Abstract:
The popularization of resource-rich smartphones has enabled a wide range of new applications to emerge.
Typically, these applications use a remote cloud to process data. In many cases, the data processed (or part of
it) is collected by the users’ devices and sent to the cloud. In this architecture, the external cloud provider is the
sole responsible for defining the governance of the application and all its data. This is not satisfactory from the
privacy viewpoint, and may not be feasible in the long run. We propose an architecture in which the service is
governed by the users of a community who have a common problem to solve. To make it possible, we use the
concepts of Participatory Sensing, Mobile Social Networks (MSN) and Edge Computing, which enable data
processing closer to the data sources (i.e. the users’ devices). We describe the proposed architecture and a
case study to assess the feasibility and quality of our solution compared with other solutions already in place.
Our case study uses simulation experiments fed with real data from the public transport system of Curitiba,
a city in the South of Brazil with a population of approximately 2 million people. The results show that our
approach is feasible and can potentially deliver quality of service (QoS) similar or close to the QoS delivered
by current approaches that require the existence of a central server.
1 INTRODUCTION
In the last years we reached the statistics of having
more mobile phones than toothbrushes on Earth. Be-
ing connected all the time is the new order. A mo-
bile phone is a processing and communication gad-
get used to inform, guide, entertain and, sometimes,
make phone calls. Mobile phones are smart, equipped
with all the capabilities of a small personal computer.
Moreover, a smart phone is a mobile asset of sensors,
such as GPS (Global Positioning System), ambient
light sensors and microphones, just to mention a few
of the commonly available sensors. With these small
computers around and online all the time, there is a
great variety of applications already in place, leverag-
ing their capabilities.
In 2006 the concept of participatory sensing has
arisen (Burke et al., 2006). Years later, this concept
took a new dimension, when the sensing capabilities
worked in association with Mobile Social Networks
(MSN) (Guo et al., 2014). This new way of develop-
ing software exploits the mobile devices (not limited
to mobile smartphones) to gather, analyze and share
local knowledge. In particular, participatory sensing
and crowd sensing can be performed by the final users
to achieve a common goal. For example, GreenGPS,
relies on participatory sensing data to map fuel con-
sumption on city streets, allowing drivers to find the
most fuel efficient routes for their vehicles between
arbitrary end-points (Ganti et al., 2010). Many ap-
plications like that came to live (Reddy et al., 2010;
Ludwig et al., 2015; Predi
´
c et al., 2013), all of them
exploiting the participatory and opportunistic sensing
capabilities of mobile devices.
All of these applications have more in common
than the collaborative data gathering. The participants
that feed the system with data are engaged by a com-
mon goal which is achieved by collaboration. Appli-
cations are built, advertised and, after that, interested
users join them, gathering data in a collaborative way
and, eventually, using the applications to fulfill their
own needs. Moreover, these applications are hosted
in cloud infrastructures, and, thus, require some sort
of sponsorship, management and technical support to
operate them.
In the last decade we have also seen the emergence
of machine learning and other artificial intelligence
(AI) techniques to extract useful predictions/answers
from raw data. When these techniques are used by
mobile applications, data is collected collaboratively,
and sent to a central server where the machine learn-
ing models are trained. Again, there is a need for
sponsorship and technical support, since the global
model is hosted in the cloud.
498
Mafra, J., Brasileiro, F. and Lopes, R.
Community-governed Services on the Edge.
DOI: 10.5220/0009765804980505
In Proceedings of the 10th International Conference on Cloud Computing and Services Science (CLOSER 2020), pages 498-505
ISBN: 978-989-758-424-4
Copyright
c
2020 by SCITEPRESS – Science and Technology Publications, Lda. All rights reserved

Quite often, the data collected by mobile applica-
tions is sensitive, thus, leading to privacy issues. Fed-
erated learning (Bonawitz et al., 2019) has been pro-
posed as a new architecture to build machine learn-
ing models and address the privacy concerns of users.
By using the federated learning techniques, AI mod-
els are built independently in the users’ devices and
then merged with the global model that is located in
the cloud.
In summary, participatory sensing, mobile social
networks and federated learning are useful frame-
works that allow shared knowledge to be built on top
of raw data that is collaboratively gathered. How-
ever, all of them need a (logically) centralized hosting
server where the back-end application runs (usually
in the cloud). The client-server architecture brings to
this scenario a single point of failure. Notice that we
are not concerned with hardware and software failures
that can be, with relative ease, addressed by employ-
ing a number of mature replication strategies. Here
our focus is on issues such as a provider running
out of business or simply deciding to stop supporting
the service, unilateral changes on usage policies, etc.
Moreover, the fact that all data is held by this single
entity may raise issues on privacy, and data misuse.
Hereafter, we refer to all these issues as the need for
external governance.
External governance takes from the community
the right of deciding how the data is shared, where
it is stored, and when and by whom it is used. Also,
it requires extra resources and some sort of techni-
cal support (and associated cost) to manage the back-
end application located in the cloud. In this paper we
present community-governed services, which is an al-
ternative way to provide data analytic services to a
community of users with common goals.
In a community-governed service individuals are
in need for a specific service whose quality will be
better if they share data. Users are connected by a Mo-
bile Social Network (MSN) in which individuals have
similar interests. Driven by their shared interest, they
exchange data among themselves so they can make
better decisions. For example, neighbors can share
data from the neighborhood gathered by their mobile
in order to have an updated report about the air of the
neighborhood where their beloved ones live. Users in
a large and enclosed environment, such as a shopping
center, may be interested in places with less noise pol-
lution, and can resort to data collectively gathered to
spot those places (Ruge et al., 2013).
Community-governed services exploit the partic-
ipatory sensing idea, however limiting the data ex-
change to the trusted partners in the social network,
and excluding third party services such as cloud
providers. In order to do that, community-governed
services follow a peer-to-peer (P2P) architecture: data
is generated and processed at the edge of the network
without the need to be transferred to the cloud to be
processed. The community-governed services use the
processing power of the edge devices themselves to
gather, process and store the shared data. Of course,
these devices are limited in terms of processing, stor-
age and energy consumption, and some applications
cannot be built that way, as we discuss in Section 3.2.
Edge computing (Shi et al., 2016) is in the core of
the community-governed services. By edge comput-
ing we mean that the same devices that are collecting
the data are also processing and analyzing it. This
avoids data flooding in the cloud, saves bandwidth
and reduces applications’ latency, providing better
user experience. Our vision of community-governed
services is build on top of pure edge computing tech-
nology; it does not include fog servers, mobile edge
computing servers (Mao et al., 2017) nor VM-based
cloudlets (Satyanarayanan et al., 2009). It is a pure
P2P application build to unite the sensing and com-
puting power of edge computing devices.
The rest of this paper discusses this new service
approach, including application requirements, opera-
tion flow, limitations and a use case analyzed through
simulation experiments fed with real data. The pa-
per is structured as follows. Section 2 reviews related
work. Section 3 describes how we model community-
governed services. Section 4 presents a case study
in the public transportation area. Section 5 describes
materials and methods used in experiments, followed
by results and discussion in Section 6. Finally, con-
clusions are presented in Section 7.
2 RELATED WORK
Community-governed services take advantage of mo-
bile phone sensor capabilities to collect data from the
environment and use it for some purpose in the future.
This feature is known as participatory sensing, and its
seminal idea is well described by Burke et al. (2006).
Mobile crowd sensing is an extension of participa-
tory sensing, which in addition to using data collected
from users’ devices, also uses data made available by
other users from MSN services (Guo et al., 2014).
A wide variety of applications can be built by tak-
ing advantage of the features described above (Ganti
et al., 2010; Reddy et al., 2010; Ludwig et al., 2015;
Predi
´
c et al., 2013; Zhou et al., 2014). All of these
applications provide a service for the good of a com-
munity of users who share a common goal, which
is another important pillar of our idea. However, in
Community-governed Services on the Edge
499

currently available applications, all data gathered by
users and used to provide the service for the com-
munity of users is sent to a remote cloud infrastruc-
ture to be processed. Our solution aims at giving
the complete power to the users who collect, process
and, most importantly, govern their data and applica-
tions without the need for relying on a single service
provider entity, typically hosting the service in a cloud
provider.
The works by Bonomi et al. (2012) and Shi et al.
(2016) address a new paradigm named Edge Comput-
ing. It extends the cloud paradigm by considering re-
sources that reside between end users and the central
cloud, and that provide compute and network services
close to users. VM-based cloudlets (Satyanarayanan
et al., 2009), smart gateways (Aazam and Huh, 2014)
and servers installed in shopping centers and bus sta-
tions (Luan et al., 2015) are some examples of tech-
nologies, cited in the literature, deployed closer to
data sources to perform computational tasks. Our pro-
posed service uses a completely distributed version of
the edge computing paradigm, in which processing is
done on the devices themselves, which also act as data
sources, with no centralized component.
Community-governed services assume users can
meet and share data with whom they trust, thus
forming an MSN (Miluzzo et al., 2008), coupled
with a P2P architecture that allows users’ devices to
be both data consumers (clients) and data providers
(servers) (Tsai et al., 2009).
The idea proposed by Bellavista et al. (2018) com-
bines some of the characteristics mentioned above,
like crowd sensing and edge computing paradigm, but
it focuses on forming an ad hoc network with the de-
vices of users of a community in an opportunistic way.
The application monitors regions and detects points
whose concentration of people is sufficient to form a
network. However, it does not investigate the feasi-
bility of building the type of services that we propose
in this paper.
Kuendig et al. (2019) suggest a community-driven
architecture that gets together devices within a zone
of local proximity to form a collaborative edge com-
puting environment in a dynamic mesh topology. Our
proposal, in addition to using community users’ de-
vices to process tasks, also addresses the collection
and sharing of data among these users, who have
some common goal to be achieved.
In order to check the feasibility and efficacy of the
community-governed services on the edge, we car-
ried out a simulation-based case study fed with real
data. This application aims at estimating the actual
departure times of urban buses using past data col-
lected by users. A similar application can be seen in
the work by Zhou et al. (2014), where users of a com-
munity have a common goal of anticipating the bus
arrival time. For this purpose they use their mobiles
phones to collect information while on the move, and
thus help in performing predictions. In addition to
past information, they also use real-time information.
However, the application defined in that work uses a
remote cloud as the back-end, while our proposal is
based purely upon edge computing principles.
3 COMMUNITY-GOVERNED
SERVICES MODEL
A community of users has a common goal and will
harness the power of its own edge devices to collect
and process the data collected. Between data collec-
tion and processing, users can share the data collected
with trusted users in the same community.
Since everything is done at the edge of the net-
work, the need for a third party (logically) centralized
server running at a cloud provider is obviated. It in-
creases the robustness of the service by removing the
centralized single point of failure represented by the
server running in the cloud, eliminates the bottleneck
in the communication with the centralized server, and
most importantly, allows the community of users to
jointly define and manage the governance of the ser-
vice, which among other things mitigates privacy is-
sues.
3.1 System Model
The system is composed by a number of personal de-
vices running the community-governed service. The
users utilize the service agent running in their devices
to both collect and share data in a participatory sens-
ing way, and query the service. The service agent that
runs at each personal device is illustrated in Figure 1.
It consists of six modules: participatory sensor, com-
munity sensor, community data collector, community
data filter, model builder and query dispatcher.
The participatory sensor component is responsi-
ble for collecting data in the vicinity of the device.
The community sensor component takes care of dis-
covering other members of the community. The com-
munity data collector contacts other members of the
community in order to increase the amount of data
that is available locally. The community data fil-
ter component regulates which data should be shared
with other members of the community, in both direc-
tions, i.e. to whom local collected data can be shared,
and from whom data should be requested. The model
builder component is in charge of creating the service
CLOSER 2020 - 10th International Conference on Cloud Computing and Services Science
500
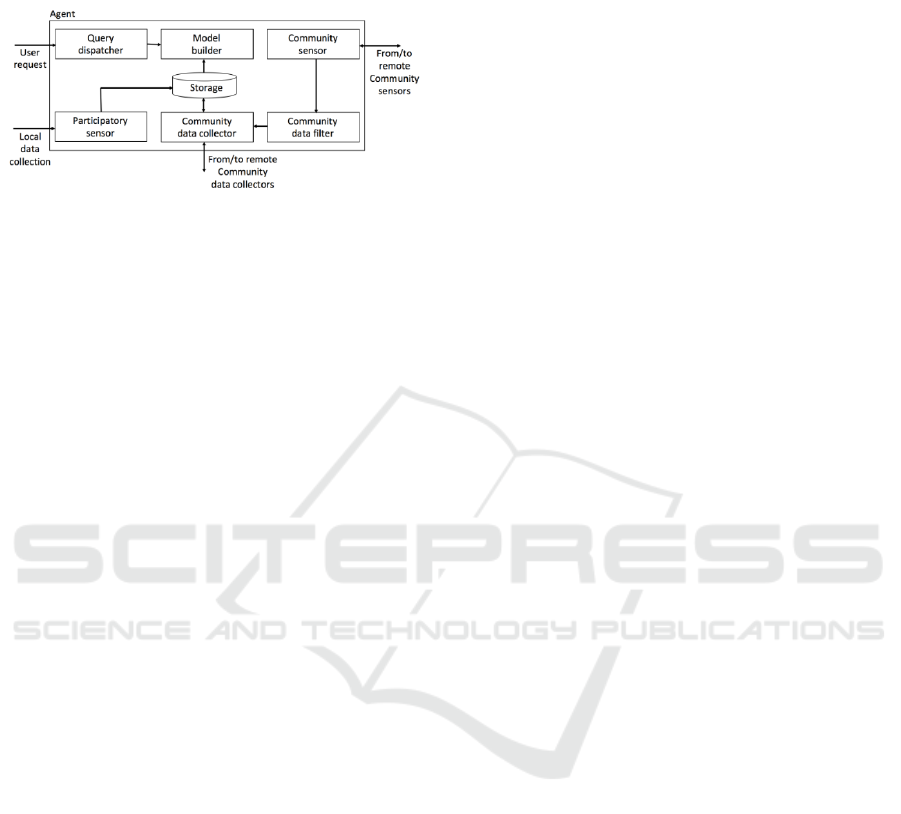
model from all the data collected. Finally, the query
dispatcher provides the interface to the service.
Figure 1: Components of agent.
When a new request is received by the query dis-
patcher component, it uses the model generated by
the model builder component in order to answer the
request. Whenever a new data item is made available
(either by the participatory sensor or the community
data collector), the model builder assesses if a new
model needs to be created. If this is the case, it uses
all the data available to train the new model.
Periodically, the community sensor tries to iden-
tify members that are online. This information is
passed to the community data filter that, in turn, de-
cides to which members local data could be shared
(upon request), and from which other members data
could be requested. The community data collector
contacts other community data collectors obeying the
community data filter decision. Periodically, or upon
the detection of an event of interest, the community
data collector tries to collect data from the accepted
members that are online. When contacted by an ex-
ternal member, the community data collector decides
whether it should provide the data locally stored to the
contacting member.
3.2 Application Requirements
Personal devices of users are able to collect data in a
passive or active way. Besides, these devices connect
to each other at some point in time. This connection
can be through a common local area network, or even
through an Internet connection.
These users share common service interests and
form a community. The creation of the community
allows the users to share the collected data among the
trusted peers (participatory sensing). The services we
are talking about involve data analysis through ana-
lytical and/or machine learning models. We expect
the quality of answers provided by the models to be
proportional to the quantity and diversity of the data
gathered. Thus, the more data is available to users,
the more benefits they can get from the service.
The use of the edge devices to run the community-
governed service, as well as to execute the sensing to
collect data, limits these activities. In other words,
the execution of the service, as well as the sensing
activity must be lightweight, and ideally the battery
consumption due to these activities should be accept-
able to the user. Moreover, data storage consump-
tion should also be low. There are a number of ways
to mitigate the impact of these limitations. For in-
stance, training machine-learning models tend to be a
compute-intensive procedure. This could be executed
only when the device is fully charged, and connected
to the charger. Alternatively, simpler statistical mod-
els can be used to reduce the computation demand
(in our case study we describe one example). Re-
garding data storage, in many cases a sliding-window
approach can be used to throw out data that is old
enough not to be useful.
4 CASE STUDY
In order to shed some light on the feasibility of our
community-governed service model we have con-
ducted a simulation-based case study in the area of
public transportation. The choice of the application
was based on the fact that it fits the characteristics dis-
cussed above, and the availability of real data to feed
our simulation model.
In many cities, urban bus schedules are made pub-
lic and followed in a very strict way. In cities that
use technology in an intensive way, buses can be
equipped with sensors and tracked in real-time using
a cloud-based service, or even using 5G-based solu-
tions (Lohmar et al., 2019), so that unanticipated de-
lays can be spotted, and alternative bus routes can
be chosen. Nevertheless, in many places, especially
in large cities of developing countries, knowing the
actual time that a bus will leave a bus stop can be
difficult. In these places, the timetables provided by
the bus companies are rarely followed, due to many
reasons, including traffic jams, unanticipated main-
tenance, etc. Not knowing the actual bus departure
time can increase wait time at the bus stop, leading
to wasted time and, in more serious situations, can
make passengers susceptible to urban violence. Our
case study is focused on the latter scenario, and on a
particular community of users: students in a big uni-
versity campus.
A large number of college students use public
transportation every week day, to get from home to
the university and back. These students share a com-
mon interest regarding the bus transportation sched-
ule. By forming a community, they can take advan-
tage of their collective mobility pattern, which can be
Community-governed Services on the Edge
501

exploited by a community-governed service. When-
ever they leave the university in a bus, they can collect
information about which bus line was used, and what
time the bus departed from the university. When stu-
dents get back to the university, all the information
they have previously collected is available in their de-
vices. Thus, in this scenario, students that are online
at the campus at the same time are able to share their
collected data following the model described in Sec-
tion 3.1. This data collected and shared is then pro-
cessed and analyzed to satisfy common demands of
this community.
With that in mind, the users’ common goal in
our case study is to estimate the departure time of
buses in a bus line at a university campus, using only
past travel data collected by the university commu-
nity that uses this means of transportation, and eval-
uate how our proposed community-governed service
behaves compared to other scenarios, like a typical
cloud-based service.
5 MATERIALS AND METHODS
5.1 Dataset
We have used public transportation data from Curitiba
city to execute our case study. A brief characteriza-
tion of the data and how it is collected can be seen in
the work by Braz de Oliveira Filho (2019). He used
bus schedule data, raw GPS and smart card records to
reconstruct trips at the passenger-level from the orig-
inal data provided by Curitiba’s Public Transport De-
partment. In the trace rebuilt by Braz, each record
represents a bus travel made by a user. From it, we
can get the bus stop that the bus departed, the time of
departure, and the bus line associated to the bus. An
example of an event in the trace might be a user whose
id is 123456, who left a bus stop near the campus at
8:00 a.m on May 12 using line 500
1
.
From the city map, we have selected the bus stops
that are in the vicinity of our target university campus,
in our case the UTFPR, and consider only the trips
that left or arrived from these bus stops. These trips,
representing a set of arrival and departure events,
were then arranged in chronological order.
Some adaptations to the trace and assumptions
had to be made, so that we could somehow estab-
lished the periods of time when a user was at the cam-
pus. These are signaled by both arrival and departure
events in the trace. For each day and each user in
1
There are more attributes in the original data, but we
just cite the data we use in our model.
the trace, there may be zero or more of such events.
When an arrival event is followed by a departure event
at the same day, then we assume that the user stayed
at the campus for the period comprised between the
arrival time and the departure time. However, if only
a departure event is present, without an earlier arrival
event at the same day, then we arbitrated that the user
had arrived one hour before the time of the departure
event. Similarly, if an arrival event is present with no
later departure event, then we arbitrate that the user
stayed at the campus for one hour since its arrival.
Our adapted trace has information about 74, 907
trips leaving (45, 346) or arriving (29, 561) at bus
stops near the university campus, between May 2017
and July 2017, from 18, 662 different users.
5.2 Simulation Model
Every departure from the campus that appears in the
trace considered generates a request to the service.
Let t
d
be the time of a departure logged in the trace.
We assume that at some time t
r
, prior to t
d
, the user
wants to know the estimated time he/she should leave
the campus, if he/she prefers to take a particular bus
line b. In other words, before leaving the campus at
t
r
, the user asks the service: “at what time should I go
to the bus stop to get the next line b bus leaving the
campus, so that I wait as little as possible at the bus
stop?” We arbitrate the time t
r
when the request is is-
sued to the service as a time that is draw from a time
interval that starts at most one hour before the actual
time of the departure t
d
, following a uniform distribu-
tion. This interval can be smaller than one hour if the
last arrival event of the same user, say t
a
, happened
less than one hour before the departure time.
t
r
= U(max(t
a
, t
d
− 1h), t
d
)
A request that is made at time t
r
asking the estimated
time (t
e
) to go to the bus stop in the vicinity of the
campus in order to get the next bus of line b is denoted
by R
b
t
r
.
Since t
d
is not known to the service, given a re-
quest R
b
t
r
, we use a prediction algorithm that is fed
with the past data available to estimate the most ap-
propriate time for the user to go to the bus stop to
take a bus from line b. The objective of the predic-
tion algorithm is to minimize the wait time at the bus
stop. Since the goal of this paper is not to provide
the best solution for this problem, but rather to under-
stand how the amount of available information impact
the performance of a particular solution, we have cho-
sen a quite simple algorithm, which is in line with the
small footprint required for the service, as discussed
in Section 3.2. We consider an algorithm that simply
CLOSER 2020 - 10th International Conference on Cloud Computing and Services Science
502

recommends the smallest departure time contained in
the past data available (for any previous day) between
time t
r
, when the request was issued, and the next
hour. So, if a user makes a request at 8:05 a.m, the al-
gorithm will get from available historical data all trips
between 8:05 a.m and 9:05 a.m, and recommends the
earliest departure time as the most appropriate one.
(To simplify, we do not take into account the time that
the user needs to walk to the bus stop.)
5.3 Experimental Design
The amount of historical data available to the predic-
tion algorithm depends on how users are assumed to
behave. We consider different configurations for that.
In particular, we consider cases where users do not
share data, neither among themselves, nor with cen-
tralized servers, cases where data is made available
to centralized servers at different points in time, and
cases where data is exchanged among users that are
in the campus at the same time. We present below the
data sharing configurations evaluated in this proof of
concept study:
• Baseline. The baseline configuration is as naive
as possible. It does not use any historical data to
estimate the time to go to the bus stop; it simply
suggests the request time (t
r
) as such time.
• Offline. In this configuration, the model is built
using only trips collected by the user making the
request; it represents the situation in which users
never share their data with other members of the
community.
• Cloud. Here all the collected data is made avail-
able at the very time the data is collected, since
in this case the data is sent to a central cloud; all
data available in the server can be considered by
the prediction algorithm used to answer users’ re-
quests.
• Cloudlet. In this configuration we consider the
existence of a local server in the university cam-
pus that is accessible only when the user is at
the campus; data is made available to this server
whenever a user arrives at the campus (and not at
the time the data was collected, as in the previous
configuration).
• Community. In this case, a user u that is at the
campus at time t will share its data with a user
u
0
, provided that u
0
is also at the campus at time
t, u is willing to share data with u
0
, and u
0
trusts
u as a data provider; in this case, all data that u
has collected until that point in time (directly or
indirectly) will be made available to u
0
; all data
available at a user’s device can be considered by
the prediction algorithm used to answer queries.
Clearly, the amount of data used when processing a
particular request in the offline configuration, except
from unusual corner cases, is less than that used in the
community configuration, which is, in turn, less than
the amount used in the cloudlet configuration, which
is less than what is used in the cloud configuration.
The focus is to evaluate how feasible is to use just the
data available for the community configuration, and
also to compare the accuracy of the estimations done
using these different levels of information available.
Due to lack of space, the only factor of reported
experiments is the data sharing configuration previ-
ously described and we assume that all users trust
each other in community configuration.
5.4 Evaluation Metrics
Our evaluation consists of measuring (i) the quantity
of data available to make the predictions in each sce-
nario evaluated, and (ii) the quality of the predictions
themselves. In order to do that we collect data from
our simulation experiments to compute the following
metrics:
• Proportion of Requests R
b
t
r
that Can be Pre-
dicted using Past Data (PP). As described ear-
lier, the prediction algorithm uses data from past
trips to infer when the next bus of line b will leave
the bus stop. However, there are cases in which
no data is available for the time interval associ-
ated with the request ([t
r
− 1h, t
r
]) — in this case,
the baseline strategy is used, instead. This met-
ric aims at measuring the proportion of requests
whose predictions are done based on past data,
and not on the baseline strategy.
• Data Amount Used to Perform Prediction
(DA). This metric indicates how many past trips
were used to answer a given request. It is mea-
sured in number of trips.
• Wait Time at the Bus Stop (WT). This metric
measures the amount of time that the user waits in
the bus stop, until the next bus arrives. We note
that this bus does not need to be the same whose
departure (at t
a
), registered in the trace, triggered
the request in the first place. This is because the
time the user gets to the bus stop (t
e
, estimated by
the prediction algorithm) can be both earlier than
t
a
— in which case the user might get another bus
from the same line b that left the bus stop after
t
e
and before t
a
—, or later than t
a
— in which
case it is not even guaranteed that there will be a
bus from line b departing at a time later than t
a
.
Community-governed Services on the Edge
503

To avoid having the user waiting indefinitely, we
assume that if the bus does not arrive in as much
as one hour after t
e
, then the user gives up waiting,
and we register the wait time as 1 hour.
• Missing Rate (MR). This metric indicates the
percentage of requests for which users could not
catch a bus. In other words, the percentage of re-
quests R
b
t
r
, such that there is no bus of line b de-
parting at a time t
d
, t
e
≤ t
d
≤ t
e
+ 1h.
The DA metric is reported as the mean value for all the
requests processed in simulations. The WT metric is
reported similarly, but using the median, instead of
the mean. We use the median as the statistic to assess
W T because its distribution is not symmetric, and the
mean may be affected by extreme values.
6 RESULTS AND DISCUSSION
Table 1: Summary of all metrics.
Configuration DA PP MR WT
Baseline 0.0 0.0% 0.008% 5.48 min
Offline 1.3 39.8% 0.366% 5.13 min
Community 51.9 92.6% 0.602% 3.65 min
Cloudlet 53.7 96.0% 0.965% 3.35 min
Cloud 57.1 97.7% 0.882% 3.30 min
Table 1 shows results for DA, PP, MR and WT for
each configuration. In general, the more data is avail-
able (DA), the better the prediction algorithm per-
forms (W T ). Also, the missing rate for all scenarios
simulated is very small, peaking at 0.96% in cloudlet
configuration. Only 40% of requests are answered
based on the past data collected by the user (PP) with
offline configuration. The other 60% of requests re-
sort to the baseline strategy due to lack of data. This
is because half of users make only one request, and
there is no past data collected by them.
These results indicate that the community network
that is formed by the online users is, in general, as
good as the case in which there is a central server to
aggregate all the collected data.
We also measured the difference between the
baseline and all the other configurations. To measure
this difference we pair the same requests in each con-
figuration. Table 2 shows the proportion of requests
in which the wait time was better (i.e. shorter), worse
(i.e. greater) and equal to the baseline configuration.
In configurations with more data available for pre-
diction, the proportion of requests in which the result
was better than the baseline increases. As said be-
fore, the baseline strategy is used in 60% of the re-
quests of the offline configuration. This means that
Table 2: Comparison of wait times between baseline and
the other configurations.
Configuration Better Worse Equals
Offline 23.4% 16.4% 60.2%
Community 77.7% 13.7% 8.6%
Cloudlet 81.0% 13.8% 5.2%
Cloud 83.8% 12.6% 3.6%
for these cases, the offline configuration results are
the same as the baseline. In only 23% of cases we see
better results for the offline configuration. The com-
munity configuration had shorter wait times for more
than 77% of the requests. Cloudlet and cloud config-
urations are better than the baseline in more than 80%
of the cases.
7 CONCLUSIONS
In this paper, we have proposed an architecture in
which individuals from a community come together
to provide some service for themselves by using prin-
ciples of Participatory sensing, Mobile Social Net-
works and Edge Computing. The idea is that mem-
bers of the community will use their devices’ capa-
bilities to gather data, share it with other members
and then process it without having to send it to a re-
mote cloud. This obviates the need for external gov-
ernance for both data and application, as well as pro-
vides more control over who has direct access to the
data collected.
We created a case study in which community
members want to know the departure time of the first
bus of a particular bus line in a 1-hour time frame.
We performed simulations, fed with data from the Cu-
ritiba city public transportation system, to evaluate
the feasibility of the proposed community-governed
model. The results show that the extra data that can
be obtained from the community is enough to pro-
vide a better service when compared with the case that
data is not shared. When privacy is not a concern, the
community-governed service performs as well as one
based on a centralized server, without facing the risks
associated with the need for external governance.
ACKNOWLEDGMENT
This work was supported by the Innovation Cen-
ter, Ericsson Telecomunicacoes S.A., Brazil and by
EMBRAPII-CEEI.
CLOSER 2020 - 10th International Conference on Cloud Computing and Services Science
504

REFERENCES
Aazam, M. and Huh, E. (2014). Fog computing and smart
gateway based communication for cloud of things. In
2014 International Conference on Future Internet of
Things and Cloud, pages 464–470.
Bellavista, P., Chessa, S., Foschini, L., Gioia, L., and Giro-
lami, M. (2018). Human-enabled edge computing:
Exploiting the crowd as a dynamic extension of mo-
bile edge computing. IEEE Communications Maga-
zine, 56(1):145–155.
Bonawitz, K., Eichner, H., Grieskamp, W., Huba, D., Inger-
man, A., Ivanov, V., Kiddon, C., Konecn
´
y, J., Maz-
zocchi, S., McMahan, H. B., Overveldt, T. V., Petrou,
D., Ramage, D., and Roselander, J. (2019). Towards
federated learning at scale: System design. CoRR,
abs/1902.01046.
Bonomi, F., Milito, R., Zhu, J., and Addepalli, S. (2012).
Fog computing and its role in the internet of things. In
Proceedings of the First Edition of the MCC Workshop
on Mobile Cloud Computing, MCC ’12, pages 13–16,
New York, NY, USA. ACM.
Burke, J., Estrin, D., Hansen, M., Parker, A., Ramanathan,
N., Reddy, S., and Srivastava, M. B. (2006). Participa-
tory sensing. In In: Workshop on World-Sensor-Web
(WSW’06): Mobile Device Centric Sensor Networks
and Applications, pages 117–134.
de Oliveira Filho, T. B. (2019). Inferring passenger-level
bus trip traces from schedule, positioning and tick-
eting data: methods and applications. Master dis-
sertation, Universidade Federal de Campina Grande,
Para
´
ıba, Brasil.
Ganti, R. K., Pham, N., Ahmadi, H., Nangia, S., and Ab-
delzaher, T. F. (2010). Greengps: A participatory
sensing fuel-efficient maps application. In Proceed-
ings of the 8th International Conference on Mobile
Systems, Applications, and Services, MobiSys ’10,
pages 151–164, New York, NY, USA. ACM.
Guo, B., Yu, Z., Zhou, X., and Zhang, D. (2014). From par-
ticipatory sensing to mobile crowd sensing. In 2014
IEEE International Conference on Pervasive Com-
puting and Communication Workshops (PERCOM
WORKSHOPS), pages 593–598.
Kuendig, S. J., Rolim, J., Angelopoulos, K. M., and Hos-
seini, M. (2019). Crowdsourced edge: a novel net-
working paradigm for the collaborative community.
Technical report. ID: unige:114607; Paper submitted
for publication at the Global IoT Summit 2019.
Lohmar, T., Zaidi, A., Olofsson, H., and Boberg, C. (2019).
Driving transformation in the automotive and road
transport ecosystem with 5G. Ericsson Technology
Review.
Luan, T. H., Gao, L., Li, Z., Xiang, Y., and Sun, L. (2015).
Fog computing: Focusing on mobile users at the edge.
CoRR, abs/1502.01815.
Ludwig, T., Reuter, C., Siebigteroth, T., and Pipek, V.
(2015). Crowdmonitor: Mobile crowd sensing for as-
sessing physical and digital activities of citizens dur-
ing emergencies. In Proceedings of the 33rd Annual
ACM Conference on Human Factors in Computing
Systems, CHI ’15, pages 4083–4092, New York, NY,
USA. ACM.
Mao, Y., You, C., Zhang, J., Huang, K., and Letaief, K. B.
(2017). A survey on mobile edge computing: The
communication perspective. IEEE Communications
Surveys Tutorials, 19(4):2322–2358.
Miluzzo, E., Lane, N. D., Fodor, K., Peterson, R., Lu, H.,
Musolesi, M., Eisenman, S. B., Zheng, X., and Camp-
bell, A. T. (2008). Sensing meets mobile social net-
works: The design, implementation and evaluation of
the cenceme application. In Proceedings of the 6th
ACM Conference on Embedded Network Sensor Sys-
tems, SenSys ’08, pages 337–350, New York, NY,
USA. ACM.
Predi
´
c, B., Yan, Z., Eberle, J., Stojanovic, D., and Aberer,
K. (2013). Exposuresense: Integrating daily activi-
ties with air quality using mobile participatory sens-
ing. In 2013 IEEE International Conference on Per-
vasive Computing and Communications Workshops
(PERCOM Workshops), pages 303–305.
Reddy, S., Shilton, K., Denisov, G., Cenizal, C., Estrin,
D., and Srivastava, M. (2010). Biketastic: Sensing
and mapping for better biking. In Proceedings of the
SIGCHI Conference on Human Factors in Computing
Systems, CHI ’10, pages 1817–1820, New York, NY,
USA. ACM.
Ruge, L., Altakrouri, B., and Schrader, A. (2013). Sound-
ofthecity - continuous noise monitoring for a healthy
city. In 2013 IEEE International Conference on Per-
vasive Computing and Communications Workshops
(PERCOM Workshops), pages 670–675.
Satyanarayanan, M., Bahl, V., Caceres, R., and Davies, N.
(2009). The case for vm-based cloudlets in mobile
computing. IEEE pervasive Computing.
Shi, W., Cao, J., Zhang, Q., Li, Y., and Xu, L. (2016). Edge
computing: Vision and challenges. IEEE Internet of
Things Journal, 3(5):637–646.
Tsai, F. S., Han, W., Xu, J., and Chua, H. C. (2009). De-
sign and development of a mobile peer-to-peer social
networking application. Expert Systems with Applica-
tions, 36(8):11077 – 11087.
Zhou, P., Zheng, Y., and Li, M. (2014). How long to wait?
predicting bus arrival time with mobile phone based
participatory sensing. IEEE Transactions on Mobile
Computing, 13(6):1228–1241.
Community-governed Services on the Edge
505
