
A Novel Model to Analyse the Effect of Deterioration on Machine Parts
in the Line Throughput
E. Garcia
1 a
, N. Montes
2 b
, N. Rosillo
2 c
, J. Llopis
1 d
and A. Lacasa
1 e
1
Ford Spain, Poligono Industrial Ford S/N, CP 46440, Almussafes, Valencia, Spain
2
Department of Mathematics, Physics and Technological Sciences, University CEU Cardenal Herrera,
C/ San Bartolome 55, Alfara del Patriarca, Valencia, Spain
Keywords:
Manufacturing Systems, Machine Variability, Bowl Phenomenon, Line Throughput.
Abstract:
This paper presents evidence on how the variability of machine parts can affect the throughput of an assembly
line. For this purpose, a novel model based on mini-terms and micro-terms has been introduced as a machine
subdivision. A mini-term is a cycle time subdivision that can be selected by the user for several reasons: the
replacement of a machine part or simply to analyse the machine more adequately. A micro-term is a mini-
term subdivision and it can be as small as the user wishes. Therefore, the cycle time of a machine is the sum
of mini-terms or the sum of the micro-terms. This paper focuses its attention on a welding line in a Ford
Factory located in Almussafes (Valencia) where a welding unit was isolated and tested for some particular
pathologies. This unit is divided in three mini-terms: the robot motion, the welding motion and the welding
task. The cycle time of each mini-term is measured by changing the deteriorated components for others in the
time. The deterioration of a proportional valve, a cylinder, an electrical transformer, the robot speed and the
loss of pressure are tested within a range that cannot be detected by alarms and maintenance workers, that is,
the range of normal production. The real welding line is modelled and a novel simulation algorithm is created
based on mini-terms. The experimental measurements are introduced in the simulation model and the effect
of the pathologies in the production rate is computed. As a result, the pathologies with greater variability
have a deeper impact in the production rate mainly due to the bowl phenomenon effect. On the contrary, the
pathologies with low variability have a low effect in the production rate. In fact, this paper demonstrates that
the maximum rate capacity can be achieved if the machine variability is near zero.
1 INTRODUCTION
A production line is a set of sequential operations
established in a factory whereby materials are put
through a refining process to produce an end prod-
uct that will be suitable for onward consumption; or
where components are assembled to make a finished
item. Because of the high investment and running
costs involved, the design of such lines is of consid-
erable importance, (O.Battaia and A.Dolgui, 2013).
There are a large number of crucial decisions to be
made in flow line design such as, product design,
process selection, line layout configuration, line bal-
ancing, machine selection, available technology, etc.
a
https://orcid.org/0000-0002-4210-9835
b
https://orcid.org/0000-0002-0661-3479
c
https://orcid.org/0000-0002-8935-1581
d
https://orcid.org/0000-0001-5543-2255
e
https://orcid.org/0000-0003-4379-0682
Usually, these problems are considered one at a time
because of their complexity, (O.Battaia and A.Dolgui,
2013).
The last and crucial step in the process design is
line balancing, (O.Battaia and A.Dolgui, 2013). It’s
here where tasks will be assigned to the workstations
and resources will be used in the line (this is a com-
plex combinatorial problem and the solution mostly
determines the efficiency of the line designed). Due
to the relevance of this task, a large number of re-
searchers have been working on this topic ((O.Battaia
and A.Dolgui, 2013) represent a state-of-the-art un-
derstanding in the matter). Depending on industrial
environments, there are solutions to a number of prod-
uct models, line layout, tasks and their attributes,
workstations and their attributes, etc, see (O.Battaia
and A.Dolgui, 2013). Currently, one of the impor-
tant topics under assembly line design and balancing
is the task processing time variability engendered by
the following factors, (E.Gurevsky et al., 2012): in-
26
Garcia, E., Montes, N., Rosillo, N., Llopis, J. and Lacasa, A.
A Novel Model to Analyse the Effect of Deterioration on Machine Parts in the Line Throughput.
DOI: 10.5220/0009594100260034
In Proceedings of the 17th International Conference on Informatics in Control, Automation and Robotics (ICINCO 2020), pages 26-34
ISBN: 978-989-758-442-8
Copyright
c
2020 by SCITEPRESS – Science and Technology Publications, Lda. All rights reserved
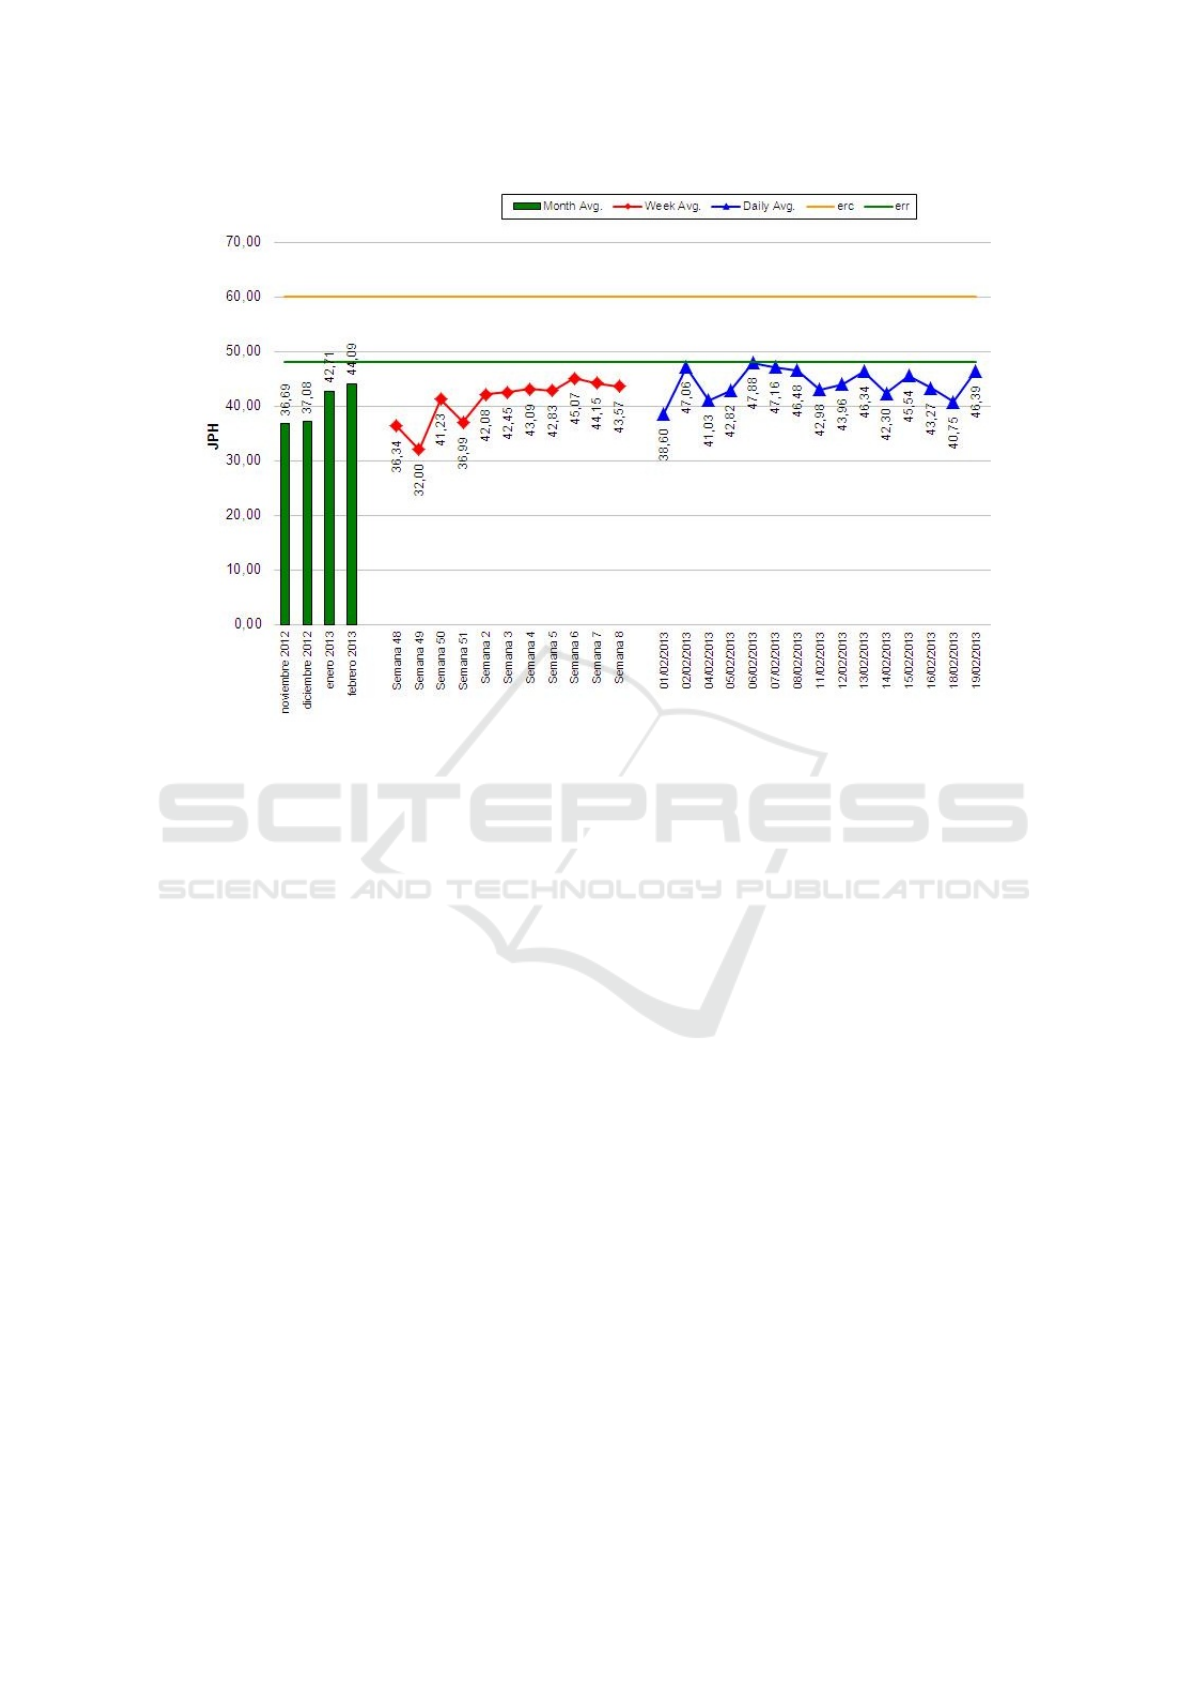
Figure 1: Jobs Per Hour produced in a real line production VS idealized production rate. Note: ECR (engineering running
capacity). ERR (engineering running rate).
stability of operators performing tasks with respect to
work rate, skill and motivation; materials of differ-
ent composition of product items; changes in products
and workstation characteristics; as well as failure sen-
sitivity, (E.Gurevsky et al., 2012). In particular, more
papers were published in the last years about learning
and ageing effect, see (Janiak et al., 2011), where the
mean value and standard deviation are often used for
model task times.
At the beginning of modern production systems,
as well as in most research papers about line balanc-
ing problems, (O.Battaia and A.Dolgui, 2013), it was
thought that a ‘perfectly balanced’ line was the most
efficient line design. However in practice, the perfect
balanced line seldom exists, because some degree of
imbalance is inevitable. When the line is designed
by an expert team, a maximum production rate is de-
fined, mainly in jobs per hour (JPH). It is known as
“Engineering Running Capacity” (ERC). The factory
employees will concentrate on the task of achieving
this maximum production rate, see Fig.1, defining the
throughput of the line. Reality shows that the ERC
is extremely difficult to achieve so the factory defines
a new maximum production rate that is more realis-
tic and is known as the “Engineering Running Rate”
(ERR).
Recent studies have shown that unbalanced lines
with a bowl shape workload configuration can yield
performance in throughput as good as, or even better
than perfectly balanced lines. It is known as a “bowl
phenomenon”. This phenomenon has been studied in
literature during the last decades. It determines that if
we introduce a higher load to the beginning and end
workstation, the throughput can be increased. More
recently a study of the bowl phenomenon was pre-
sented in large unpaced assembly lines under stochas-
tic processing times. The results of this study suggest
that unbalancing a large assembly line in a bowl shape
workload configuration could provide statistical sig-
nificant improvements in throughput. In this study,
single bowl configuration and multiple bowl configu-
rations are tested, see (C.E.Lopez, 2014).
The present paper develops a novel simulation
tool that will allow us to know in real-time the
throughput of the production line. This novel tool
uses two new data classifications, the mini-term and
the micro-term, (E.Garcia, 2016), (E.Garcia et al.,
2018), (E.Garcia and N.Montes, 2019). The literature
classified the data used in the analysis into long-term
and short-term. The difference between both terms
has been addressed by (Chang, 2005). Long-term
is the cycle time mainly used for process planning,
while short-term is the cycle time focused primarily
on process control. A mini-term is a short term subcy-
cle time subdivision and a micro-term is a mini-term
subcycle time subdivision.
A Novel Model to Analyse the Effect of Deterioration on Machine Parts in the Line Throughput
27
The goal of the present study is to determine how
the production rate and bottleneck location are af-
fected by the mini-term variability and with some de-
terioration machine parts that are not detectable by
the control system of the machine and also by main-
tenance workers. For instance, the stiffness of a pro-
portional valve, the pneumatic cylinder wear, galling
or communication inside the stem, the loss of the wire
insulation in a transformer, the loss of pressure in a
pneumatic circuit (below the alarm value) and the loss
of the robot speed. All of these pathologies are mea-
sured in a real welding unit. In order to test the ef-
fect of the measured pathologies, a real welding line
is modelled. In particular, a real welding line in Ford
S.A. located in the factory in Almussafes. This line
has 35 welding units distributed in 8 workstations.
The simulation results provide jobs per hour (JPH)
due to the analysed pathologies. The paper is orga-
nized as follows. Section 2 presents a mathemati-
cal model to compute the long-term and short-term
by means of the mini-terms and micro-terms. Sec-
tion 3 presents a real case study, which is a welding
unit where mini-terms are measured experimentally
for particular pathologies. Section 4 presents a model
of a real welding line and the simulation results for
each of the pathologies. Section 5 presents a discus-
sion on the results and Section 6 concludes the paper
with an emphasis on future research challenges.
2 FROM THE MICRO-TERM TO
THE LONG-TERM
The literature classifies the data used in the anal- ysis
into long-term and short-term cycle time. Long- term
is mainly used for process planning while short- term
focuses primarily on process control. There is abun-
dant literature for long-term analysis in com- parison
with the literature that studies short-term data.
Therefore, following the definition by (L.Li et al.,
2009), the short-term is referred to an operational pe-
riod not large enough for a machine’s failure period to
be described by a statistic distribution. The machine’s
cycle time is considered short-term. The present study
redefines short-term cycle time into two new terms,
mini-term and micro-term. A mini-term could be
defined as the cycle time of a machine part that, in
a preventive maintenance policy or in a breakdown,
could be replaced in an easier and faster manner than
another machine part subdivision. Also a mini-term
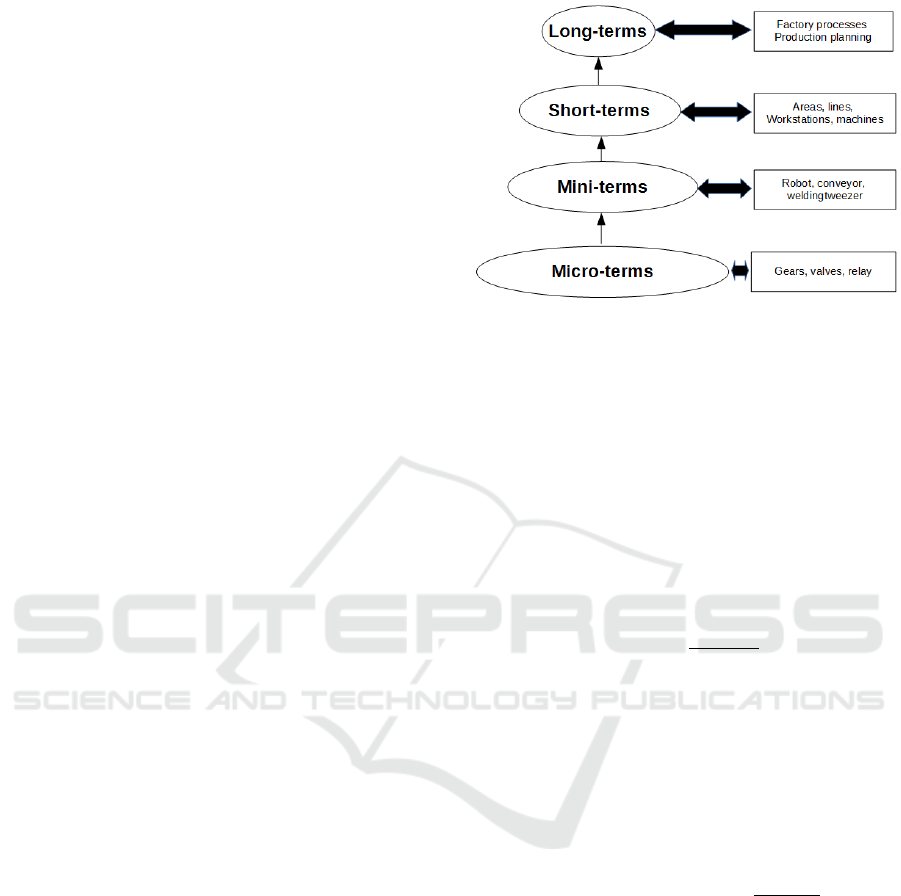
could be defined as a subdivision that allows us to un-
derstand and study the machine behaviour, see figure
2.
Each mini-term is modelled statistically by the
Figure 2: From Micro-term to Long-term.
mean value µ and standard deviation σ of the mini-
term cycle time, T m
j
(µ
j
T m
, σ
j
T m
). Then, the mean
value of the short-term machine cycle time for a ma-
chine i(µ
i
TC
) can be computed as;
µ
i
TC
=
n
∑
j=1
µ
j
T m
(1)
where µ
j
T m
is the j mean value of each mini-term
cycle time. The standard deviation of the short-term
machine cycle time for a machine i(σ
i
TC
) can be com-
puted as;
σ
i
TC
=
s
n
∑
j=1
σ
j
T m
2
(2)
where σi
TC
is the j standard deviation of the short-
term machine cycle time. In the same way, a micro-
term is defined as each mini-term part in which could
be divided itself. Each micro-term is also modelled
statistically by the mean value and standard deviation
of the micro-term cycle time, T
k
µ
(µ
k
T µ
, σ
k
T µ
). Then,
each mini-term is defined as:
µ
j
T m
=
n
∑
k=1
µ
k
T µ
, σ
j
T m
=
s
n
∑
k=1
σ
k
T µ
2
(3)
Now, the next step to move upward in the pyramid
of figure 2, is to simulate the workstation joined with
the other ones. The common way is using a simpli-
fied machine state, see Figure 3 . There are three pos-
sible workstation states, “Working”, “Starving” and
“Blocking”. If the current station is in “Working”
state and the work is finished, it checks the follow-
ing station, if it is in “Starving” state, the finished
part of product is delivered to it and the state of the
current station is free to receive another job. If the
next station is in “Working” state when the current
one finishes its work, the current station changes its
state to “Blocking”, that is, blocking itself until the
ICINCO 2020 - 17th International Conference on Informatics in Control, Automation and Robotics
28

next station is free. If the current station is free to re-
ceive another part, it checks the previous station. If
the previous station is in “Working” state, the current
state changes to “Starving” state waiting itself until
the previous station has a part to work on. If the pre-
vious station is in “Blocking” state, the current sta-
tion receives the part and the current state changes to
“Working”. There is always work available for the
first station and there is always a final product to be
taken from the last one. When the simulation starts,
every station state is set to “Starving”, but the first
one whose state is set to “Working” state. The sim-
ulation loop runs at predefined step time (4t). For
each step time, the cycle time of each workstation de-
creases until the cycle time is zero, meaning that the
work is finished and the events are triggered. The cy-
cle time of a workstation has a probabilistic distribu-
tion TC
i
(µ
i
TC
, σ
i
TC
) that depends on mini-terms and
micro-terms, see equations (1) to (4). Then, when a
new job is started in a workstation, a new cycle time
is generated based on the probabilistic distribution. It
also means that the Starving and Blocking states have
a probabilistic time distribution that is, T S
i
(µ
i
T S
, σ
i
T S
),
T B
i
(µ
i
T B
, µ
i
T B
), respectively. At this point the latency
time is also defined, which determines the rate with
which a finished part is extracted from the worksta-
tion, LA(µ
LA
, σ
LA
). The jobs per hour produced by
the line, JPH(µ
JPH
, σ
JPH
), are computed using long
time simulation. If we increase the time simulation
for the lifetime of the factory, the total production can
be computed, see figure 2, the upper part of the pyra-
mid.
3 CHARACTERIZATION OF
MINI-TERM DETERIORATION
IN A REAL WELDING STATION
The goal of the present study is to demonstrate the
effect of deterioration of some micro-terms on the
throughput of the line. For this purpose, a welding
line is taken as an example. The welding lines are one
of the most relevant because there are 4.500 weld-
ing points in a car. The welding line is composed
by welding workstations which have welding stations
working in parallel, see section 4. A welding station
is composed of a robot arm and a welding clamp, see
Figure 4. In the present study, a welding station was
isolated for the welding line in order to analyse, un-
derstand and measure the results presented in this sec-
tion.
The behaviour of the welding unit is simple. First,
the robot arm moves the welding clamp to the point to
weld. Then, a pneumatic cylinder moves the welding
clamp in two phases: one to approximate the clamp
and the second one to weld. The pressure applied by
the clamp is controlled by a control system. Each of
these devices needs a certain time to develop their task
and within each of these devices, there are also com-
ponents that need a certain time to develop their own
tasks. In order to analyse the deterioration effect of
some micro-terms, the welding unit is divided in three
mini-terms, the robot arm, the welding clamp motion
and the welding task.
Figure 5 shows the experimental setup to measure
the cycle time of each mini-term in the welding sta-
tion where the PLC and the PC are used to measure
the time. The experimental test is quite simple. The
robot arm, starting from a predefined initial point,
moves the clamp to a predefined welding point; the
clamp is closed and develops the welding task. Due
to the welding motion and the welding task that are
low time consuming, the task is repeated 6 times.
3.1 Pathologies Analysed
The welding station, as well as other stations in the
industry, could suffer an amount of pathologies that
produce an effect on the cycle time. Based on the op-
erator’s experience, we selected some pathologies for
a welding clamp station. These pathologies produce
a cycle time modification but fail to produce the rup-
ture of the component, going unnoticed for mainte-
nance workers and also for the control system that has
some alarms to trigger fails. The pathologies for the
welding clamp mini-term are: the proportional valve,
the cylinder stiffness, welding failure produced by the
transformer and the pressure loss, and the pathology
for the robot arm mini-term is: the robot arm speed.
A brief description of each one are hereby explained:
- Pathology 1 (Proportional valve): This valve
transmits the pressure to the cylinder and the con-
troller controls it. It is responsible for maintaining the
proper pressure in the cylinder. During its lifetime,
its components suffer deteriorations that produce the
stiffness of some of them. This condition creates a
time delay. When the deterioration is big enough, the
valve cannot transmit enough pressure to the cylinder
and the welding task cannot be carried out.
- Pathology 2 (Cylinder stiffness): A critical term
in welding resistance is the pressure force on the met-
als together. This force is necessary to ensure good
electrical contact between the parts to be welded, and
to maintain the fixed parts until the metal forming the
solid board has time to solidify. The elements re-
sponsible for transmitting the proper pressure to these
plates are cylinder clamps. In this case, one of the
A Novel Model to Analyse the Effect of Deterioration on Machine Parts in the Line Throughput
29
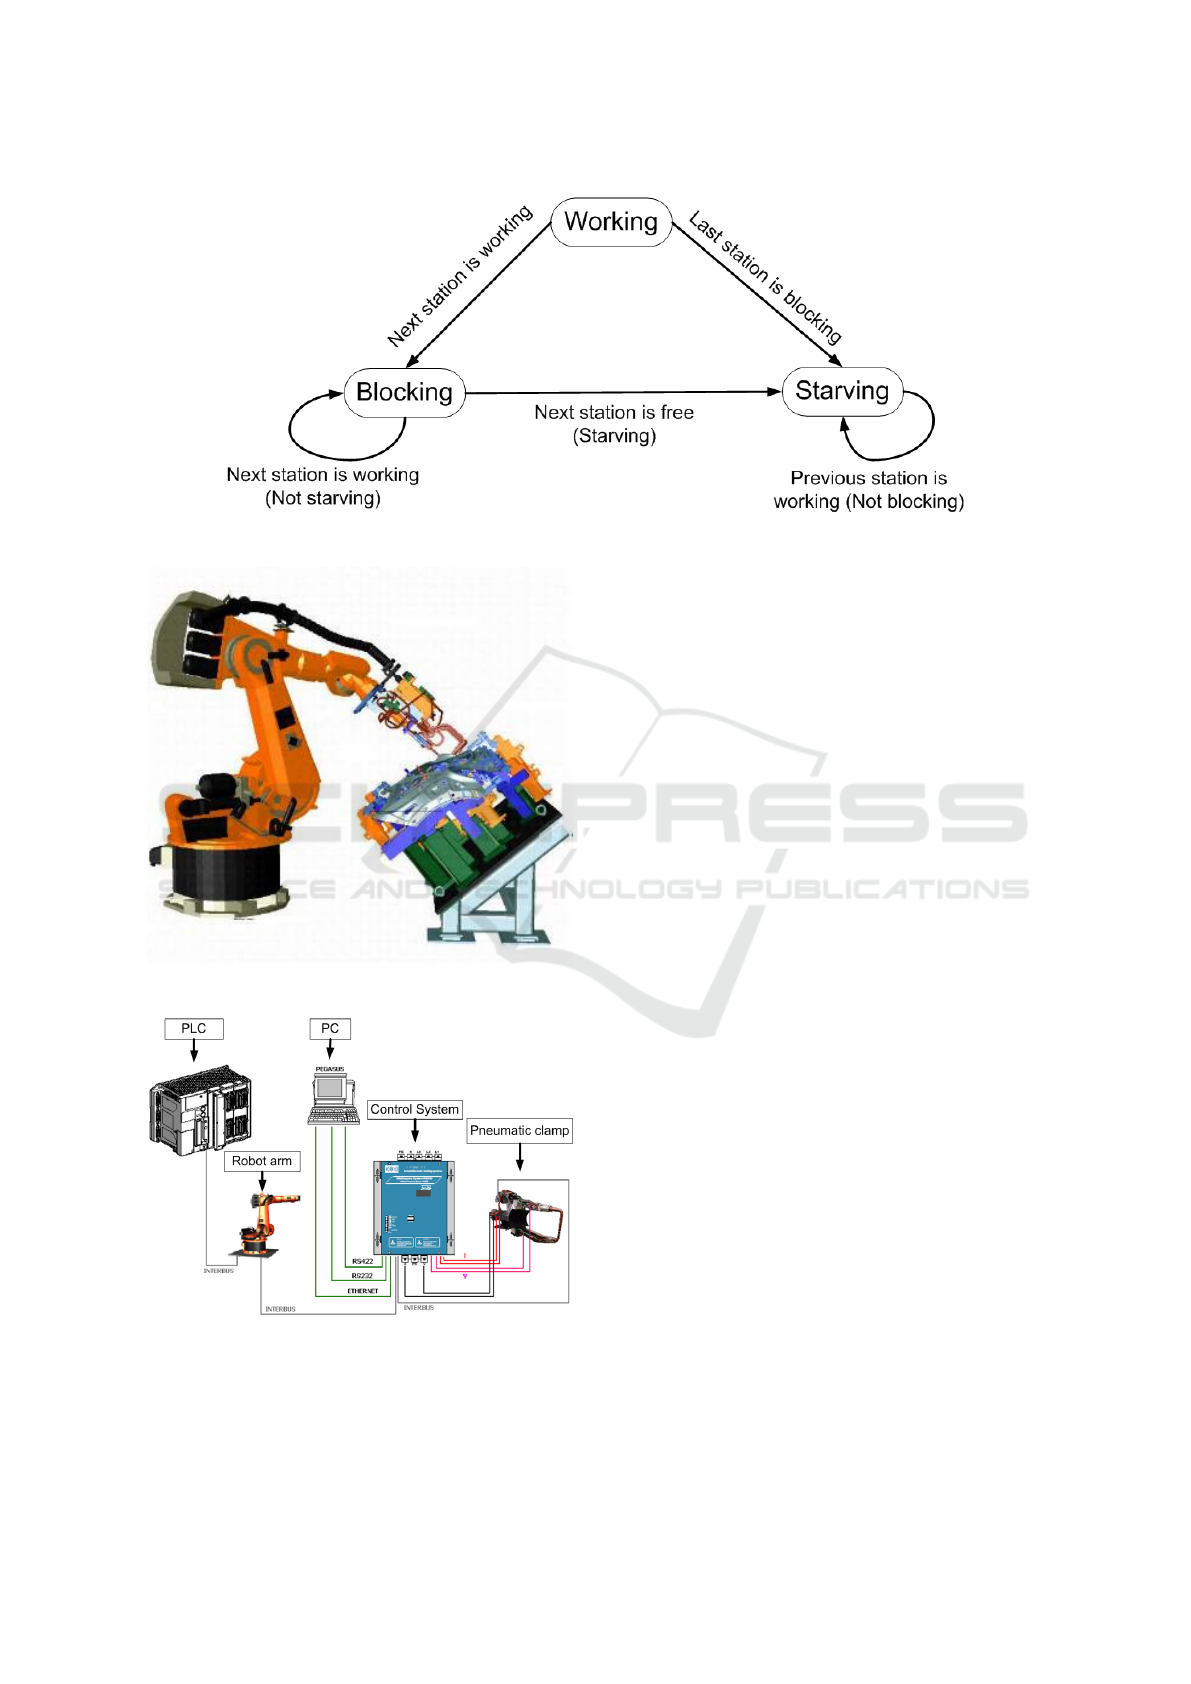
Figure 3: Simplified machine state for the workstation.
Figure 4: Welding station.
Figure 5: Experimental setup for the welding station.
cylinders could have a wear, galling or communica-
tion inside the stem. This condition creates a time de-
lay. Maintenance workers detect this pathology when
the cylinder cannot transmit enough pressure on the
metals and the welding task cannot be performed.
- Pathology 3 (Welding failure): The welding pro-
cess between parts consists of passing an electric cur-
rent through intensive metals to be joined. The de-
vice generally used for this task is a transformer. The
power goes through a transformer in which the ten-
sion is reduced and the current is increased substan-
tially. The fatigue of this component is mainly pro-
duced due to the loss of wire insulation. A modifi-
cation is carried out in the value of the insulated re-
sistance and therefore a current reduction is produced
affecting the welding time. Maintenance workers de-
tect this pathology when the failure is so big that the
welding task cannot be performed.
- Pathology 4 (Pressure loss): One of the most
common delays is produced by pressure losses in a
pneumatic circuit. The pressure drop causes a delay
or malfunction in the pneumatic devices to be oper-
ated. This pathology could be produced by many facts
such as a simple pore that produces a failure in the
compressor. Maintenance workers detect this failure
when the low pressure alarm is triggered.
- Pathology 5 (Robot speed): The common indus-
trial robots have 6 axes. All these axes (motors) are
synchronized to achieve the points that have been de-
fined by the program to perform its function or task. If
we have a failure in the operation, it causes an engine
speed reduction that directly affects the process cycle
time. There is an amount of reasons that produce this
pathology. In these industrial robot arms, high speed
and high accurate operation are required. However, in
the case of high speed operation, it often causes high
jerk, i.e., rapid change of acceleration. Jerk causes de-
terioration of control performance such as vibration of
a tip of a robot arm. Jerk forces are not equally dis-
tributed and as the robot arm does the same movement
again and again, the deterioration is located in some
ICINCO 2020 - 17th International Conference on Informatics in Control, Automation and Robotics
30

particular joints. Mechanical structure deterioration
or the deterioration of electrical parts also affects the
speed. This pathology is very difficult to detect by the
maintenance workers because it does not produce the
breakdown of the machine and, as the robot moves
at high speed, it is nearly impossible to be detected
without a specific procedure.
3.2 Experimental Test
The experimental methodology is as follows. The
clamping task is to weld the same point 6 times in
order to obtain enough time precision. The robot arm
trajectory is the same in all the movements. Then,
the clamping task is repeated 40 times in order to ob-
tain a sufficient number of samples to measure the
mean value and the standard deviation for each mini-
term. First, the welding clamp station is tested with-
out any of the pathologies hereinbefore explained.
Afterwards, a particular component with each pathol-
ogy is replaced in the station and the test is repeated.
It is important to remark that the components are in
the normal production rate. Table 1 shows the ex-
perimental result measurements of all pathologies for
each mini-term. (x, S).
4 WELDING LINE. MODELLING
AND SIMULATION
A previous section shows how the welding unit and,
machines in general, have a probabilistic behaviour.
In addition, the deterioration of the machines pro-
duces a delay in the intermediate task and/or in the
standard deviation. In this section we will analyse
how many jobs are lost in a real line due to these
pathologies. For this purpose, a real welding line in
Ford S.A. located at the Almussafes factory has been
selected. The welding line was installed in 1980. The
staff group that designed the line defined the maxi-
mum running capacity, ECR (engineering running ca-
pacity), 60 JPH. However, the plant engineers have
another maximum running capacity, that is the ERR
(engineering running rate), in this case defined in 51
JPH. And our daily production to reach is GRR (Get
Ready Requirement) our (28,9 JPH). The GRR means
market requirements, i.e. customers’ orders. Figure 6
shows the production rate of the welding line.
In a real welding line like this, there are welding
workstations where, each one of them has welding
stations working in parallel and sometimes in serial.
Each welding station makes some welding points in
the same cycle time. We can find 1, 2, 4 or at least 6
welding stations in the same workstation, where each
one of them makes up to 19 welding points, see ta-
ble 3. In our particular case, our welding line has 8
workstations where 3 are for 6 welding units, 4 with
4 welding units, and 1 for 1 welding unit. Each weld-
ing unit is modelled with robot motion, welding mo-
tion, welding task as well as the offset. Robot mo-
tion means how many seconds the robot is moved,
the welding motion and welding task mean how many
welding points the welding clamp has to perform. The
offset means how many seconds the welding station
must wait for another station to do the job.
5 WELDING LINE SIMULATION
In order to simulate the welding line, a state ma-
chine simulator is developed. There are three pos-
sible workstation states: “Working”, “Starving” and
“Blocking”, see figure 3 and figure 7. The loop is up-
dated with an incremental time of 0.01 seconds. In
the simulated welding line, there is always a job in
the first workstation, so that the blocking state can-
not happen in the first station. In addition, all the
jobs finished in the last workstation are removed, so
that the “Starving” state in the last workstation can-
not happen. The loop starts with all the stations in the
“Blocking” state.
The cycle time for each workstation is the maxi-
mum cycle time of each welding station that works in
parallel, indicating the slowest welding unit and the
bottleneck for a particular workstation. The transfer
time is added to the cycle time. This time is the time
required to transport the car from one workstation to
the next one (12 seconds), see figure 8.
The cycle time of each welding unit is computed
as shown in figure 9. A pseudo-random number based
on mean and variance is computed for each mini-
term using the experimental values of table 2. The
algorithm repeats the creation of a number as many
times as the mini-term is repeated (i.e. for 10 weld-
ing points, the algorithm will produce 10 numbers).
The offset is also added if necessary. The simula-
tion is computed with two time bases, one hour (JPH)
and one day (JPD) with an incremental time of 0.01
seconds. This simulation is repeated 50 times and
the mean and variance of the jobs produced are com-
puted. First, the simulation with any pathology is
performed. The results are for one-hour time base,
(51,1.05) JPH, similar than the ERR, and for one-day
time base, (1252, 3.09) JPD. Table 2 shows the sim-
ulation results where a particular pathology is located
in a particular welding station. Obviously, the rest of
welding units are considered without pathology.
A Novel Model to Analyse the Effect of Deterioration on Machine Parts in the Line Throughput
31
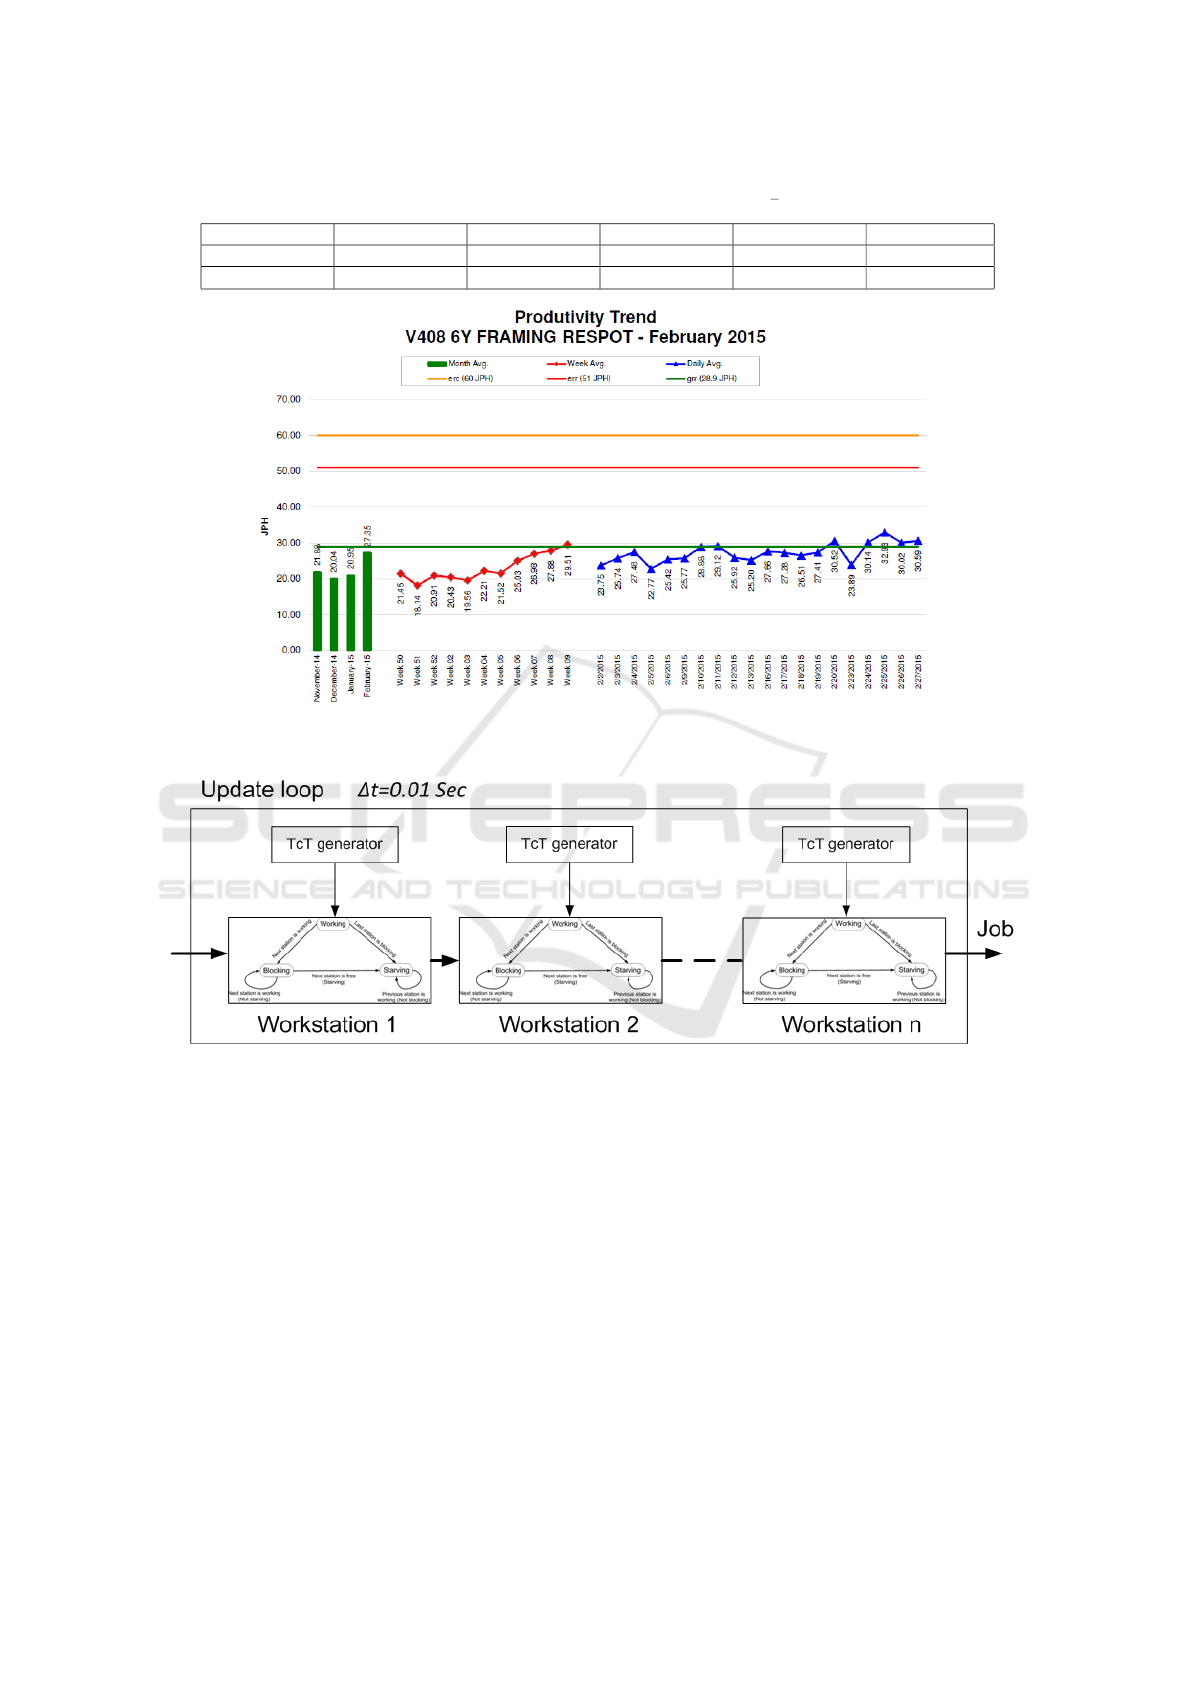
Table 1: Mean and standard deviation values for the robot motion miniterm, (x, S) respectively.Units (ms).
C P
1
P
2
P
3
P
4
P
5
(35549.7, 21.4) (35547.1, 33.6) (35549.6, 25.7) (35549.2, 36.1) (35548.5, 30.1) (463314, 31.4)
(1, 604 · 10
−6
) (1, 945 · 10
−6
) (1, 72 · 10
−5
) (1, 101 · 10
−5
) (1, 848 · 10
−6
) (1, 67 · 10
−5
)
Figure 6: Jobs Per Hour produced in a real welding line VS idealized production rate. Note: ECR (engineering running
capacity). ERR (engineering running rate). GRR (get ready requirement.
Figure 7: State machine workstation simulation.
5.1 Discussion
Through the simulation results obtained we can see
how sensitive the production rate is to some small cy-
cle time variations, in particular, mini-terms. Table 2
shows the maximum and minimum Jobs produced for
each base time. If we compare the results with the
simulated ERR, (51,1.05) JPH, there is a lot of jobs
per hour lost.
The least impact is from pathology 3 and 5, just
only a few jobs in a day. By contrast the greatest im-
pact is for pathologies 1 and 2, where in the worst
case more than 50 % of production can be lost. It
is important to remark the dispersion of the results.
In the worst case of pathology 2, the variance is 9.5,
in JPH and 171 in JPD. These results are due to the
Bowl Phenomenon effect that propagates the variabil-
ity starting from the bottleneck and producing a mul-
tiplied effect, see (C.E.Lopez, 2014). The bowl phe-
nomenon is the main responsible for the results, be-
cause, when the pathology has a similar variance than
the ERR, the difference only depends on the mean
value. For instance, Pathology 5 has a 30 % of mean
time in the mini-term robot motion, compared with
the mean value of ERR. However, if it has similar
variance, it means that only the mean value affects
the production rate. However, the results are very dif-
ferent when the variance is greater than the ERR. In
this case, the welding line is completely unbalanced
and the production rate turns unpredictable. The sim-
ICINCO 2020 - 17th International Conference on Informatics in Control, Automation and Robotics
32
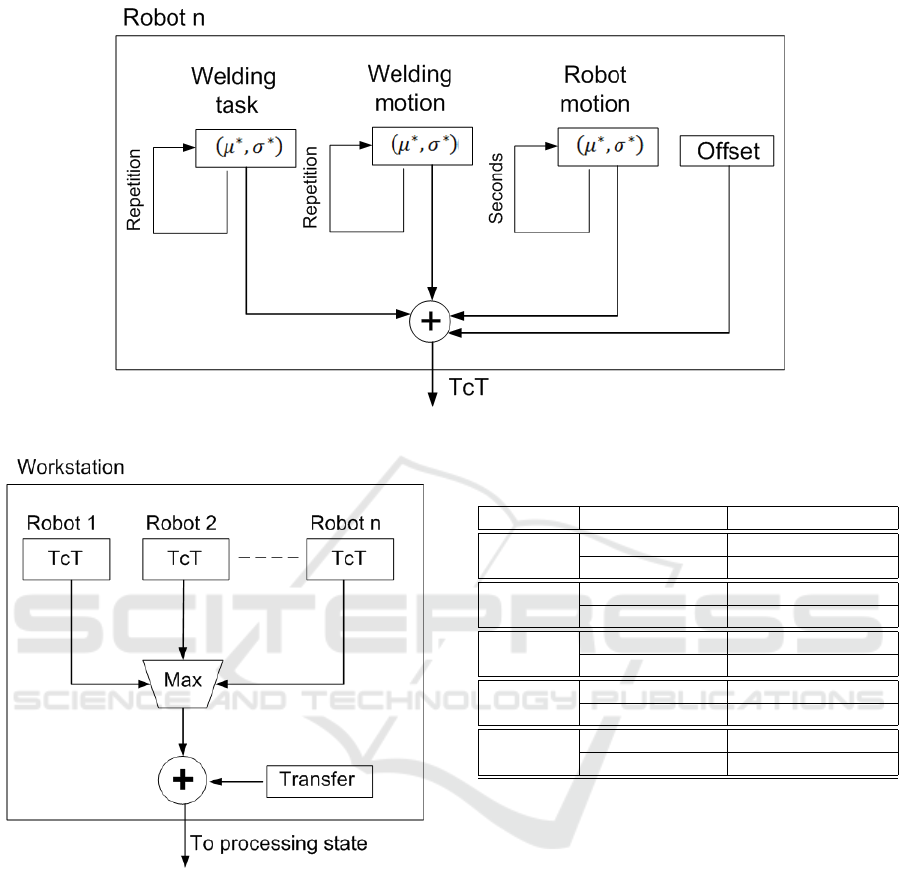
Figure 8: Cycle time computation for each robot/Welding unit.
Figure 9: Cycle time computation for each Workstation.
ulation result demonstrates that the reason for the loss
of jobs is the machine variability, and ERC cannot be
achieved due to the mini-term and micro-term time
deviation of each machine. For instance, if we replace
the deviation of each mini-term in the case of “with-
out pathology” for 0.01 sec, the simulation gives (57,
0.47) JPH, 4 Jobs below the ERC.
6 CONCLUSIONS AND FUTURE
WORKS
This paper presents how the variability of a machine
part can affect the production rate in a line. For this
Table 2: Simulation results when a single pathology occurs
in a single welding station (µ, σ) JPH.
Pathology Production Rate Location (WS,Wu)
1
Max (35,3.39) (1,4)
Min (26,6.28) (8,6)
2
Max (39,0.98) (1,1)
Min (24,9.53) (7,5)
3
Max (51,1.06) (1,1)
Min (50,1.44) (1,5)
4
Max (40,3.25) (1,4)
Min (34,7.01) (7,5)
5
Max (51,1.11) (1,4)
Min (50,1.17) (8,4)
purpose, mini-term and micro-term cycle time sub-
division is introduced. The present paper focuses its
attention on a welding line located in a Ford Factory
in Almussafes (Valencia). A welding station is iso-
lated and tested for some particular pathology. The
deterioration of a proportional valve, the cylinder, the
transformer, the robot speed and the loss of pressure
are tested in the range that the alarms and the main-
tenance workers cannot detect. The welding line is
modelled and a simulation algorithm based on ma-
chine states is constructed. The experimental mea-
surements are introduced in the algorithm and the
effect in the production rate is tested. As a result,
the pathologies with greater variability have a deep
impact in the production rate mainly because of the
bowl phenomenon effect. On the contrary, patholo-
gies with low variability have a low effect in the pro-
duction rate. The simulation algorithm allows us to
demonstrate the reason for which the ERC cannot be
achieved in a real production line, which is the ma-
A Novel Model to Analyse the Effect of Deterioration on Machine Parts in the Line Throughput
33

chine time variability. If we replace the deviation
of the mini-terms in the case of “without pathology”
near to zero, the JPH are near to the ERC. The re-
sults presented in this study open new challenges and
research work for the future. On the one hand, the
watchdog agent that detects these anomalies in the
production rate will be our immediate future work.
Early detection of these pathologies will produce an
increase in the throughput. On the other hand, a deep
characterization of the machine part deterioration is
required. Although manufactures have a threshold for
the lifespan of the parts, however, for maintenance
workers the evolution of the deterioration during the
lifespan time could be crucial in the throughput of
the line, as well as for the detection of pathologies
with great variability, evidence is given on how the
variability of machine parts can affect the through-
put of an assembly line. It is important to state that
the present study only takes into account one pathol-
ogy in one welding unit and the others are without
pathologies. It is likely that in a real welding line all
the welding units have a percentage of deterioration.
ACKNOWLEDGEMENTS
The authors wish to thank Ford Espa
˜
na S.L. and in
particular the factory in Almussafes for the support in
the present research. The authors also wish to thank
Joan Camps Soria for his support in the present work.
REFERENCES
C.E.Lopez (2014). Unbalanced workload allocation in large
assembly lines. PhD.
Chang, Q. (2005). Supervisory factory control based on
real-time production feedback. PhD.
E.Garcia (2016). An
´
alisis de los sub-tiempos de ciclo
t
´
ecnico para la mejora del rendimiento de las l
´
ıneas
de fabricaci
´
on. PhD.
E.Garcia and N.Montes (2019). Mini-term, a novel
paradigm for fault detection. Special Issue: IFAC
Conference on Manufacturing Modelling, Manage-
ment and Control MIM 2019:, 52(13):165–170.
E.Garcia, N.Montes, and M.Alacreu (2018). Towards
a knowledge-driven maintenance support system for
manufacturing lines. International COnefrence on In-
formatics in Control, Automation and Robotics, pages
499–511.
E.Gurevsky, O.Battaia, and A.Dolgui (2012). Balancing
of a simple assembly line under variations of task
processing times. Annals of operations research.,
201(1):265–286.
Janiak, A., T.Krysiak, and R.Trela (2011). Scheduling prob-
lems with learning and ageing effects: A survey. De-
cission making in manufacturing and services. ., 5:19–
36.
L.Li, Q.Chang, and J.Ni. (2009). Real time production im-
provement through bottleneck control. International
Journal of production research, 47(21):6145–6158.
O.Battaia and A.Dolgui (2013). A taxonomy of line balanc-
ing problems and their solution approaches. Interna-
tional Journal of Production Economics, 142(2):259–
277.
ICINCO 2020 - 17th International Conference on Informatics in Control, Automation and Robotics
34
