
Evaluation of Change Point Detection Algorithms for Application in Big
Data Mini-term 4.0
E. Garcia
1 a
, N. Montes
2 b
, J. Llopis
1 c
and A. Lacasa
1 d
1
Ford Spain, Poligono industrial Ford S/N, CP 46440, Almussafes, Valencia, Spain
2
Department of Mathematics, Physics and Technological Sciences, University CEU Cardenal Herrera,
C/ San Bartolome 55, Alfara del Patriarca, Valencia, Spain
Keywords:
Mini-term, Big Data, Mini-term 4.0, Prognostics, Change Point, Breakdown.
Abstract:
The present study analyses in depth the algorithms of change point detection in time series for the prediction
of failures through the monitoring of mini-terms in real time. The mini-term is a new concept in the area
of failure prediction that is based on the measurement of the time it takes for a component to perform its
task. The simplicity of the technique has made it feasible to build industrial Big Data for the prediction of
failures based on this concept. There are currently more than 11,000 sensorized mini-terms at Ford factory
in Almussafes (Valencia). For the present study, 10 representative real cases of the different change points
that have been detected up to the present were selected and, these cases were analysed by using the change
point algorithms, which are representative of the great majority of algorithms described in the literature in
their different versions. As a result, their accuracy was measured when detecting the change point and its
computational cost. A discussion of the results is shown at the end of the paper.
1 INTRODUCTION
The manufacturing industry is experiencing a rapid
evolution (or revolution) towards what some have
called Industry 4.0. In this new paradigm the factories
are highly automated and computerized, all their pro-
cesses are connected and interact with each other and
with external processes. With instrumentation sys-
tems, PLCs (Programmable Logic Controllers), large
amounts of data can be generated, which must be
manipulated to convert them into useful information
at each of the various levels of the manufacturing
system: machine, manufacturing cell, assembly line,
technical office, production management, etc.
Currently there are consolidated technologies in
the industry such as PLCs, technologies that have
been coexisting with the industry for a long time, but
today, they are not adapted to the changes demanded.
The new paradigms emerging in the industry such as
Agile Manufacturing are introducing concepts such
as the dynamic reconfiguration of manufacturing sys-
tems, and in particular from software. Although the
a
https://orcid.org/0000-0002-4210-9835
b
https://orcid.org/0000-0002-0661-3479
c
https://orcid.org/0000-0001-5543-2255
d
https://orcid.org/0000-0003-4379-0682
most important concept is focused on connectivity in
Industry 4.0. In this regard, new applicable technolo-
gies such as Big Data,Cloud Manufacturing and the
Internet of Things (IoT) have emerged and introduced
new standards in the production process.
1.1 Big Data
When we talk about Big Data, we mean the data sets
or combinations of data sets whose size (volume),
complexity (variability) and speed of growth (speed)
make it difficult to capture, manage, process or anal-
yse using conventional technologies and tools, such
as relational databases and conventional statistics or
visualization packages, within the time necessary for
them to be useful.
The complex nature of Big Data is mainly due to
the unstructured nature of much of the data generated
by modern technologies, such as web logs, radio fre-
quency identification (RFID), built-in sensors in de-
vices, machinery, vehicles, Internet searches, social
networks such as Facebook, laptops, smart phones
and other mobile phones, GPS devices and call center
records.
In most cases, in order to effectively use Big Data,
it must be combined with structured data (usually
Garcia, E., Montes, N., Llopis, J. and Lacasa, A.
Evaluation of Change Point Detection Algorithms for Application in Big Data Mini-term 4.0.
DOI: 10.5220/0009594001170124
In Proceedings of the 17th International Conference on Informatics in Control, Automation and Robotics (ICINCO 2020), pages 117-124
ISBN: 978-989-758-442-8
Copyright
c
2020 by SCITEPRESS – Science and Technology Publications, Lda. All rights reserved
117

from a relational database) of a more conventional
commercial application, such as an ERP (Enterprise
Resource Planning) or a CRM (Customer Relation-
ship Management).
1.2 Big Data for Predictive
Maintenance. Making a Profit
Comes First
In general, maintenance can be classified as two main
groups: Corrective (CM) Preventive (PM) and Predic-
tive (PdM) Maintenance. CM is carried out when the
machine fails or some of the elements of the equip-
ment are damaged and must be replaced or repaired,
this element and/or part will be responsible for a fail-
ure in the entire line if the action is not executed. PM
is carried out to prevent fail, as a rutinary mainte-
nance task. However, the PM is carried out before
the equipment fails. The purpose of a PM order is to
promote continuous production of the system and/or
minimize the loss of performance. Usually, in the
industry the indicator of deterioration is constructed
through the monitoring of variables such as vibration,
temperature and noise of the machine. However, if
we want to avoid line shutdowns, it would be nec-
essary to build Big Data and place these sensors on
all machines and this would lead to exorbitant costs,
(A.K.S.Jardine et al., 2006).Therefore, there is cur-
rently no system that performs this task in real time
and for all machines, and this causes that, currently,
only specific machines are sensorized and/or that one
or more operators take measurements of the machines
“manually”, that is, they transfer the sensors from one
machine to another.
2 PREVIOUS WORKS
2.1 From the Micro-term to the
Long-term
The literature classifies the data used in the analysis
of the manufacturing process into two types, the long-
term data (long-terms) and the short-term data (short-
terms). Long-term data are used mainly for pro-
cess planning while short-term data are used mainly
for process control. There is abundant literature
that works with the analysis of long-term times, in
comparison with the literature that studies short-term
times. Following the definition of (L.Li et al., 2009),
the short-term data refer to a time not long enough
for the failure period of the machine and where the
cycle time of the machine is considered short-term
time. In (E.Garcia, 2016) the short term is redefined
in two new terms, the mini-term and the micro-term.
A mini-term can be defined as the time that a part of
the machine needs to perform its own task. This mini-
term subdivision can be selected based on a policy of
preventive maintenance or in a breakdown, in which
it could be replaced in an easier and faster way than
another sub-divided part of the machine. Also a mini-
term could be defined as a sub-division that allows us
to understand and study the machine behaviour. In
the same way, a micro-term is defined as the time in
which each part of the mini-term could be divided it-
self. This model has been published in (E.Garcia and
N.Montes, 2017).
2.2 Mini-term Degradation Path. A
Change Point
Prediction and analysis of degradation paths are im-
portant to condition-based maintenance (CBM). It is
well known that the degradation paths are non-linear.
It means that in the degradation path, a sudden change
point appears when the RUL (Remaining Useful Life)
is near the end, see (X.Zhao, 2018), (X.Zhao, 2014).
Before the change point, the component works in op-
timal conditions and after the change point the com-
ponent works in bad conditions alerting that the fail-
ure will happen soon.
The change point in the physical part of the ma-
chine components produces a similar effect in the sub-
cycle time, that is, a change point in the mini-term,
Figure 2 shows cases measured at Ford factory in Al-
mussafes. When a change point is dectected in the
mini-term, an alarm must be activated for the mainte-
nance workers to replace it, as soon as possible.
3 TOWARDS BIG DATA BASED
ON MINITERMS FOR
PREDICTIVE MAINTENANCE
The results presented in (E.Garcia et al., 2018) gener-
ated a great expectation at Ford Motor Company, be-
cause the mini-term provides a great advantage over
other sensors, it is easier and cheaper to install. It is
cheap because no additional hardware installation is
required to measure the sub-cycle time, just the use
of the PLC and sensors installed for the automated
production process, and it is easy because we only
need to code extra timers into the PLC. Therefore, the
Ford Motor Company began the implementation of
mini-terms in its Almussafes plant and for this pur-
pose the application shown in Figure 1 was devel-
ICINCO 2020 - 17th International Conference on Informatics in Control, Automation and Robotics
118

oped, where the k-means algorithm is used to detect
any change produced in the time series based in mini-
terms, (E.Garcia and N.Montes, 2019).There are cur-
rently more than 11,000 mini-terms installed in the
different plants at Ford in Valencia, which allowed us
to move towards a big data of miniterms to analyze
in depth the capabilities of the mini-term for failure
prognostics.
4 GOAL OF THE PAPER
The process to collect and analyse mini-terms started
at the end of 2018 at Almussafes factory. At present,
three plants, Body 1, 2 and 3 have thousands of
mini-terms collected in the Mini-term 4.0. The com-
ponents analysed are: the welding guns (pneumatic
and electrical), elevators, screwdriver, scissor tables,
doors, etc. In these components, we can see different
pathologies showing in the time series of the mini-
term, from slow deteriorations to abrupt changes, os-
cillations, noise, positive and negative peaks, etc.
Therefore, we need to identify the algorithm or com-
bination of change point algorithms capable of detect-
ing them effectively, minimizing the number of false
positives. This paper intends to make a comparison of
the most used change point algorithms in the literature
by applying them to 10 selected cases in the appli-
cation, Mini-term 4.0, which are representative of all
the change point variants detected up to the present.
Section 5 shows the 10 cases selected for the study.
In section 6 the selected change point algorithms are
shown and in section 7 the results obtained are shown.
In section 8 there is a discussion of the results. Con-
clusions and future work are shown in section 9.
5 SELECTED EXAMPLES
The Mini-term 4.0 system monitors in real time all
the mini-terms of the installed components and sends
an e-mail to the maintenance operators when a be-
haviour change is detected using k-means, (E.Garcia
and N.Montes, 2019). The maintenance operator
checks the component and performs the necessary
process if a pathology is really detected. In any case,
the operator reports the false positive or the pathol-
ogy detected to the Mini-term 4.0 system. Of the
cases detected, 10 representative cases of the change
point variability were selected, see Figure 2, these are:
• Case 1. Damaged flange in pneumatic clamp: The
first type case is a damaged flange in one of the
pneumatic clamps that needs to be changed.
• Case 2. Worn or split screw in pneumatic clamp:
in this case we find a worn or split screw in one of
the pneumatic clamps that needs to be changed or
adjusted.
• Case 33. Metal chip adhered in pneumatic clamp:
in this type case we find a metal chip adhered
to one of the pneumatic clamps that needs to be
cleaned and lubricated.
• Case 4. Lack of lubrication in the pneumatic
clamp cylinder: in this case there is a lack of lu-
brication in the cylinder of one of the pneumatic
clamps that needs to be lubricated.
• Case 5. Lack of lubrication in the pneumatic
clamp valves: in this case there is a lack of lu-
brication in the valves of one of the pneumatic
clamps that need to be lubricated.
• Case 6. Flange damaged in pneumatic clamp:
in this case, as in the first case, we find a dam-
aged flange in one of the pneumatic clamps, which
needs to be changed.
• Case 7. Pneumatic clamp cylinder failure: in this
type case we find a cylinder failure of one of the
pneumatic clamps that needs to be replaced.
• Case 8. Air leak in the valves of a pneumatic
clamp: in this case we can see an air leak in
the valves of one of the pneumatic clamps whose
joints need to be replaced.
• Case 9. Lack of lubrication in a screwdriver: in
this case there is a lack of lubrication in one of the
screwdrivers whose axes need to be lubricated.
• Case 10. Sudden failure of a pneumatic clamp:
in this case we find a sudden failure of one of the
pneumatic clamps that needs to be fully replaced.
In this case the reason for the failure could not be
found.
6 SELECTED CHANGE POINT
ALGORITHMS
There is a wide variety of algorithms in the literature
that are capable of detecting one or more points of
change, showing their advantages and disadvantages,
as well as their applications. In this paper we use the
general algorithms that comprise the vast majority of
algorithms present in the literature, see (Truong et al.,
2019), (Truong et al., 2020).These algorithms can be
classified as follows:
• 1. Optimization-based techniques (Opt): The de-
tection of the change point, when the number of
Evaluation of Change Point Detection Algorithms for Application in Big Data Mini-term 4.0
119

Figure 1: Interface to analyze the Mini-terms. A welding clamp motion Mini-term case.
change points is known, a discrete optimization
problem can be cosidered for a finite number of
examples.
• 2. Window sliding (Win): This technique is an
approximation of the Opt techniques but using a
much shorter computing time. It involves select-
ing a small number of examples, known as a win-
dow, and going through all the examples.
• 3. Binary segmentation (BinSeg): This technique
is an approximation of the Opt techniques but
using a shorter computing time. The technique
involves, when the number of change points is
known, segmenting the information in as many
groups as there are change points. Due to its
conceptual simplicity and ease of implementation,
BinSeg is one of the most widely used techniques
in the context of change point algorithms, (Truong
et al., 2019), (Truong et al., 2020).
• 4. Search methods with penalty (Pelt): This tech-
nique is usually used when the number of change
points is unknown. The intuitive (naive) way to
solve it would be to use Opt algorithms with a
high number of change points and then minimize
the penalty rate. In this way, the computing time
would be very high. Fortunately there are very ef-
ficient techniques to solve it, see (Truong et al.,
2019), (Truong et al., 2020).
6.1 Selected Change Point Algorithms
The literature offers repositories of the algorithms
programmed in the most common languages for de-
tecting the change points described above, (Truong
et al., 2019) offers the repositories programmed in R
while (Truong et al., 2020) offers them programmed
in Phyton. In this paper we work with the R reposi-
tory, (Truong et al., 2019).
Since our problem is to find a single point of
change, for the present work we have avoided algo-
rithms that look for multiple points of change. Thus,
the algorithms used in the study of this work are the
following:
• 1. Trend repository. (Opt techniques)
– 1. Pettitt’s test
– 2. Buishand Range Test.
– 3. Buishand U Test.
– 4. Standard normal Homogeneity test
• 2. strucchange repository (Opt techniques)
– 1. Fstats
– 2. efp OLS-CUSUM
– 3. efp Rec-CUSUM
– 4. efp Rec-MOSUM
• 3. cpm repository (Win and BinSeg techniques)
– 1. Student (Win, BinSeg)
– 2. Bartlett (Win, BinSeg)
– 3. GLR (Win, BinSeg)
– 4. Mann-Whitney (Win, BinSeg)
– 5. Exponential (Win, BinSeg)
– 6. Mood (Win, BinSeg)
– 7. Lepage (Win, BinSeg)
– 8. Kolmogorov-Smirnov (Win, BinSeg)
– 9. Cramer-von-Mises (Win, BinSeg)
• 3. Changepoint repository (Pelt techniques)
– 1. Change of mean with ”Normal” statistics
– 2. Change of mean with ”CUSUM” statistics
– 3. Change of variance with “Normal” statistics
– 4. Change of variance with “CSS” statistics
ICINCO 2020 - 17th International Conference on Informatics in Control, Automation and Robotics
120
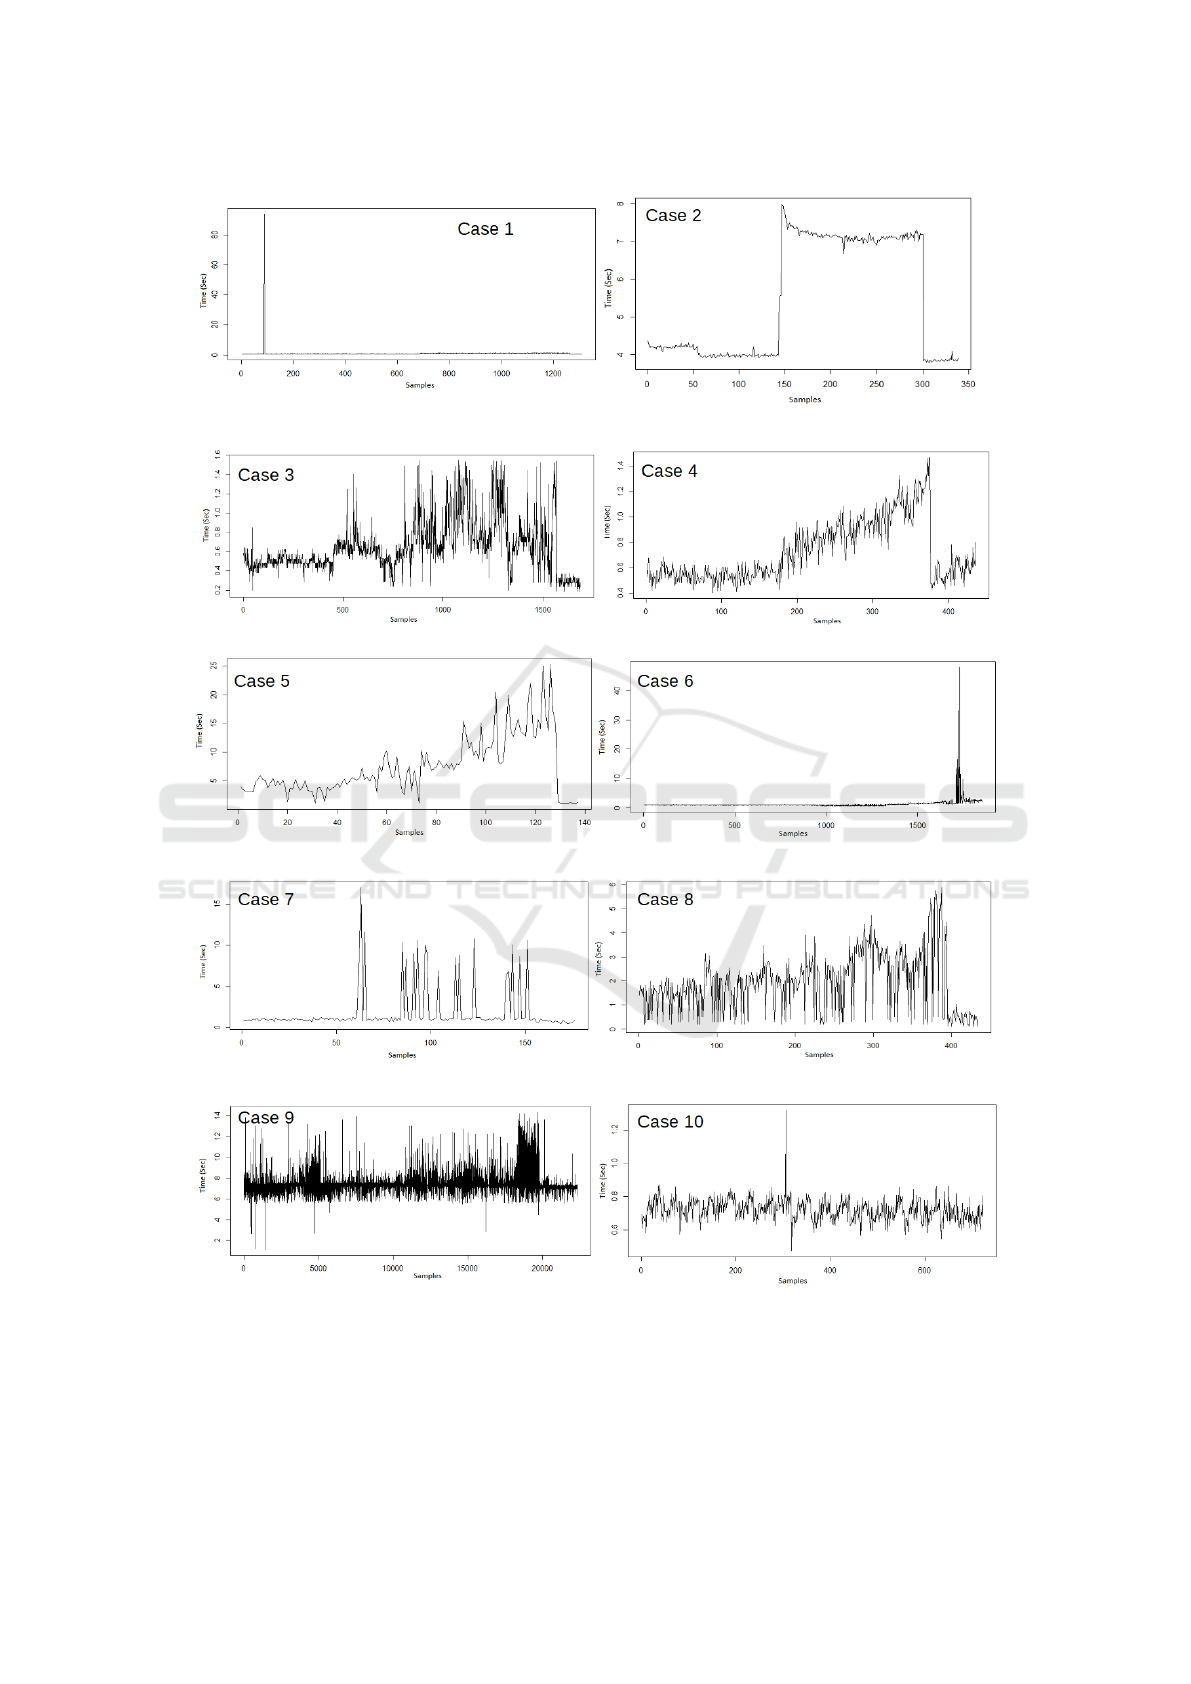
Figure 2: Selected cases at Almussafes factory by means of miniterm 4.0.
Evaluation of Change Point Detection Algorithms for Application in Big Data Mini-term 4.0
121

– 5. Change of mean and variance with “Normal”
statistics
– 6. Change of mean and variance with “expo-
nential” statistics
7 RESULTS AND DISCUSSION
In this section, the selected change point methods will
be evaluated through their application to each of the
selected cases. To evaluate the goodness of each one
of them and to be able to make a comparison, two of
the most used measures will be taken into account to
evaluate this type of methods: the Hausdorff metric
and the computation time.
7.1 Hausdorff Metric
This metric evaluates the strength of the detection
method for change points, measuring the distance be-
tween the actual position of the change point and the
prediction of the technique. There are two ways of
measuring distance, by measuring the number of ex-
amples or the time between the two points. In this
study the Hausdorff metric will be defined as follows:
H
a
=
10
∑
c=1
|P
∗
c
−
ˆ
P
c
| (1)
where H
a
is the Housdorff metric for the algorithm
a, P
∗
is the real point of change in case c y
ˆ
P is the
point of change estimated by algorithm a for case c.
The table shows 1 the location of the change point for
each case corresponding to figure 3. The change point
marked with
∗
is considered the real point of change.
It is important to consider that there are cases, such
as case 8 or 9, in which it is not trivial determining
which the real point of change is. For this reason, in
table 1 we can find more than one point marked as
optimal.
7.2 Computational Costs
The computation time of the change point algorithms
is another of the most used metrics and is one of
the most important criterias of the change point algo-
rithms. In the case of mini-terms, it is especially criti-
cal due to the large number of mini-terms that must be
sensorized, which could be millions in a factory such
as Ford’s. In the present study, the computation time
will be considered as follows:
t
a
=
10
∑
c=1
t
∗
c
(2)
where t
a
is the total time to compute the 10 cases by
using the algorithm a on a PC Intel Core i5 8600k, 6
cores, 3.6 Ghz, 16 MB RAM, 256GB SSD.
It is important to note that algorithms, which are
not capable of providing a point of change in some
cases, are discarded from the calculation of the Haus-
dorff metric and from computational time.
7.3 Discussion
As shown in table 1, the most precise change point
detection algorithm is that of Bartlett, succeeding in
all the proposed cases, followed by the mean and nor-
mal variance algorithm, giving error in only one of
the cases. From the computational point of view, the
mean and normal variance algorithm is the most effi-
cient, being able to compute the 10 cases in 0.18 sec.
Bartlett’s algorithm uses 4.02 sec. in its version (Bin-
Seg) while it uses 2.38 sec. in its version (Win). It
is important to highlight the computation time of case
9, whose time series has 24,000 data. In this case, the
Bartlett (BinSeg) uses 0.51 sec. while the (Win) ver-
sion uses 0.39 sec, in both cases Bartlett’s algorithm
offers the same results.
8 CONCLUSIONS AND FUTURE
WORKS
In the present study we have done a comparison of
the most used algorithms in the literature for the de-
tection of the change point, applied to its use in the
mini-terms. The great variability of machines and
components, together with the development of Big
data make the choice of the optimal algorithm im-
portant, both from the point of view of precision and
its processing time. The present study concludes that
the most effective detection algorithms are Bartlett’s
together with the Mean and Normal Variance algo-
rithms, being Bartlett’s algorithm the one that is right
in all cases. At computational level, both are efficient
algorithms. However, the Mean and Variance algo-
rithm is much faster. Our future work will be focused
on testing these two algorithms in Big Data miniterm
4.0 and assessing their overall effectiveness.
ACKNOWLEDGEMENTS
The authors wish to thank Ford Espa
˜
na S.L. and in
particular the Factory at Almussafes for the support
in the present research.The authors also wish to thank
Joan Camps Soria for his support in the present work.
ICINCO 2020 - 17th International Conference on Informatics in Control, Automation and Robotics
122
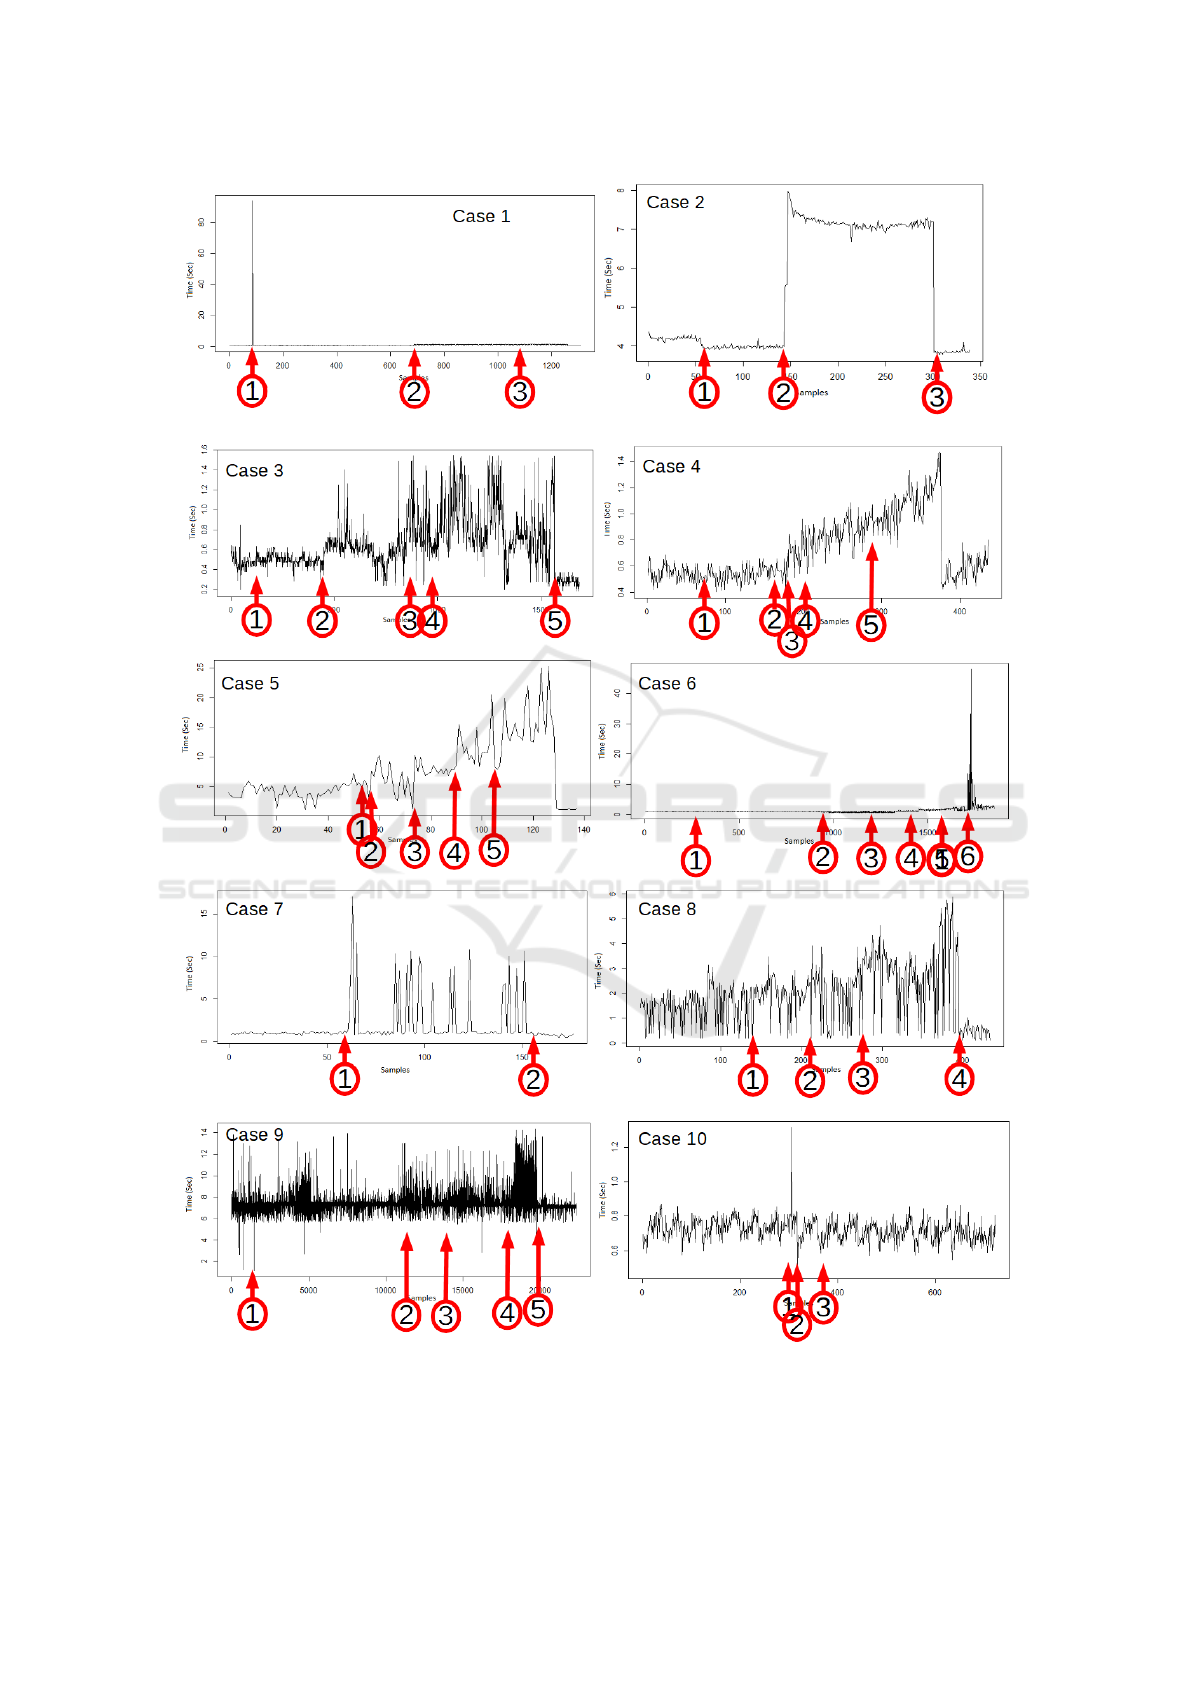
Figure 3: Change point detection for each algorithm.
Evaluation of Change Point Detection Algorithms for Application in Big Data Mini-term 4.0
123

Table 1: Numerical results for each change point method VS Case VS metric. Change point marked with an
∗
indicates that
concides with the optimal one.
Algorithm C1 C2 C3 C4 C5 C6 C7 C8 C9 C10 H t
Pettitt 2 2
∗
3 3 3 3
∗
2 1
∗
5 3 2222 1.15
Buishand R 2 2
∗
4 4 3 4
∗
1
∗
3
∗
Null 2
∗
Null Null
Buishand U 2 2
∗
4 4 3 4
∗
1
∗
3
∗
Null 2
∗
Null Null
SNHT 1
∗
2
∗
4 4 4 6 1
∗
4 Null 2
∗
Null Null
Fstats 2 2
∗
4 4 4 5 1
∗
1
∗
4
∗
2
∗
1292 111.2
Student (Win) Null 2
∗
4 4 4 6 Null 4 5 2
∗
Null Null
Bartlett (Win) 1
∗
2
∗
2
∗
2
∗
2
∗
4
∗
1
∗
2
∗
4
∗
1
∗
0 2.38
GLR (Win) 1
∗
2
∗
2
∗
3 2
∗
4
∗
1
∗
4 4
∗
2
∗
247 2.48
Exponential (Win) 1
∗
2
∗
5 3 3 5
∗
1
∗
4 Null Null Null Null
Mann-Whitney (Win) 2 3 2
∗
3 3 3
∗
2 4 5 3 2149 3.26
Mood (Win) 3 3 5 5 5 2 2 3
∗
4
∗
Null Null Null
Lepage (Win) 2 2
∗
5 3 4 4
∗
2 3
∗
5 3 2895 4.05
Kol.-Smirnov (Win) 1
∗
1 1 1 1 1 2 1
∗
1 3 12762 4.62
Cram.-von-Mises (Win) 2 2
∗
2
∗
3 3 3
∗
2 4 5 3 1962 4.66
Student (BinSeg) Null 2
∗
4 4 4 6 Null 4 5 2
∗
Null Null
Bartlett (BinSeg) 1
∗
2
∗
2
∗
2
∗
2
∗
4
∗
1
∗
2
∗
4
∗
3
∗
0 4.02
GLR (BinSeg) 1
∗
2
∗
2
∗
3 2
∗
4
∗
1
∗
4 4
∗
2
∗
247 4.15
Exponential (BinSeg) 1
∗
2
∗
5 3 3 5
∗
1
∗
4 Null Null Null Null
Mann-Whitney (BinSeg) 2 3 2
∗
3 3 3
∗
2 4 5 3 1962 4.98
Mood (BinSeg) 3 Null 5 5 5 2 2 3
∗
4
∗
Null Null Null
Lepage (BinSeg) 2 3 5 3 4 4
∗
2 3
∗
5 3 2049 5.65
Kol.-Smirnov (BinSeg) 1
∗
1 1 1 1 1 2 1
∗
1 3 12762 6.25
Cram.-von-Mises (BinSeg) 2 2
∗
2
∗
3 3 3
∗
2 4 3 3 1962 6,19
Normal Mean 1
∗
2
∗
Null Null 4 6 1
∗
4 5 Null Null Null
CUSUM Mean 2 2
∗
4 4 3 4
∗
1
∗
1
∗
2 2
∗
6047 0.18
Normal Variance 1
∗
2
∗
4 5 5 6 1
∗
3
∗
4
∗
Null Null Null
Variance CSS 1
∗
2
∗
4 4 4 6 1
∗
3
∗
3 2
∗
3892 0.18
Normal Mean and Variance 1
∗
2
∗
2
∗
3 2
∗
4
∗
1
∗
4 4
∗
2
∗
247 0.13
Exp. Mean and Variance 1
∗
2
∗
5 3 3 5
∗
1
∗
4 Null Null Null Null
REFERENCES
A.K.S.Jardine, D.Lin, and D.Banjevic (2006). A review on
machinery diagnostics and prognostics implementing
condition-based maintenance. Mechanical Systems
and Signals processing, 20(7):1483–1510.
E.Garcia (2016). An
´
alisis de los sub-tiempos de ciclo
t
´
ecnico para la mejora del rendimiento de las l
´
ıneas
de fabricaci
´
on. PhD.
E.Garcia and N.Montes (2017). A tensor model for au-
tomated production lines based on probabilistic sub-
cycle times. Nova Science Publishers, 18(1):221–234.
E.Garcia and N.Montes (2019). Mini-term, a novel
paradigm for fault detection. 9th IFAC Conference on
Manufacturing Modelling, Management and Control,
52-13:165–170.
E.Garcia, N.Montes, and M.Alacreu (2018). Towards
a knowledge-driven maintenance support system for
manufacturing lines. International COnefrence on In-
formatics in Control, Automation and Robotics, pages
499–511.
L.Li, Q.Chang, and J.Ni. (2009). Real time production im-
provement through bottleneck control. International
Journal of production research, 47(21):6145–6158.
Truong, C., L.Oudre, and N.Vayatis. (2019). A review of
change point detection methods. Archiv. org. Cornell
University.
Truong, C., L.Oudre, and N.Vayatis. (2020). Mini-term, a
novel paradigm for fault detection. Signal Processing,
167:107–299.
X.Zhao (2014). Localized structural damage detection: A
change point analysis. Computer-Aided Civil and In-
frastructure Engineering, 29:416–432.
X.Zhao (2018). Optimal replacement policies for a shock
model with a change point. Computers & Industrial
Engineering, 118:383–393.
ICINCO 2020 - 17th International Conference on Informatics in Control, Automation and Robotics
124
