
A Malaria Control Model using Mobility Data: An Early Explanation of
Kedougou Case in Senegal
Lynda Bouzid Khiri
1
, Ibrahima Gueye
3
, Hubert Naacke
1
, Idrissa Sarr
2
and Stéphane Gancarski
1
1
Sorbonne Université, Laboratoire d’Informatique de Paris 6, LIP6, F-75005, France
2
Cheikh Anta Diop University, Department of Mathematics and Computer Science, Fann BP, 5005, Dakar, Senegal
3
Ecole Polytechnique de Thiès, LTISI, Senegal
Keywords:
Malaria Control, Mobility Model, Discrete Simulation, Data Analysis.
Abstract:
Studies in malaria control cover many areas such as medicine, sociology, biology, mathematics, physics,
computer science and so forth. Researches in the realm of mathematics are conducted to predict the occurrence
of the disease and to support the eradication process. Basically, the modeling methodology is predominantly
deterministic and based on differential equations which take into account important clinical and biological
features. Yet, if the individual characteristics matter when modeling the disease, the overall estimation of the
epidemic evolution relies on a non-specified percentage of the global population : it is not based on the state
of health of each individual. The goal of this paper is to propose a model that relies on a daily evolution of
the individual’s state, which depends on their mobility and the characteristics of the area they visit. Thus,
the mobility data of a single person moving from one area to another, gathered thanks to mobile networks,
is the essential building block to predict the disease outcome. We implement our solution and demonstrate
its effectiveness through empirical experiments. The results show how promising the model is in providing
possible insights into the failure of the disease control in the Kedougou region.
1 INTRODUCTION
Human malaria is caused by infection by the Plas-
modium falciparum and four other species of par-
asites, leading to almost 600,000 deaths and 100–
250M febrile episodes annually WHO Inc. (2016).
Even though the disease has been investigated for
hundreds of years, it still remains a major pub-
lic health problem in Sub-Saharan Africa (SSA)
where about 90% of malaria cases were reported in
2017 WHO Inc. (2016).
Many SSA countries have set the goal of eliminat-
ing malaria for the upcoming decades outbreaks Ruk-
tanonchai et al. (2016). Among these countries, Sene-
gal has initiated its National Program Against Malaria
(PNLP) du Sénégal (2017). Besides a weekly follow-
up of the disease evolution, the PNLP has allowed
to intensify the coverage of key malaria interventions
over the country in terms of impregnated mosquito
nets, insecticide (ITN), indoor residual spraying, pre-
ventive treatment by intermittent administration to
women intestines (TPI), rapid diagnostic tests (RDTs)
and therapeutic combinations based on Artemisinin
(CTA) Thiam et al. (2011). Those strategies have
lowered the malaria incidence (relative number of in-
fected people for 1000 inhabitants) to a relative small
number estimated to 25 in 2017. However, the south-
eastern part of the country (Kedougou region along-
side Kolda and Tambacounda) accounts for 75% of
malaria cases and 45% of malaria-related deaths. Spe-
cially, the malaria incidence was estimated to 429 in
2017 for Kedougou while the other regions of Sene-
gal had an average incidence below 10. Such sit-
uation on Kedougou reveals the weaknesses of the
overall strategies taken to face the disease, and why
malaria pre-elimination remains a crucial problem in
the country. In this work, we investigate Kedougou
case to show forgotten aspects in antimalarial policies
and to demonstrate that more efficient actions should
be considered.
Actually, Kedougou is the largest city in south-
eastern Senegal 700 km away from Dakar which is
the capital. Kedougou has a dry tropical climate, with
an average annual rainfall over 1000 mm, spread over
a rainy season that lasts from May to November. It is
a mainly agricultural region with the cultivation of ce-
reals (rice, corn, sorghum, millet, fonio ...) and many
forest fruit species including mango, shea, palm, etc.
Khiri, L., Gueye, I., Naacke, H., Sarr, I. and Gancarski, S.
A Malaria Control Model using Mobility Data: An Early Explanation of Kedougou Case in Senegal.
DOI: 10.5220/0009591800350046
In Proceedings of the 10th International Conference on Simulation and Modeling Methodologies, Technologies and Applications (SIMULTECH 2020), pages 35-46
ISBN: 978-989-758-444-2
Copyright
c
2020 by SCITEPRESS – Science and Technology Publications, Lda. All rights reserved
35

Figure 1: Kedougou region with its 3 departments.
Moreover, it offers a variety of natural attractions in-
cluding those of the Niokolo Koba national park, the
hills where trekking activities are practiced and the
Dindefelo waterfall. The discovery of deposits of ura-
nium, granites, marble and other ornamental rocks,
but also industrial minerals such as phosphate and
kaolin ranks Kedougou as a cornerstone mining re-
gion. All these characteristics, along with its proxim-
ity to Mali and Guinea make Kedougou a true cross-
roads all over the year, which leads to a strong hu-
man mobility rate. As shown in the Figure 1, the re-
gion of Kedougou is divided into three departments,
namely, Salemata with 14.6 % of the population, Ke-
dougou department that shelters 51.9% and Saraya,
33.5% ANSD (2013). As depicted on the map, Ke-
dougou department is on the center of the region and
hosts the main infrastructures such as markets, health
centers, and so on. This geo-administrative division
raises an intra-mobility rate of individuals within Ke-
dougou region.
As a conclusion, Kedougou region is character-
ized by two types of mobility : an intra-mobility for
daily or weekly needs of permanent residents, and an
extra mobility at the country and the west African
community level. Our goal is to provide tools high-
lighting the negative incidence of these mobility pat-
terns on the malaria disease.
Some statistical data from the PNLP and related to
Kedougou region du Sénégal (2017) are used to plot
the Figure 2, that shows the variation of new malaria
cases over 24 months, i,e,. from January 2016 to De-
cember 2017. The first observation is that the number
of cases raises drastically just after the beginning of
the rainfall season (each year on June, months 6 and
18) and decreases with the end of the rainy annual pe-
riod (on September, months 9 and 21). This situation
is explained by the fact that mosquitoes population is
growing faster during rainy seasons. Therefore, since
weather conditions are similar over two successive
years, we almost observe the same seasonal trend.
However, when looking deeper at the three curves,
we find out that the epidemic of the three departments
are not similar. First of all, the different peaks of
Figure 2: The Variation of malaria between Jan. 2016 and
Dec. 2017.
the malaria cases in each departments do not occur
at the same time and are actually staggered by a few
weeks. Moreover, we note that the epidemic in Saraya
lasts longer than the ones in Kedougou or Salemata
even though the three departments have similar cli-
matic conditions. Thus, rainfalls do not fully explain
the spread of the epidemic over 6 months. Still, we
know that there is a lot of movement towards the
zone (trade and mining with other border countries).
Also, it has been demonstrated that human mobil-
ity has an impact on malaria control and elimination
Gharbi et al. (2013); Ruktanonchai et al. (2016) and
even in malaria-free countries Dharmawardena et al.
(2017). Bearing this in mind, it makes sense to relate
the epidemic outbreak of a given area to the arrival of
outsiders who have been exposed in other areas dur-
ing different periods. Surprisingly, despite the strong
sustained mobility around the Kedougou region, the
PNLP does not include human movements in its con-
trol strategies yet.
We make the assumption that the arrival of in-
fected people in a given area makes the epidemic to
last longer. The impact on the epidemic extension de-
pends on the arrival date of new people and the epi-
demic state of the area they come from. Our goal is to
demonstrate that this assumption is plausible through
a mathematical model. In fact, mathematical mod-
els have been frequently used in related works about
malaria control Chitnis et al. (2006); Dimitrov and
Meyers (2010); Mandal et al. (2011); Chitnis et al.
(2008); Arthur (2017); Ruktanonchai et al. (2016);
Greenwood et al. (1991); Gu et al. (2003a); Koella
(1991); Filipe et al. (2007); Lechthaler et al. (2019).
Existing models consider different parameters and as-
pects that influence the disease dispersal, such as het-
erogeneity, immunity, recovery time and more re-
cently, human mobility. However, the models with
human mobility only deal with the movement of peo-
ple through a coarse grain approach, which assumes
a global migration ratio from an area to another one.
Rather, a finer grain approach can be used thanks to
personalized geo-position information (GPS coordi-
nates) from mobile phones. Such a finer approach al-
SIMULTECH 2020 - 10th International Conference on Simulation and Modeling Methodologies, Technologies and Applications
36

lows a better understanding of the disease evolution at
each time, on each area. Therefore, it helps to deter-
mine the antimalarial actions in a more dynamic and
efficient fashion.
The main contributions of this paper can be sum-
marized as follow:
• We define a mathematical model that takes into
account individual mobility and immunity. To this
end, we assume that we have real-time data from
mobile devices allowing to establish the mobility
pattern of everyone, and his(her) state wrt. the
malaria (ill or not). Hence, we build a discrete
model that mainly differs from existing works by
the fact that the global status of a given space is
obtained by aggregating the health status of each
individual.
• We implement a simulation software with respect
to climatic conditions and human movements over
time. The software is designed so that the relevant
parameters of the disease can be adjusted accord-
ing to the real life situation of a given area.
• We conduct a set of experiments to validate our
approach while we point out many benefits of our
solution in terms of explaining the disease evolu-
tion in areas like Kedougou. To this end, we rely
on synthetic data according to realistic scenarios
since real-time data are not available yet. We
show the impact of different factors (characteris-
tics of areas, mobility and state of individuals) on
the malaria propagation. This allows for measur-
ing the impact of malaria control actions (eradica-
tion, prevention) in an accurate way, which helps
deciding which actions should be prioritized.
2 BACKGROUND
Mathematical models have been used to predict the
occurrence of a disease and to control its dispersal.
Basically, the modeling methodology is mainly de-
terministic and based on differential equations while
selecting clinical and biological features that seem
to be important Greenwood et al. (1991); Chitnis
et al. (2006, 2008); Arthur (2017); Ruktanonchai et al.
(2016). The first models that were developed examine
the interaction of human, vectors and parasites with
a coarse granularity, for instance, at the city/country
level Mandal et al. (2011). More recent models have
attempted to handle heterogeneity such as the individ-
ual immunity Gu et al. (2003a); Filipe et al. (2007),
the space and contact network Parham and Ferguson
(2006), the recovery rate Gu et al. (2003b), etc. A re-
cent work integrates human mobility data Ruktanon-
chai et al. (2016) for explaining and eliminating the
disease in a particular area.
One of the first model, known as the classical
"Ross model", was developed by Sir Ronald Ross
who explained the relationship between the number of
mosquitoes and incidence of malaria in humans Ross
(1911). In such a model, the population is divided
into several compartments which represent health sta-
tuses regarding the pathogen. These statuses or com-
partments are represented by the standard notation S-
E-I-R, based on the work presented in Kermack and
McKendrick (1927). The S class stands for the frac-
tion of host population that is susceptible to infection,
while the E category indicates the fraction of popu-
lation whose individuals have been infected but are
not infectious yet due to a latency period. The I class
represents infectious individuals who may infect other
individuals through interactions with mosquitoes. Fi-
nally, the R class portrays individuals who have re-
covered from the infection. Notice that sometimes,
R may include individuals who have recovered with
temporary or permanent immunity. With these dif-
ferent classes, one may observe eight possible mod-
els: SIS, SEI, SEIS, SIR, SIRS, SEIR and SEIRS. Note
that both mosquito and host population may be related
with these compartments in a malaria disease case.
That is, the malaria transmission model is described
along two aspects, one representing humans and the
other representing mosquitoes. However, a mosquito
can not recover from being infected, so its infective
period ends with its death.
3 DISCRETE MALARIA MODEL
As we pointed out earlier, we aim at integrating
user mobility information into a malaria transmission
model. The reason behind this is that knowing the
mobility and state of each individuals allows for as-
sessing the specific persons that diffuse the disease
instead of finding a proportion of population as done
by existing models. In this sense, our approach differs
to others by the fact that we estimate the probability
of each individual to be part of one class (SEIR), and
therefore, we deduce the global population that be-
long to each class at each time unit.
3.1 Global Model Overview
We assume a multi-patches area where each patch has
a specific configuration to impact the malaria disease
propagation. Individuals can move from one patch
to another while mosquitoes are set to stay in only
one patch. To model the transmission, we extend the
A Malaria Control Model using Mobility Data: An Early Explanation of Kedougou Case in Senegal
37
SEIRS-SEI model proposed in Chitnis et al. (2008)
by introducing patches and individuals data mobil-
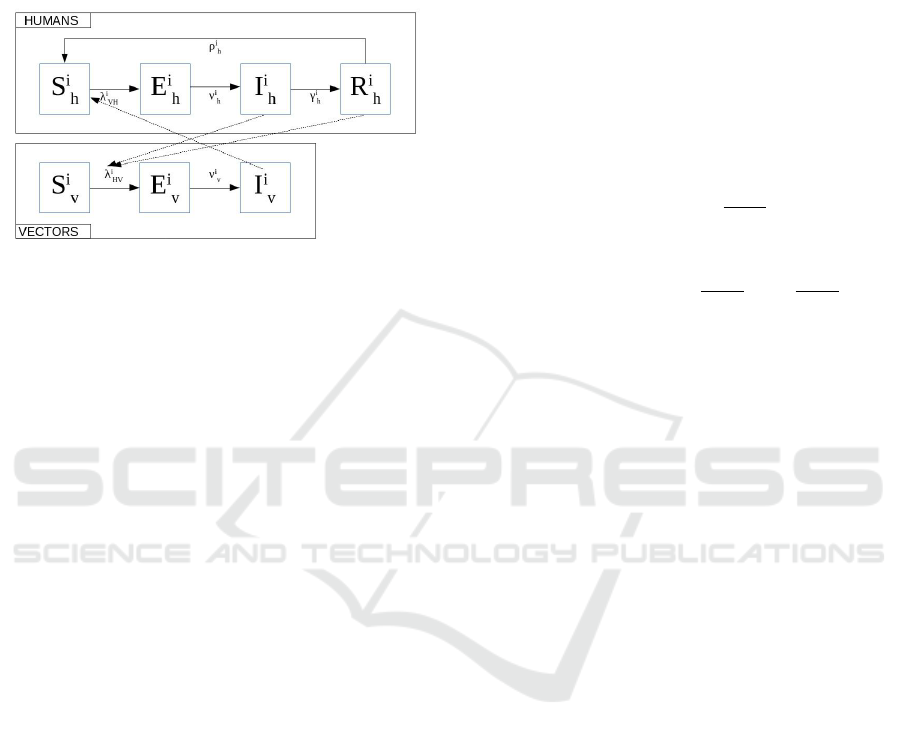
ity. Fig. 3 shows the proposed malaria transmission
model. Solid arrows denote intra-species progression
into classes while dotted arrows denote inter-species
transmission. With this model, for each patch i the
Figure 3: Malaria model in patch i Chitnis et al. (2008).
human population is divided into four classes: sus-
ceptible S
i
h
, exposed E
i
h
, infectious I
i
h
, and recovered
(partially and/or temporary immune) R
i
h
. Moreover,
mosquitoes population is divided into three classes :
susceptible S
i
v
, exposed E
i
v
, infectious I
i
v
. We assume
a constant population (i.e., birth rate equals death
rate). Initially, all individuals are in the susceptible
class except a low percentage that live with the par-
asites. This situation is realistic in a context where
the malaria parasite is still present. Basically, a pro-
portion of the susceptible individuals that move from
the S to the E class due to mosquito bites is charac-
terized by the force of infection (FoI) λ
i
vh
. Among ex-
posed individuals, there is a proportion ν
i
h
that enter
to the infectious class. ν
i
h
depends on a time period,
called an intrinsic incubation period, which depends
on the parasite species (i.e., Plasmodium falciparum).
Later on (approximately a couple of weeks), a part
of infectious humans (γ
i
h
ratio) recover and join the
R class where they may acquire a certain immunity
to the disease and do not get clinically ill. However,
they still host low amount of parasites and can trans-
mit the infection to mosquitoes with a low rate. Over
the time, the immunity of individuals vanishes and a
some of them (ρ
i
h
ratio) return to the S class. Regard-
ing the mosquitoes population, the same flowchart is
observed with only three classes. It is worth noting
that the mosquitoes FoI (λ
i
hv
) differs from humans’
FoI, so does the incubation period of mosquitoes and
humans. The main parameters of the model are di-
vided into two categories: patch parameters and in-
dividual parameters. In the following, we present a
short overview of these parameters.
3.2 Dealing with Patch and Individual
Characteristics
3.2.1 Patch Characteristics
Since our model is discrete, we define the transmis-
sion in patches at a given time step t. For each patch
i, we use almost the same parameters as described in
Chitnis et al. (2008) while adapting them to a multi-
patches context (see Table 1 for parameters details).
After identifying the required parameters, we de-
fine the vector-to-human FoI (λ
i
vh
) and human-to-
vector FoI (λ
i
hv
) in a patch as follows :
λ
i
vh
(t + 1) = b
i
h
(t)β
i
vh
I
i
v
(t)
N
i
v
(t)
(1)
λ
i
hv
(t + 1) = b
i
v
(t)(β
i
hv
I
i
h
(t)
N
i
h
(t)
+
˜
β
i
hv
R
i
h
(t)
N
i
h
(t)
) (2)
3.2.2 Individual Mobility Characteristics
We distinguish residential patches (cities or districts)
to ad-hoc meeting patches. Meeting patches (P
M
) are
sparsely populated and used as headquarter for social
events while residential patches (P
R
) are densely pop-
ulated but not attractive for social meetings. Having
this in mind, one may deduce that people more of-
ten move from P
R
to P
M
than from P
R
to P
R
. We as-
sume that each individual is identified thanks to mo-
bile applications and/or Telecommunication compa-
nies. Users data are anonymised in such a way that
personal details are hidden while geographical posi-
tions of anonymous individuals are known at each
time. We consider a sequence of consecutive time
windows of equal duration. At anytime, the patch
of an individual h
j
and how long he stays there are
known. For instance, on Figures 4a and 4b, human h
j
stayed during w
1
j
time in p
1
, w
2
j
in p
2
, and so on.
For individual h
j
, his probability of being exposed
is a function of his status and FoI, which depends on
his mobility as well as his immunity. Basically, the
FoI of an individual is the sum of the FoI of each vis-
ited patch i weighted by its time presence in i :
λ
h, j
(t) =
N
∑
i=1
w
i
j
(t) λ
i
vh
(t) (3)
Finally, the likelihood to get exposed of h
j
at time t +
1 is : pe
j
(t + 1) = pe
j
(t) + λ
h, j
(t)(1 − pe
j
(t)). Once
an individual is exposed, the incubation, development
and recovery process are a matter of time. Basically,
an exposed human has a likelihood to get infected and
to recover after a certain period. Details of parameters
SIMULTECH 2020 - 10th International Conference on Simulation and Modeling Methodologies, Technologies and Applications
38
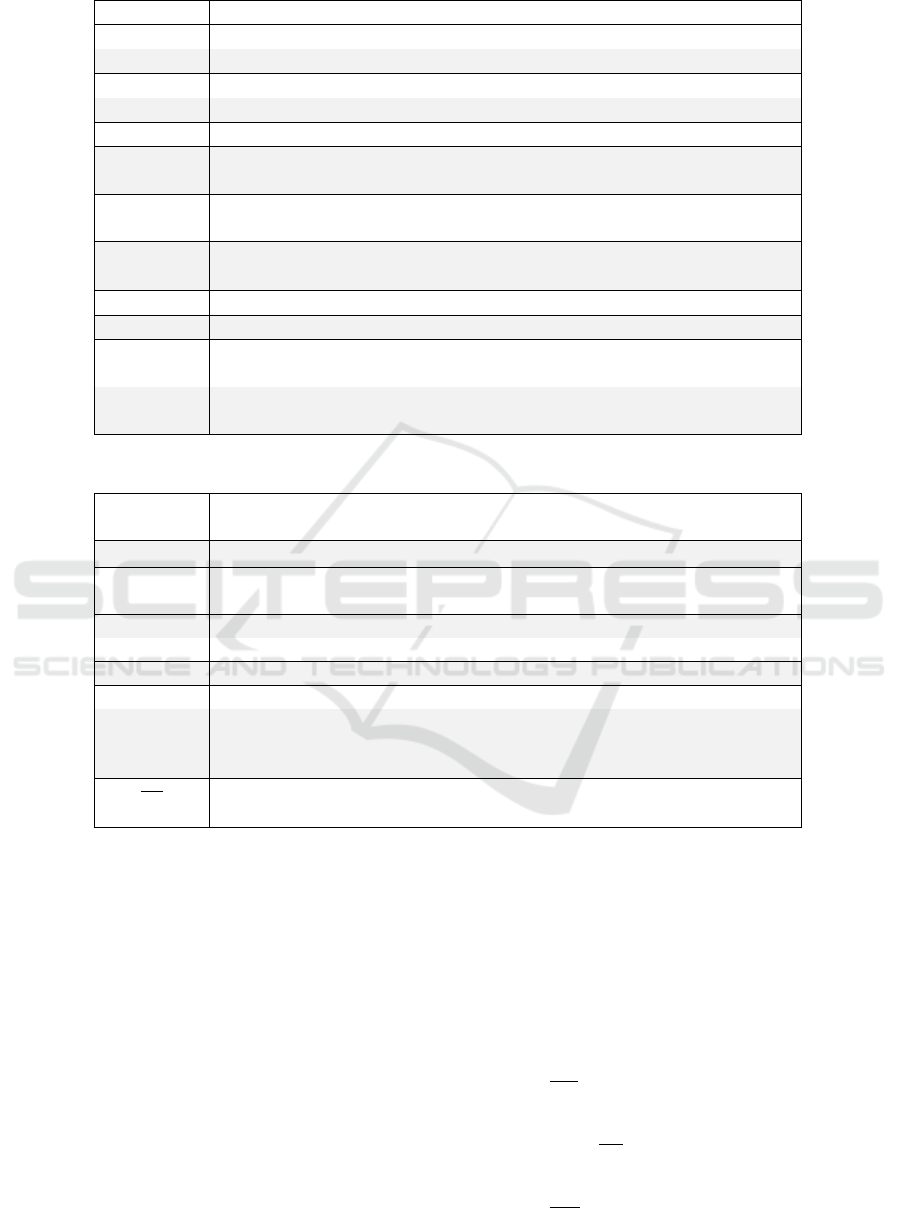
Table 1: Patches Parameters.
Parameter Description
N
i
h
(t) Human population in patch i at time t
N
i
v
(t) Vector population in patch i at time t
I
i
v
(t) Infected mosquitoes in patch i at time t
I
i
h
(t) Infected humans in patch i at time t
R
i
h
(t) Infected individuals in patch i that recover at time t
β
i
hv
Probability that an infectious person infects a susceptible mosquito dur-
ing a contact within the patch i
β
i
vh
Probability that an infectious mosquito infects a susceptible individual
during a bite in patch i
˜
β
i
hv
Probability that a recovered person infects a susceptible mosquito dur-
ing a contact in patch i
b
i
h
(t) Proportion of bites per human per unit time t in patch i
b
i
v
(t) Proportion of bites per mosquito per unit time t in patch i
λ
i
vh
Force of infection from vector to human in patch i, i.e., measure of how
likely a human get exposed in patch i
λ
i
hv
Force of infection from human to vector in patch i, i.e., measure of how
likely a mosquito get exposed in patch i
Table 2: Individual Parameters for a given time window.
Parameter Description
h
j
Identification of the individual j
w
k
j
Visiting ratio of time that h
j
spends in patch k.
S
h, j
(t) Susceptible state variable of h
j
at time step t (1 if susceptible 0 other-
wise)
E
h, j
(t) Exposed state variable of h
j
at time step t (1 if exposed 0 otherwise)
I
h, j
(t) Infected state variable of h
j
at time step t (1 if infected 0 otherwise)
R
h, j
(t) Recovered state variable of h
j
at time step t (1 if recovered 0 otherwise)
pe
j
(t) Probability that individual h
j
(being in class S) moves to class E
ν
h, j
incubation period (without symptoms). In the case of P. falciparum par-
asite, which predominates in Senegal, it varies from 9 to 10 days Chitnis
et al. (2008); for Disease Control and Prevention (2015).
1
γ
h, j
is the infectious period (Chitnis and Al. have set it at 9.5 months Chitnis
et al. (2008))
for calculating the transition over the classes SEIR are
described in Table 2.
After defining FoI of individuals, we identify at
each time the new exposed ones, and apply the model
to get the class of the other individuals. With the
above parameters, we aggregate individual informa-
tion to get patch-level information. The human pop-
ulation over the different classes is defined for each
patch and each time period, as follows :
S
i
h
(t) =
M
∑
j=1
w
i
j
(t) S
h, j
(t) (4)
E
i
h
(t) =
M
∑
j=1
w
i
j
(t) E
h, j
(t) (5)
I
i
h
(t) =
M
∑
j=1
w
i
j
(t) I
h, j
(t) (6)
R
i
h
(t) =
M
∑
j=1
w
i
j
(t) R
h, j
(t) (7)
The variation of mosquitoes population over the
classes is the same as described in Chitnis et al. (2008)
:
dS
i
v
dt
= ψ
i
v
N
i
v
− λ
i
hv
(t)S
i
v
− f
i
v
(N
i
v
)S
i
v
(8)
dI
i
v
dt
= ν
i
v
E
i
v
− f
i
v
(N
i
v
)I
i
v
(9)
dE
i
v
dt
= λ
i
hv
(t)S
i
v
− ν
i
v
E
i
v
− f
i
v
(N
i
v
)E
i
v
(10)
A Malaria Control Model using Mobility Data: An Early Explanation of Kedougou Case in Senegal
39
(a) Individuals visiting different
patches
(b) Mobility pattern of an individual
Figure 4: Human mobility and Patches
where f
i
v
(N
i
v
) = µ
i
1v
+ µ
i
2v
N
i
v
is the per capita density-
dependent death rate for mosquitoes in the patch i
Chitnis et al. (2006).
It is worth noting that our model is computed in an
incremental way. After each time step, we update the
information describing patches and individuals (i.e.,
FoI and health status) since they are used as input for
the next time step.
4 IMPLEMENTATION AND
VALIDATION
4.1 Experimental Setup
We implemented our approach using the version
2.7.15 of Python through Spyder IDE 3.2.6 on Linux.
We rely on Jupyter for visualization and share the
source code of our implementation
1
. All the parame-
ters about individuals and patches we used to imple-
ment the model are detailed in section 3.2. We re-
call that most of these parameters values have been
reported in the literature.
We consider two patches : the residence zone P
R
and the meeting one P
M
, with their respective hu-
man population |P
R
| and |P
M
|, their respective vector
(mosquito) population NV
R
and NV
M
and the propor-
tion p of human traveling from P
R
to P
M
. We observe
I
R
, the number of infected persons in P
R
. Table 3 sum-
marizes the parameters used in the experiments.
4.2 Experimental Objectives and
Method
The overall goal of the validation is to investigate the
benefit of individual mobility for malaria control. We
intend to show that taking into account individual mo-
bility allows for a more accurate modeling of the dis-
ease evolution over time and space (i.e., patches). We
aim to simulate disease evolution which cannot be
captured by existing models that are unaware of in-
dividual mobility. Precisely, we evaluate the gain of
our approach in three different aspects:
1. The impact of individual mobility on the estima-
tion of infected individuals.
2. The relevance of the proposed model to approxi-
mately match recently reported real cases.
3. The vector control opportunities based on individ-
uals movements and patches characteristics.
4.2.1 Size of the Vector Population over Seasons
In this section, we only consider the P
R
patch, thus we
omit the R indice in the notations. To be as close as
possible to what happens in the real world, we vary
the population of (mosquito) vectors according to the
two main seasons occurring in the Kedougou region:
• the rainy season (approximately from start of June
to the end of November)
• the dry season (the remaining 6 months).
The number of mosquitos grows wrt. a daily birth
rate (ψ, see Section 3). This birth rate still grows and
reaches a stationary value when the rainy season set-
tles definitively. Indeed, the mosquito birth rate is
correlated with the amount of wet place (reproduc-
tion areas). All potential wet places are full of wa-
ter when the rainy season is in full swing. Thus, we
assume that during the rainy season the total size of
1
www-bd.lip6.fr/wiki/site/recherche/projets/m4e/start
SIMULTECH 2020 - 10th International Conference on Simulation and Modeling Methodologies, Technologies and Applications
40
Table 3: Experimental parameters.
name description value
P
R
the residential patch
|P
R
| the number of individuals in P
R
3000
NV
R
the number of vectors in P
R
Varying
P
M
the meeting patch
|P
M
| the number of individuals in P
M
1000
NV
M
the number of vectors in P
M
Varying
p the ratio of moving individuals (p > 0) [0.1, 0.4]
I
R
the number of infected individuals in P
R
[0, 3000]
ψ vector birth rate 0.03
µ vector death rate [0.03, 2E-8]
these wet areas remains almost constant therefore the
vector population NV
max
remains almost constant.
Then, at the end of the rainy season, the vector
population is gradually decreasing up to the dry sea-
son ceiling (i.e., a rather small number that makes the
epidemic to stop itself). The death rate (µ see Table 3)
is based on the average life duration of a vector (30
days).
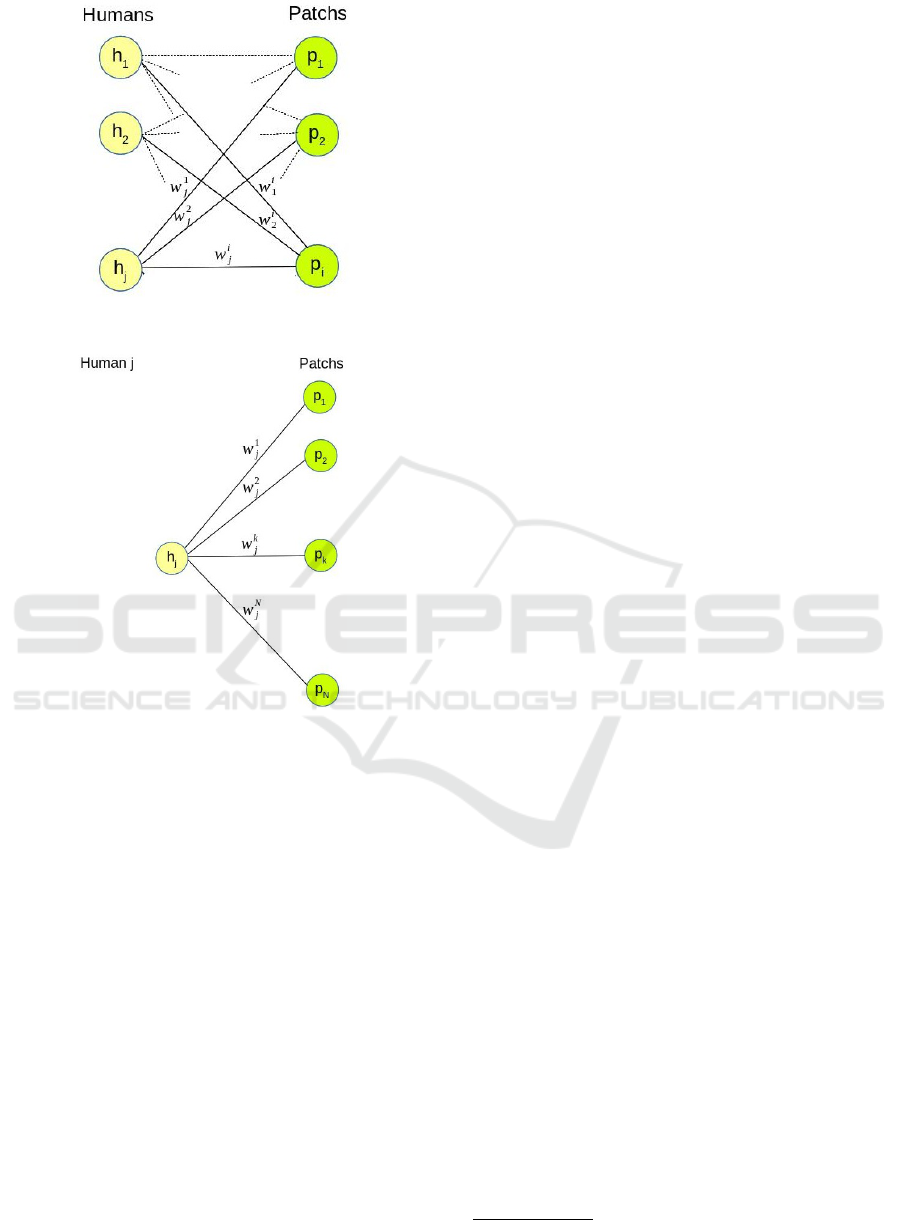
Figure 5(a) plots the number of vectors over time
during one year for the residential patch, with differ-
ent characteristics in terms of wet areas. For instance,
in the first case (N V = 400) the vector population is
20 times higher than during the dry season, whereas
in the last one, (NV = 1000) it is 50 times higher.
This allows for simulating areas with different charac-
teristics in terms of wet areas and therefore in terms
of vectors population growth. Note that these areas
are located in the same region thus have similar rainy
seasons (from June to November).
To figure out the effect of the rainy season on the
disease, we compute the number of newly infected in-
dividuals in P
R
patch when everyone remains seden-
tary (i.e., no mobility). Figure 5(b) reports the results
for the 4 patches from Figure 5(a). In the first patch
(Nv = 400) there is almost no disease while in the 3
other ones, the peak disease grows for patch having
more vectors. We use these preliminary simulations,
to set the maximal number of vectors (dented Nv
max
)
that a residential and meeting patch have in the subse-
quent experiments. This allows us to define a low en-
demicity residential patch (Nv
max
= 400) and a higher
endemicity meeting patch (Nv
max
= 1000)
4.3 Impact of Individual Mobility
The goal of this section is to quantify the impact of
individual mobility in modeling malaria. Based on the
Kedougou case (cf. Section 1), we consider a village
of farmers that sell their products at a remote market.
Basically, there are two patches: a residential place P
R
and a market place P
M
. There are 3000 people living
(a) NV max varying from 400 to 1000.
(b) # new exposed indiv. vs. NV max.
Figure 5: Impact of the maximum number of vectors
(NV
max
) on the disease.
in P
R
. Among them, a group of people (which size
ratio is p relative to P
R
population) moves everyday
from P
R
to P
M
and come back home.
A Malaria Control Model using Mobility Data: An Early Explanation of Kedougou Case in Senegal
41
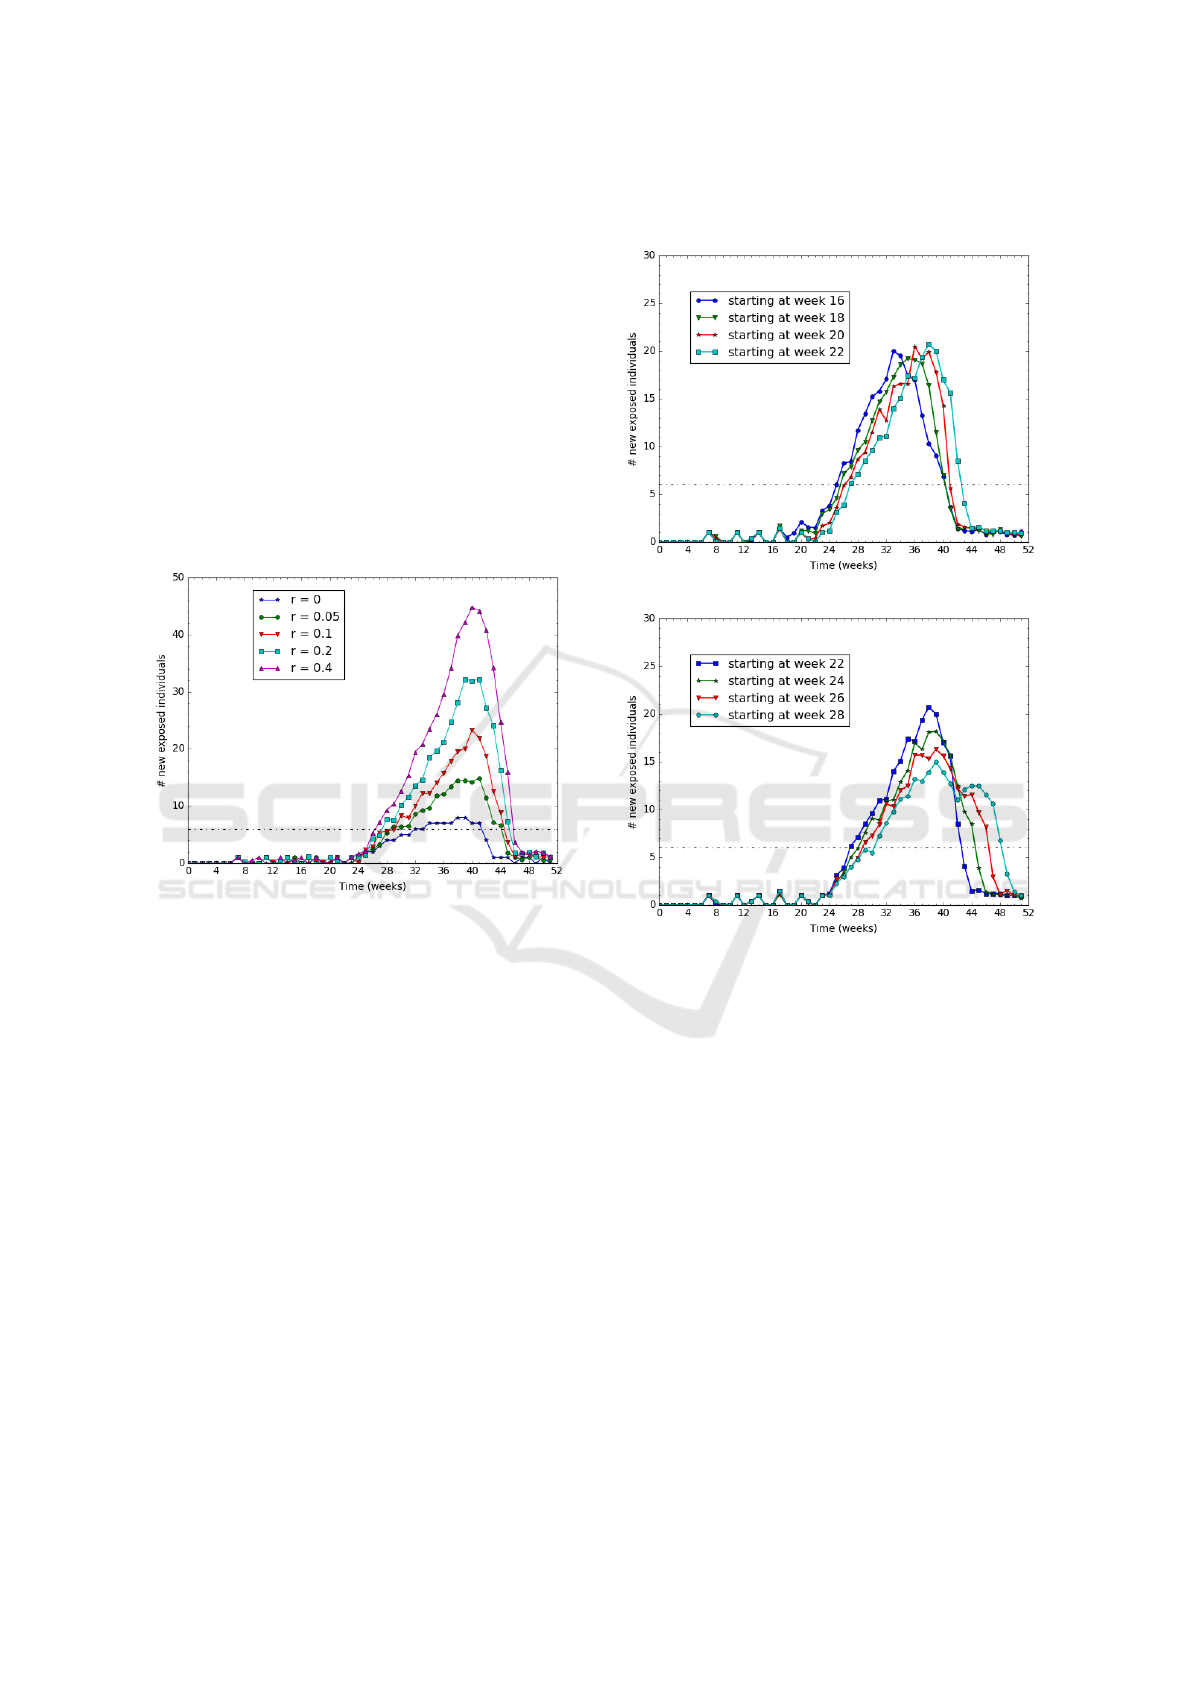
4.3.1 Varying the Mobility Rate
The goal of this experiment is to assess the impact of
the mobility on the disease evolution. First, we define
the mobility rate r as the ratio of people moving from
P
R
to P
M
. Then we investigate how the number of
exposed individuals, E(r), evolves over time for var-
ious mobility rates. To this end we vary the mobility
rate, r, from 0% to 40%. On Figure 6, we report the
number of newly infected individuals per week.
The dashed black line indicates the threshold limit
of exposed people. Above this threshold, the disease
is qualified as an epidemic situation. The threshold
value is set to 6 new cases per week according to real
observations reported in Kedougou during years 2016
and 2017 du Sénégal (2017).
Figure 6: Varying the mobility rate r from 0 to 40%.
We observe on Figure 6 that the higher the mov-
ing rate, the higher the epidemic and longer is the
epidemic duration too. For example, when nobody is
moving (r=0), the epidemic lasts 8 weeks with 7 new
cases per week; whereas for a moving rate of 10%,
it lasts 16 weeks and reaches a peak of 25 cases per
week.
4.3.2 Early/Late Rainy Season in the Meeting
Patch P
M
In case the mobility patch and the residential patch
have slightly different raining seasons, this could have
an impact on the epidemic duration.
In this section, we study the impact of having a
rainy season in P
M
that does not start exactly at the
same time as in P
R
. The rainy season in P
R
lasts
from week 22 to week 38 (i.e., 16 weeks from June
to September). The P
M
rainy season lasts as long as
the P
R
one but it starts before or after week 22. The
mobility pattern is set to 20 % mobile individuals that
go to P
M
every day for half of their time. We report on
Figure 7 the number of exposed individuals for sev-
eral starting dates of the P
M
rainy season.
(a) Starting in P
M
earlier than in P
R
.
(b) Starting in P
M
later than in P
R
.
Figure 7: Varying the starting date of the rainy season in
P
M
.
The results show that the epidemic lasts longer on
Figure 7(b) than on Figure 7(a). That is, it lasts longer
when the rainy season starts in P
M
later than in P
R
.
The extra time duration (between 2 and 6 weeks as
reported in Figure 7(b)) of the epidemic corresponds
to the rainy season starting time gap between the two
patches.
4.3.3 Varying the Mobility Starting Date
In this experiment, we vary the starting date (before
this date, nobody moves) from t=0 (beginning of the
year) to t=40 (late October). We want to investigate
the impact of seasonal migration on the development
of the disease. Intuitively, we expect a greater im-
pact when the migration occurs during the rain season
which has the highest vector population. Such migra-
tions are usual in the Kedougou region, where there
SIMULTECH 2020 - 10th International Conference on Simulation and Modeling Methodologies, Technologies and Applications
42
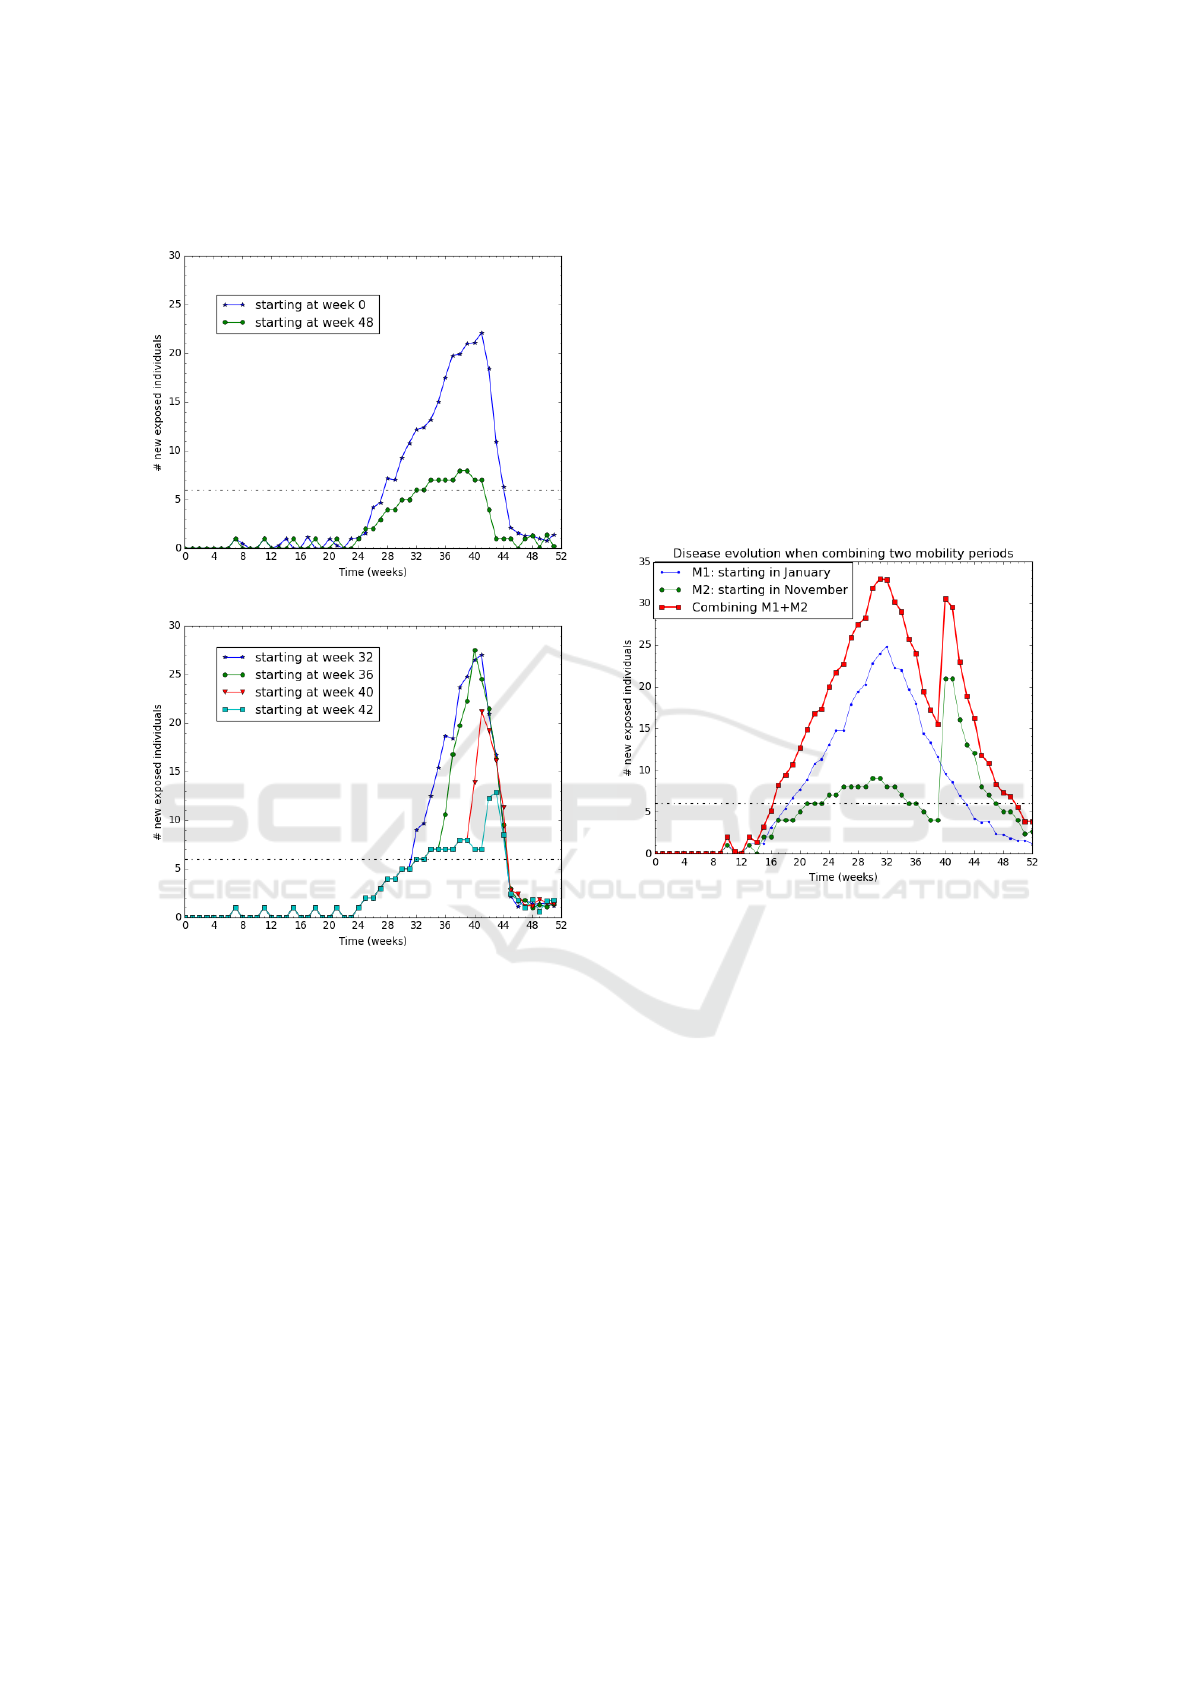
are few fair places and people from small cities or vil-
lages have to move to sell or buy goods.
(a) Mobility starting before/after the rain season.
(b) Mobility starting during the rain season.
Figure 8: Impact of the mobility starting date on the disease.
With 20% moving people and other parameters set
similar to the ones used in previous experiment (sec-
tion 4.3.2), we plot on Figure 8 the impact of the start-
ing mobility on the disease evolution.
The results (for "Week 40" curve) suggest that the
disease development is quite slow before the migra-
tion start. When the migration starts at the beginning
of the rain season (see "Week 0" curve), the disease
grows slowly because most of the vectors are still in a
susceptible state implying a low vector-to-human FoI.
On the other hand, when a migration starts at the mid-
dle of the rain season (see "Week 32" and "Week 36"
curves), the disease grows very fast because most of
the vectors are already infected, thus, causing a high
FOI.
Figure 9 aggregates 2 different cases of migration
patterns occurring on 2 sub-areas: a migration starting
at week 0 and another one starting at week 40. We re-
port (in red curve) the total number of newly exposed
people on the area.
The results suggest that the disease lasts 35 weeks,
which is longer than any of the two sub-areas. More
interestingly, the disease lasts 8 weeks longer than the
longest epidemic plotted on Figure 6. Notice that the
two sub-areas do have the same rain season because
they are located in the same region. We can conclude
that successive migrations from various specific ar-
eas (close villages) tend to generate rather long epi-
demic at a higher scale (region level). The results are
consistent with the real Kedougou observations : they
provide a possible explanation of what happened at
Kedougou.
Figure 9: Aggregating on 2 zones.
4.4 Relevance of the Model to Match
the Kedougou Real Case
The objective is to evaluate the relevance of our model
to match real malaria observations recently reported
in PNLP (2017). An observation is reported as a se-
ries of newly infected people, one value per week.
Given a observation occurring in an area of P inhabi-
tants for a period of n weeks, we define a normalized
report R = {R
1
, · ·· , R
n
} such that R
i
is the number
of newly infected people for week i divided by the
population P. Let M be a model for the observation
reported by R. Running M generates {M
1
, · ·· , M
n
}
such that M
i
is the expected ratio of newly infected
people on week i.
We plot the obtained values in Figure 10 and the
relative accuracy is E
M,R
= 0.016, what gives a mean
absolute error MAE = 0.001. These results show that
the values measured (reports) and those calculated
with the model differ by approximately 1 case per
1000. Therefore we can say that our model produces
A Malaria Control Model using Mobility Data: An Early Explanation of Kedougou Case in Senegal
43

values that are close to what is reported from real ob-
servations.
Figure 10: Normalized values from real observations vs.
simulation.
Therefore, using our model can help for more effi-
cient malaria control actions. For example, using the
model one can decide on which location to conduct
preventive actions in priority.
4.5 Vector Control Efficiency
In this experiment, we measure the benefit of our ap-
proach on controlling the malaria vectors. There are
two types of malaria control actions: 1) a preventive
action, which consists of convincing people to use re-
pellent and mosquito nets in order to avoid mosquito
bites, and 2) an eradication action (i.e., mosquito re-
moval) that consists in suppressing most of the vec-
tors in an area using chemical products. Notice that
this second action type may have dramatic ecological
consequences. Therefore, the first action type, pre-
ventive, would be a better choice. However, it comes
at a cost that must be optimized.
We aim to show that preventive action helps re-
ducing the vector-to-human FoI and then reduce the
epidemic intensity and duration.
We already show in previous sections, that the
moving part of the population is the major factor
that impact the epidemic duration and intensity. We
now protect those people who move from residen-
tial patch to meeting patch. Actually, this protection
could be done through repellent and mosquito nets.
In this respect, we consider the experiment configura-
tion where individuals mobility rate is 10% (see fig-
ure 6 when r = 0.1 ) and we use use different values
of protection rate (ptr) for people who regularly move
. The protection rate ptr depicts the ratio of protected
people among the moving ones. The results of these
experiments are shown on Figure 11.
We show that for ptr = 1 when we protect 100%
of the moving population, the epidemic intensity and
duration is as low as if no people is moving (see the
r = 0 case in figure 6). Therefore, preventive actions
targeting moving people can be rather efficient. In a
residential patch where few people are moving, such
preventive action would be cost-optimized assuming
Figure 11: Malaria evolution according to the mosquito
control strategy.
that the preventive action cost per individual is low.
When p is varying from 1 to 0.8, the total number of
exposed individuals is growing respectively from 118
to 169. This means that the preventive action must be
rather complete to be efficient.
5 DISCUSSION
Among the various outcomes of the model, one
may retain the following ones.
• Risk Customizing. The model helps to compute
the likelihood p
E
of a given individual to get ex-
posed based on its mobility pattern through the
different patches over the time. We have shown
how important it is to distinguish, within a patch,
moving people from residential ones. In a context
like Kedougou, such an fine-grained model advo-
cates that truckers, traders, and others with a high
mobility rate should be observed more carefully
since their risk to get infected, with the disease
dispersal knock-on effect, is more significant.
• Reducing Antimalarial Costs. Since the model
is devised for each individual, it allows to tar-
get specific persons at higher risk than the over-
all population. Bearing this in mind and the
fact that each antimalarial action costs, then us-
ing the model can contribute to reduce the neces-
sary means for the surveillance, and eventually,
the elimination of the disease. Moreover, with
the tight budgets in developing countries, com-
bined with the rapid growth of the demography
as well as the explosion of other infectious dis-
eases that create new priorities for governments,
the proposed approach seems to come up at the
right time for facing definitively against malaria.
• Mobility Impact. As shown in the validation sec-
tion, mobility may have either a great or low im-
pact on a visited patches. Therefore, the time-
based follow-up of a patch FoI using individu-
SIMULTECH 2020 - 10th International Conference on Simulation and Modeling Methodologies, Technologies and Applications
44

als’ mobility should go along with more clinical
testings to reach better predictions. In opposite
of current strategies applied in Kedougou, which
do not include human mobility details and figure
out the overall disease trends weeks or months
later, our model instantly plots detailed informa-
tion about malaria dispersal. Hence, policy mak-
ers may foresee the right actions to do in each
patch even though the disease has not happened
yet.
• What-if Analysis Boost. Last but not the least,
our solution can be used to calibrate the overall
actions against malaria. In fact, we can model the
disease spread while asking or supposing a spe-
cific pattern. For instance, we can suppose (or
eventually suggest) that people have to stay home
during their incubation period in order to reduce
the global evolution of the disease. Likewise,
we can suggest them following a specific mobil-
ity pattern based on the FoI of different patches.
In other words, we offer policy maker a tool that
can be used as dashboard to evaluate different sce-
nario and their effects.
Even if the experimental results we got are in-
teresting and rather intuitive sometime, they could
be more accurate with real mobility data. In ongo-
ing work, we plan to acquire those data and conduct
deeper experimental validation.
6 CONCLUSION
In this article we proposed a malaria model that takes
into account individual information such as mobility
patterns, health statuses, and so on. The model is a
discrete SEIR-SIS approach and differs mainly from
existing models by the fact that global details about
the disease are obtained by gathering the health sta-
tus of each individual among a given population. Our
approach is more accurate in terms of estimating the
disease level, and affords the possibility to setup more
efficient vector control strategies aiming to eliminate
malaria in Africa. Actually, our model is an early ex-
planation of Kedougou case where the malaria inci-
dence is still high despite the strategies of the Senegal
national program. In this respect, it unveils kind of
solutions that decision makers can use with respect to
individuals movement in order to eliminate the dis-
ease. Moreover, the results from our model match
real observations in Kedougou with a mean absolute
error of 0.001 while using synthetic data. Such a re-
sult is promising and let us believe that with real data,
our approach will behave efficiently. Thus, ongoing
works are conducted to collect on-line mobility data
obtained, for instance, through mobile networks. We
are aware that the results presented in this paper are
mainly based on synthetic data and thus cannot be in-
terpreted as realistic results. However, as we obtain
expected values we believe that our model behaves
correctly and should give useful information when ap-
plied to real data in the future.
REFERENCES
ANSD (2013). Projection de la populatiion de
la région de kedougou - 2013-2025. http:
//www.ansd.sn/ressources/publications/indicateurs/
Projections-demographiques-2013-2025+.htm.
Accessed: 2019-05-02.
Arthur, S. (2017). Malaria incubation period. http://malaria.
emedtv.com/malaria/malaria-incubation-period.html.
Accessed: 2017-03-29.
Chitnis, N., Cushing, J., and Hyman, J. (2006). Bifur-
cation analysis of a mathematical model for malaria
transmission. SIAM Journal on Applied Mathematics,
67(1):24–45.
Chitnis, N., Hyman, J. M., and Cushing, J. M. (2008).
Determining Important Parameters in the Spread of
Malaria Through the Sensitivity Analysis of a Math-
ematical Model. Bulletin of Mathematical Biology,
70(5):1272–1296.
Dharmawardena, P., Rodrigo, C., Mendis, K., de A. W. Gu-
nasekera, W. M. K. T., Premaratne, R., Ringwald,
P., and Fernando, D. (2017). Response of imported
malaria patients to antimalarial medicines in sri lanka
following malaria elimination. PLOS ONE, 12(11):1–
14.
Dimitrov, N. B. and Meyers, L. A. (2010). Mathematical
Approaches to Infectious Disease Prediction and Con-
trol, chapter Chapter 1, pages 1–25. INFORMS.
du Sénégal, G. (2017). National malaria control program.
http://www.pnlp.sn/. Accessed: 2019-01-25.
Filipe, J. A., Riley, E. M., Drakeley, C. J., Sutherland, C. J.,
and Ghani, A. C. (2007). Determination of the pro-
cesses driving the acquisition of immunity to malaria
using a mathematical transmission model. PLoS com-
putational biology, 3(12):1–11.
for Disease Control, C. and Prevention (2015). https://www.
cdc.gov/malaria/about/disease.html. Accessed: 2017-
05-29.
Gharbi, M., Flegg, J. A., Pradines, B., Berenger, A., Ndi-
aye, M., Djimdé, A. A., Roper, C., Hubert, V., Kendjo,
E., Venkatesan, M., Brasseur, P., Gaye, O., Offianan,
A. T., Penali, L., Le Bras, J., Guérin, P. J., and Study,
M. o. t. F. N. R. C. f. I. M. (2013). Surveillance of
travellers: An additional tool for tracking antimalar-
ial drug resistance in endemic countries. PLOS ONE,
8(10):1–11.
Greenwood, B., Marsh, K., and Snow, R. (1991). Why do
some african children develop severe malaria? Para-
sitology today, 7(10):277–281.
A Malaria Control Model using Mobility Data: An Early Explanation of Kedougou Case in Senegal
45

Gu, W., Killeen, G. F., Mbogo, C. M., Regens, J. L.,
Githure, J. I., and Beier, J. C. (2003a). An individual-
based model of plasmodium falciparum malaria trans-
mission on the coast of kenya. Transactions of The
Royal Society of Tropical Medicine and Hygiene,
97(1):43–50.
Gu, W., Mbogo, C. M., Githure, J. I., Regens, J. L., Killeen,
G. F., Swalm, C. M., Yan, G., and Beier, J. C. (2003b).
Low recovery rates stabilize malaria endemicity in ar-
eas of low transmission in coastal kenya. Acta Trop-
ica, 86(1):71 – 81.
Kermack, W. O. and McKendrick, A. G. (1927). A contri-
bution to the mathematical theory of epidemics. Pro-
ceedings of the royal society of london. Series A, Con-
taining papers of a mathematical and physical char-
acter, 115(772):700–721.
Koella, J. C. (1991). On the use of mathematical models of
malaria transmission. Acta tropica, 49(1):1–25.
Lechthaler, F., Matthys, B., Lechthaler-Felber, G., Likwela,
J. L., Mavoko, H. M., Rika, J. M., Mutombo, M. M.,
Ruckstuhl, L., Barczyk, J., Shargie, E., Prytherch, H.,
and Lengeler, C. (2019). Trends in reported malaria
cases and the effects of malaria control in the demo-
cratic republic of the congo. PLOS ONE, 14(7):1–20.
Mandal, S., Sarkar, R. R., and Sinha, S. (2011). Mathemat-
ical models of malaria - a review. Malaria Journal,
10(1):1–19.
Parham, P. and Ferguson, N. (2006). Space and contact net-
works: capturing the locality of disease transmission.
Journal of the Royal Society Interface, 3:483–493.
PNLP (2017). Bulletin de surveillance sen-
tinelle du paludisme. http://www.pnlp.sn/
bulletin-de-surveillance-sentinelle-du-paludisme/.
Accessed: 2019-08-30.
Ross, R. (1911). The Prevention of Malaria. John Murray,
Albemarle Street.
Ruktanonchai, N. W., DeLeenheer, P., Tatem, A. J., Ale-
gana, V. A., Caughlin, T. T., zu Erbach-Schoenberg,
E., Lourenço, C., Ruktanonchai, C. W., and Smith,
D. L. (2016). Identifying malaria transmission foci for
elimination using human mobility data. PLOS Com-
putational Biology, 12(4):1–19.
Thiam, S., Thior, M., Faye, B., Ndiop, M., Diouf, M. L.,
Diouf, M. B., Diallo, I., Fall, F. B., Ndiaye, J. L., Al-
bertini, A., Lee, E., Jorgensen, P., Gaye, O., and Bell,
D. (2011). Major reduction in anti-malarial drug con-
sumption in senegal after nation-wide introduction of
malaria rapid diagnostic tests. PLOS ONE, 6(4):1–7.
WHO Inc. (2016). OMS | 10 faits sur le paludisme. http://
www.who.int/features/factfiles/malaria/fr/. Accessed:
2017-05-15.
SIMULTECH 2020 - 10th International Conference on Simulation and Modeling Methodologies, Technologies and Applications
46
