
Toolchain Development for Automated Scene Reconstruction using
Artificial Neural Network Object Detection and Photogrammetry for the
Application in Driving Simulators
Maximilian Jarofka, Stephan Schweig, Niko Maas and Dieter Schramm
Chair of Mechatronics, University of Duisburg-Essen, Lotharstraße 1, 47057 Duisburg, Germany
Keywords:
Artificial Neural Network, COLMAP, Clustering, Driving Simulator, Metashape, Meshroom, Object
Classification, Object Detection, Photogrammetry, Process Chain, Unity, VisualSFM.
Abstract:
This paper presents an automated process chain for the reconstruction of characteristic 3D objects, which can
be used in a simulation environment. The process chain can distinguish between recurring objects such as trees
and cars and specific objects like buildings. To acquire this, it detects and classifies objects in images from a
previously recorded video. In contrast to the specific objects, which are reconstructed during the workflow of
the process chain, the recurrent objects are loaded from already existing models and are placed multiple times
into the simulation environment. In terms of quality a visual comparison between the two integrated programs
for the reconstruction (Metashape and Meshroom) is carried out. Furthermore the accuracy of the positioning
of standard objects in the Unity game engine is examined.
1 INTRODUCTION
Today driving simulators are used in a wide variety of
areas. In the industry they are used, for example, to
simulate ships or to simulate the driving behaviour of
road vehicles. Furthermore, they serve as training de-
vices for new drivers in uncommon or dangerous sit-
uations. One big advantage of using simulators is the
reproducibility of different test scenarios, as well as
the secure simulation of risky situations. This paper
describes the development of an automated process
chain for object reconstruction on the example of an
automotive driving simulator.
Simulators benefit from the rapid development of
the computing power of microchips. Therefore, the
demands on the developed scenarios, especially with
regard to graphical details, are growing to the same
extend. To make the test drive within a driving simu-
lator as realistic as possible, a detailed graphical sim-
ulation environment must be provided.
Those scenarios consist of different types of ob-
jects. On the one hand, there are recurring objects
such as trees, cars or street lights. By loading them
from an object database they can be placed in the en-
vironment. To ensure a variation in the build scenario,
their individual properties such as colour or shading
can be modified. On the other hand, there are specific
objects, which cannot be replaced by objects from a
database or loaded multiple times into the simulation
environment due to their uniqueness. Therefore these
objects have to be modelled individually. If a sim-
ulation should be based on a real environment (e.g.
streets of an existing city), concise objects, such as
buildings, have to be modelled. This process does not
only take much time but also requires considerable
know-how in 3D modelling.
This paper presents an automated procedure for
the reconstruction of 3D objects and their integration
into a scenario. The automation is intended to make
the design of scenarios for driving simulators more
efficient and therefore less time consuming. The au-
tomated process chain is based on recorded data from
a ZED stereoscopic camera, manufactured by Stere-
oLabs (Stereolabs Inc., 2020). From this dataset, the
process chain will reconstruct specific objects and im-
ports them into a Unity scene along with standard ob-
jects like cars and trees, loaded from previously exist-
ing models.
In the first step objects and their three-dimensional
positions have to be determined. Afterwards, by ap-
plying photogrammetric methods, the objects are re-
constructed. Purpose of the developed process chain
is the generation of a scenario which can directly be
used as a simulation environment.
Jarofka, M., Schweig, S., Maas, N. and Schramm, D.
Toolchain Development for Automated Scene Reconstruction using Artificial Neural Network Object Detection and Photogrammetry for the Application in Driving Simulators.
DOI: 10.5220/0009590500250034
In Proceedings of the 10th International Conference on Simulation and Modeling Methodologies, Technologies and Applications (SIMULTECH 2020), pages 25-34
ISBN: 978-989-758-444-2
Copyright
c
2020 by SCITEPRESS – Science and Technology Publications, Lda. All rights reserved
25
2 STATE OF THE ART
In this section, the theoretical concepts of this paper
are explained. Objects within recorded images are de-
tected automatically and subsequently reconstructed
to 3D models. An object classifier based on an artifi-
cial neural network is used for the detection of these
objects.
Therefore the basics of the used object classifier
are explained in the first subsection. Furthermore
the basic principles of photogrammetric methods are
stated. Through the use of these methods, the recog-
nized objects are transformed into 3D models.
2.1 Object Detection and Classification
There are big improvements in the field of object
recognition and computer vision in general. One rea-
son for these improvements is the increase in comput-
ing power and thus the associated possibility to use
deeper artificial neural networks, (He et al., 2016)
For the detection and classification of objects the
artificial neural network with the name ”You Only
Look Once (YOLO)” is used in this work. This
network was originally developed in the year 2015
and is now published in the third version, (Redmon
et al., 2015; Redmon and Farhadi, 2016; Redmon and
Farhadi, 2018). The actual version of YOLO consists
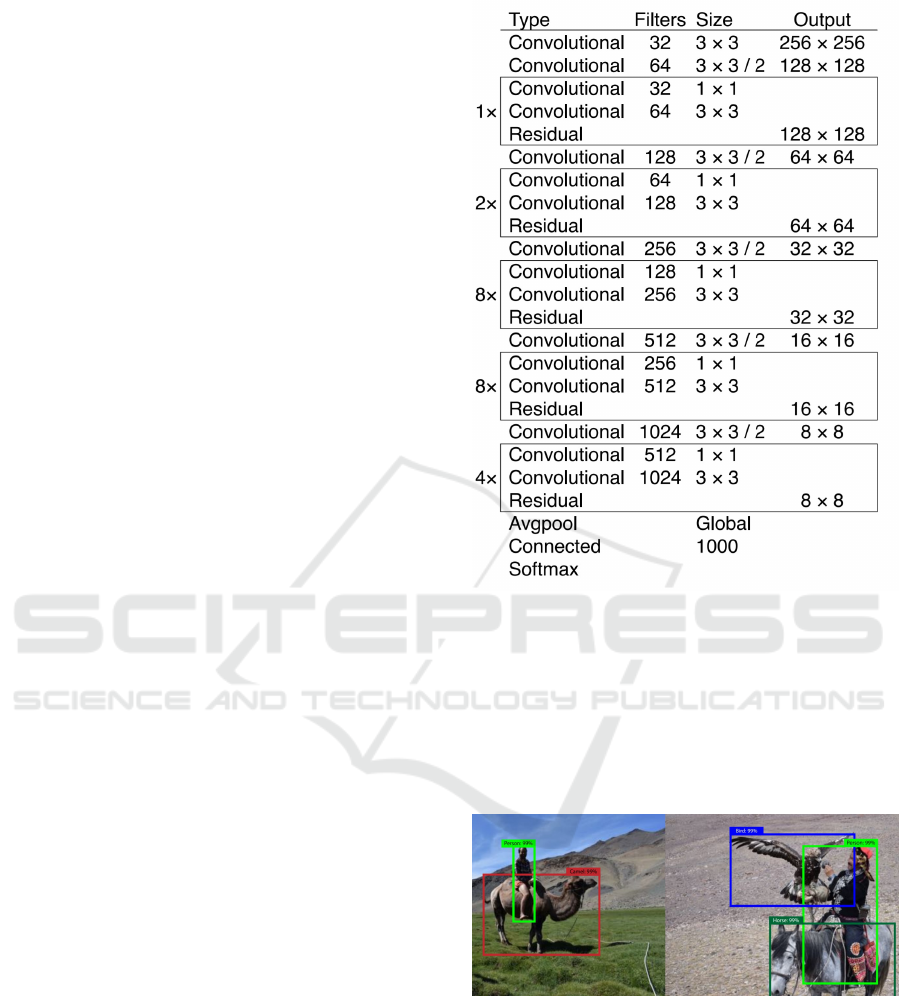
of a large number of hidden layers. Figure 1 shows
the detailed structure of the network.
This specific system has a number of features that
distinguish it from other object classifiers. Different
bounding boxes are predicted in a single evaluation
of the source image. A probability value is assigned
to each of them. This value represents the combined
probability of the object being correctly mapped and
the correct assignment of an object class.
In contrast to this procedure other systems run
a classifier over the input image at predefined in-
tervals to perform object detection at each of these
points. As a result, the detection process takes com-
paratively long. Also other systems often consist of a
sequence of different processes which form a process
chain. The resulting interdependencies between dif-
ferent process parts make it very difficult to improve
the overall performance in one step. The YOLO ob-
ject detection system however, consisting of a single
network, makes it easy to apply known strategies from
the field of artificial neural networks for improving
performance, (Redmon and Farhadi, 2018).
The results of the classification process with
YOLO are bounding boxes. Each box contains the
location in image coordinates (X,Y) and the width
and height of the box in pixels. In addition, a bound-
Figure 1: Layers of the artificial neural network YOLO ver-
sion 3 (Redmon and Farhadi, 2018).
ing box also contains an object class and a probabil-
ity information about the correct mapping of the ob-
ject. This probability considers (as already mentioned
above) the correct position and class of the object.
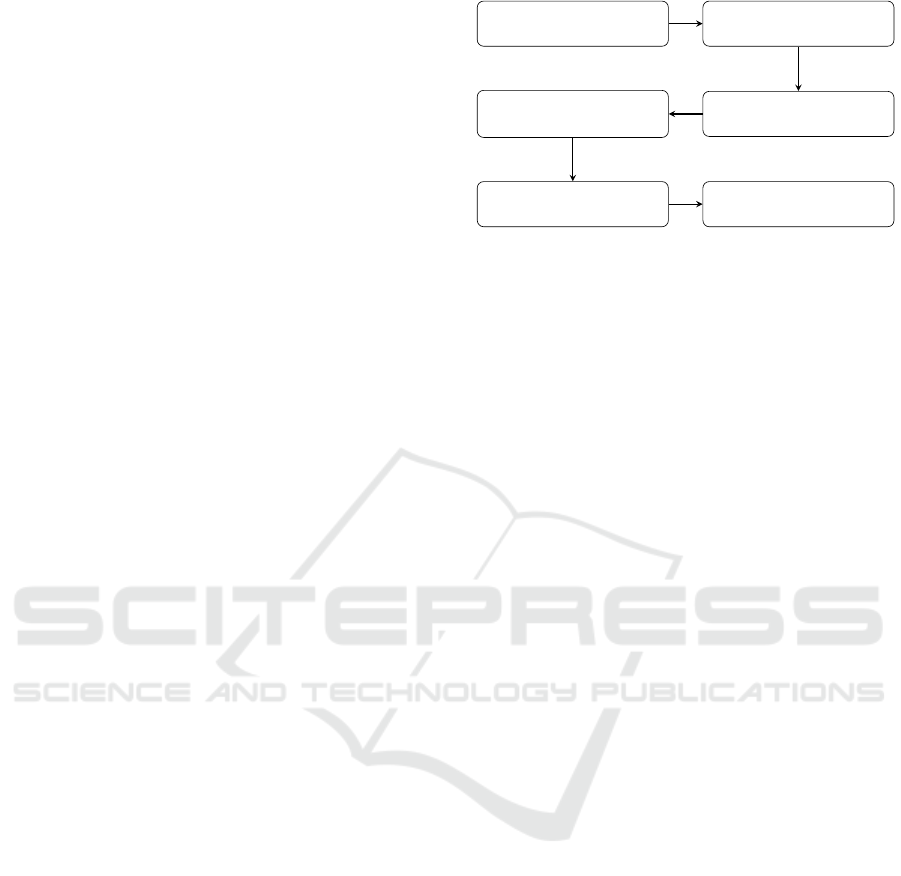
Figure 2 shows possible object detections and their
visualization in the original image.
Figure 2: Detected objects in original picture (Redmon and
Farhadi, 2018).
Which objects can be recognized by the system
depends on the training data used. Like the human
brain, the network must first ”learn” the detection of
specific objects. In this paper the artificial neural net-
work YOLOv3, pre-trained on the open-image dataset
is used. With this version it is possible to recognize
and classify 601 different objects (Kuznetsova et al.,
2018).
SIMULTECH 2020 - 10th International Conference on Simulation and Modeling Methodologies, Technologies and Applications
26
2.2 Photogrammetry
Photogrammetry originally describes the measure-
ment of various properties of an object from images.
Today the term ”photogrammetry” is mostly used to
describe the determination of three dimensional co-
ordinates from different images of an object without
any physical contact. Thus it is possible to reconstruct
complete 3D models of these objects. Depending
on the camera used (standard digital camera or spe-
cial measuring camera) very high accuracies of these
models can be achieved, (Donath, 2009).
Since the first developments in the field of pho-
togrammetry, those methods have established them-
self as an important and widely used tool. A
special approach within photogrammetry is the so
called Structure-from-Motion method (SfM), (West-
oby et al., 2012).
In contrast to other photogrammetric methods,
such as stereoscopic photogrammetry, a process chain
containing SfM offers several advantages. By using
SfM methods, it is possible to reconstruct a 3D ob-
ject without prior knowledge of the position and ori-
entation of the images taken. This means, that ob-
jects can be captured with standard cameras (without
any further sensory setup such as GPS or gyroscope)
and then be reconstructed into a 3D model, (Westoby
et al., 2012; Shashi and Jain, 2007).
The term ”Structure-from-Motion” here denotes
that 3D structures are reconstructed from the move-
ment of the camera and the resulting different angles
of view in each image, (Szeliski, 2010).
The entire process, from reading the individual
images to the finished 3D model, often is denoted
as Structure from Motion. More precisely, however,
SfM is only an intermediate step in the entire process
chain. The camera position, as well as the position of
the feature coordinates in a uniform coordinate sys-
tem, are determined from a priori detected geometri-
cal features. Subsequently, a point cloud can be cre-
ated to link these to a 3D model and texturing can be
used to create a final 3D model.
The flowchart shown in Figure 3 describes a pos-
sible photogrammetric process chain using SfM algo-
rithms as used in the AliceVision-Framework (Alice-
Vision, 2020).
3 AUTOMATED PROCESS CHAIN
Within this section, the basic procedure of an auto-
mated scenario reconstruction is presented. A process
chain is developed by which individual objects can be
detected and reconstructed. Subsequently, these ob-
Feature Extraction
Feature Matching
Structure from Motion
Multi Vision Stereo
(MVS)
Meshing and Texturing
3D Model
Figure 3: Flowchart of a possible SfM process chain (Al-
iceVision, 2020).
jects are assembled to a scenario in the Unity game
engine.
The process chain consists of a higher-level pro-
gram that calls and controls various subprograms.
The objective is to make the sequential flow of all
programs as independent from user interaction as pos-
sible. For this purpose, all important parameters are
collected within a configuration file. This allows the
user to specify all parameters in advance and then run
the process chain unattended.
In addition to the high degree of automation, the
process chain should also have the highest possible
degree of modularity. It should be possible to start in-
dividual steps without the preceding ones. This mod-
ular structure is very useful for adapting the param-
eters in test runs. If some steps of the process chain
have already been completed successfully, only the
following module can be started with adapted param-
eters. Thus, already completed steps do not have to
be repeated and the processing time is reduced.
Furthermore, the modular structure enables an in-
terruption of the process chain at any point and the
continuation at another time. However, since the se-
quence cannot be changed due to the dependencies of
the individual steps, the modules must be processed
one after the other and cannot be executed in paral-
lel (except the object detection/clustering and the data
extraction as seen in Figure 4). To activate each mod-
ule individually, the configuration file contains the pa-
rameter run = true/false for each module. Only the
modules with the parameter run = true are executed
within the process chain.
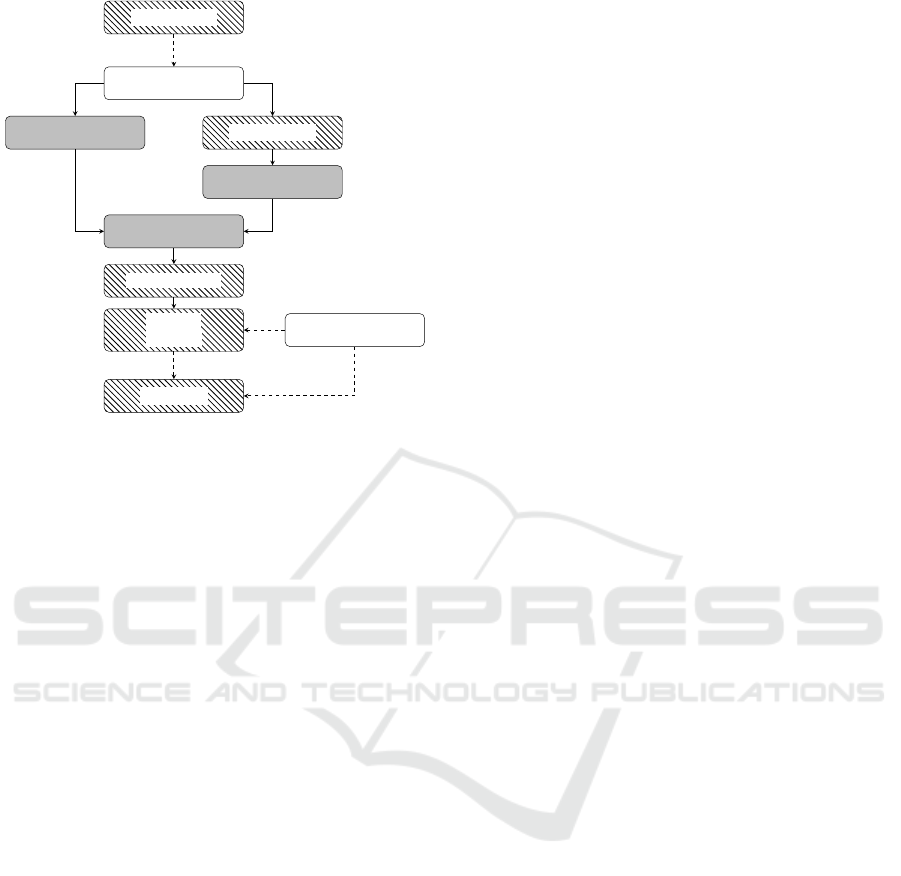
Figure 4 shows the process chain as a flow chart.
The different labels within this diagram represent dif-
ferent types of subroutines. The hatched fields rep-
resent self developed scripts. They are used to con-
trol an already existing software - such as Unity,
Blender or Metashape (Agisoft LLC, 2020; Alice-
Vision, 2020). The script enables the transfer of re-
quired parameters to the respective program. A spe-
cific programming interface of the program is then
Toolchain Development for Automated Scene Reconstruction using Artificial Neural Network Object Detection and Photogrammetry for the
Application in Driving Simulators
27
Data Acquisition
Video Files
Image- and Data Extraction Object Detection
Object Clustering
Assignment of Im-
ages to Objects
3D Reconstruction
Cutting of
3D Object
User Input
Import Unity
Figure 4: Flowchart of the developed process chain.
used to run the intended sub tasks. Fields high-
lighted in grey represent own programs, which were
developed especially for the integration in the process
chain.
In addition to the programs listed here, there
is another program that controls the entire pro-
cess chain. This program runs the individual sub-
programs/subscripts with corresponding parameters
loaded from the configuration file.
Splitting the task in different sub tasks ensures the
above-mentioned flexibility of the process chain. An-
other important factor in the development of the pro-
cess chain is the independence from direct user input.
As seen in Figure 4, only the cutting of 3D model and
the start of the import process of the objects into the
Unity game engine require direct user interaction.
In the following subsection only the most impor-
tant parts of the process chain are explained in more
detail. Thus the object detection, object clustering and
3D reconstruction are discussed further on.
3.1 Object Detection
To start the object detection, the corresponding
Python script in the installation folder of YOLO is
started by the main program. This is a version that has
been specially modified for the purposes of the auto-
mated process chain. The original script for the inte-
gration of the used stereoscopic camera in the YOLO-
workflow can be downloaded from GitHub, (Alex-
eyAB, 2018).
For each detected object the artificial neural net-
work provides specific values. In addition to the clas-
sification (e.g. tree), size of the bounding box (in
pixels) and position (in pixels) of the object, a value
for the accuracy of the detection is available. This
is a percentage value that indicates the certainty of
a correct classification. By selecting an appropriate
Threshold parameter in the configuration file, the ob-
jects can be filtered according to these values. Only
detections of objects with a certainty above the value
of the Threshold parameter are considered as correct
and will be saved. Initial tests have shown that a
Threshold of roughly 0.3 seems to be well suited for
the detection of buildings on the roadside.
To store the object information, a simple text doc-
ument is created for each processed video file. For
each recognized object within each image one line
with its information is stored. An example for such
entries is shown in Table 1. In addition to the number
of the image in which the object was detected, the
information about its mean position within the im-
age (X, Y, height, width) also its position in three-
dimensional space (Pos
X
, Pos
Y
, Pos
Z
in meters) is
stored. To calculate this 3D position of the object in
world coordinates, the point cloud of the respective
stereo image pair is used. The point cloud can be read
out directly via a software function provided with the
ZED camera.
The point cloud generated by the camera only con-
tains a certain distance range. All pixels whose calcu-
lated distance to the camera is too small or too large,
are not displayed in this point cloud. If a pixel is out-
side the point cloud, the value -1 is returned for its
position. In table 1, this is the case for the object in
the third line. The detected plant is too far away from
the camera and its position, as well as other calculated
parameters, are set to the error value of -1. In the fol-
lowing, such an object is considered as invalid and can
be excluded by the parameter includeInvalid=false in
the configuration file.
Furthermore the occlusion between two objects is
calculated. A percentage value for the overlapping
areas of both objects is determined if an object is oc-
cluded by another one in front of it. In further updates
of the process chain an automated selection of the ob-
jects which should be reconstructed could be imple-
mented based on this value.
3.2 Object Clustering
In the previous step, objects within individual images
were detected and their position in the world coordi-
nate system is calculated. Since the same object oc-
curs in different images, the object positions must be
clustered. As long as the positions of detected objects
are close enough to one another, they are assigned to
one object cluster. If a considered point lies within a
SIMULTECH 2020 - 10th International Conference on Simulation and Modeling Methodologies, Technologies and Applications
28
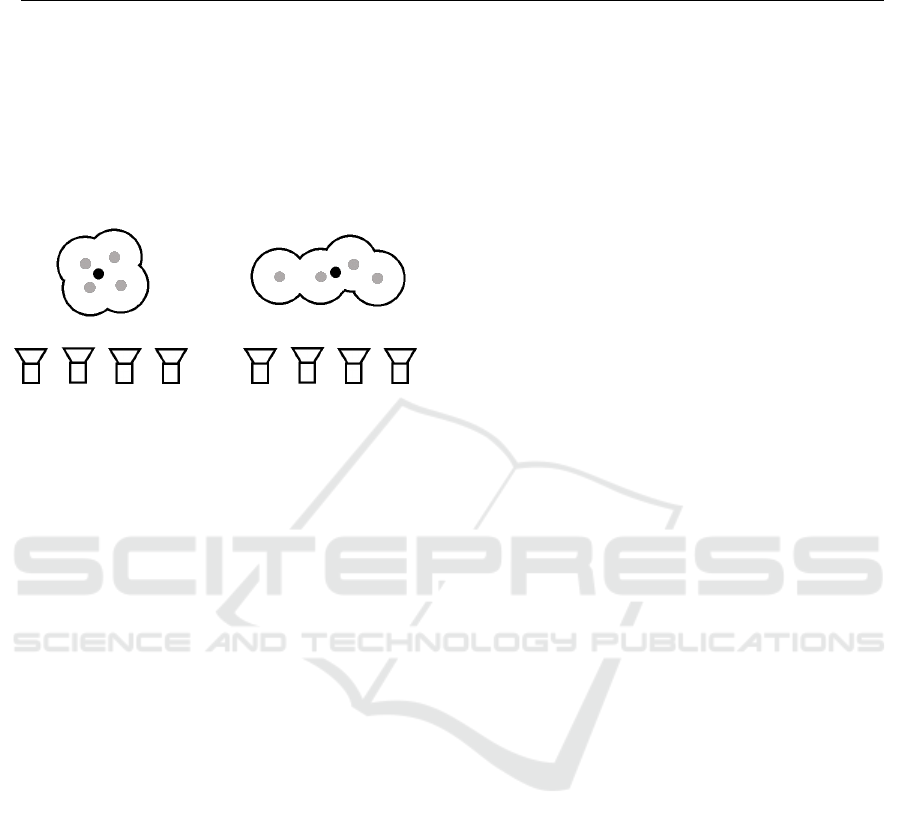
Table 1: Object information saved by the YOLO script.
Nb. Class Accuracy X Y Width Height Pos
X
Pos
Y
Pos
Z
Distance Occlusion
1485 Building 38.0 861 131 411 533 -60.256 7.155 -28.700 11.285 0.307
1485 Building 36.0 0 137 587 510 -71.969 10.201 -41.555 20.350 0.107
1485 Plant 27.0 560 238 196 253 -1 -1 -1 -1 -1
1485 Car 26.0 490 522 186 110 -67.236 5.014 -29.367 7.535 0.0
1485 Plant 20.0 924 469 344 243 -63.875 4.727 -26.113 6.643 0.0
certain radius to any point in a cluster, it is also as-
signed to it. Cloudlike object boundaries are created,
(compare Figure 5).
A B
Figure 5: Visualization of the clustering process.
In addition to characteristic delimitations, two dif-
ferent cases of clustering can be seen in Figure 5. Sce-
nario A is a single smaller object that was recorded
from all camera perspectives. Due to inaccuracies in
the image recording or object recognition, deviations
of the object positions in the world coordinate system
(gray dots) occur. However, each of these positions
is within the threshold (radius) to a different point.
Therefore, all points are combined into a common
cluster (and thus into one object) with an averaged
centre position (black point).
Scenario B is a continuous object that is too big to
be captured in one image. YOLO detects the object
approximately over the entire width of the respective
image. This results in points shifted parallel to the
movement of the camera. Just like scenario A, how-
ever, these are within the selected threshold and are
thus assigned to one and the same object. This proce-
dure for clustering objects makes it possible to cluster
even larger objects correctly, which span over several
images.
In addition to the threshold value for the proximity
of all points to one another, a further threshold value
for the number of points is introduced. Individual
clusters are only considered as correct if the number
of points in them exceeds the threshold value. This
means that individual faulty detections are not con-
sidered as a separate cluster with a very small number
of individual points.
The program for creating the object clusters first
reads the files with the information about all detected
objects (compare section 3.1). A label for the clus-
tering can now be specified via the configuration file.
If an object does not have the appropriate label, it is
discarded and not assigned to a cluster. If all objects
have been distributed to the clusters or have been dis-
carded, the clusters with too few individual objects are
also discarded. The mean value of the position is now
calculated for all remaining clusters. The resulting av-
eraged objects are then saved in another text file. Si-
multaneously to the positions and other information,
all image numbers in which the respective object oc-
curs are saved. Using these numbers, the extracted
images can be split up and further be processed to re-
constructed objects using photogrammetry.
3.3 3D Reconstruction
In order to determine a suitable reconstruction pro-
gram for the use within this process chain, some pre-
liminary tests were carried out during its develop-
ment. At first, different software solutions for the
reconstruction of 3D models were tested. The used
camera already comes with software for 3D recon-
struction. It is integrated in the software development
package and already has a graphical user interface.
It uses the point clouds generated by the stereo cam-
era for the reconstruction of objects. However, it was
not able to provide usable models in initial tests and
was therefore not considered further for the use within
the process chain. In addition, the programs Visu-
alSFM (Wu, 2013; Wu et al., 2011) and COLMAP
(Schonberger and Frahm, 2016) were tested in ad-
vance. They were also unable to deliver satisfying
results in initial tests and were therefore also not con-
sidered for further use in the process chain.
All the above mentioned programs delivered 3D
models with many holes in the reconstructed surfaces
as well as faulty textures. The minimum requirements
for the generated models are a continuous surface and
correct texturing. Furthermore, the texture of the ob-
jects should not overlap with textures from objects
which are in front of them.
The first program to achieve acceptable results
under these aspects was Metashape (Agisoft LLC,
2018). For this reason, the process chain was initially
developed using this program. However, since it is a
software that requires a licence, the program Mesh-
Toolchain Development for Automated Scene Reconstruction using Artificial Neural Network Object Detection and Photogrammetry for the
Application in Driving Simulators
29
room was also tested and integrated into the process
chain. It is a free open-source software which uses the
AliceVision-Framework (AliceVision, 2020). Mesh-
room also allows the reconstruction of acceptable 3D
models.
4 EXPERIMENATAL RESULTS
After the explanation of the developed automated pro-
cess chain in the previous chapter, this chapter deals
with some selected experiments carried out with it.
As described in section 3.1 the two already inte-
grated programs in the process chain are Metashape
and Meshroom. In the first section of this chapter they
are compared in concerning the resulting 3D models.
Besides the reconstruction of objects by pho-
togrammetric methods, the developed process chain
also allows multiple imports of existing standard ob-
jects into the scene.
Therefore the second section of this chapter deals
with the accuracy of this import procedure.
4.1 Comparison between the Two
Integrated Reconstruction
Programs
A uniform test procedure was defined, so that the two
programs can be compared with each other. In the first
part of the test runs, the standard process chain was
applied several times to the same scenario. The num-
ber of images used and their resolution were varied.
Through this procedure the results can be evaluated
in terms of quality.
In order to guarantee constant conditions for the
reconstruction programs, the process chain was only
carried out up to the partial step of assigning the im-
ages to a specific object. Afterwards the test runs were
carried out for both programs with a varying number
of images. For this purpose the parameter SkipCount
in the section [Imagecopy] of the configuration file
was varied. This means that only every n
th
frame from
the video file is used for the reconstruction.
A street with three buildings on the side was cho-
sen as the test scenario. To minimize the time required
for all test runs, only the building in the middle was
reconstructed. For better illustration it was roughly
cut into shape in a manual step. The recorded screen-
shots of the respective building can be visually com-
pared with each other with regard to quality.
The scenario above was recorded in two different
resolutions. 720p as a medium resolution and 2.2K as
maximum resolution delivered by the camera. Table 2
shows the resulting matrix for all test runs carried out
with each reconstruction program.
Table 2: Example for one test matrix.
SkipCount
2 5 10 20
Nb of images (720p) 566 228 114 58
Nb of image (2.2K) 162 66 34 18
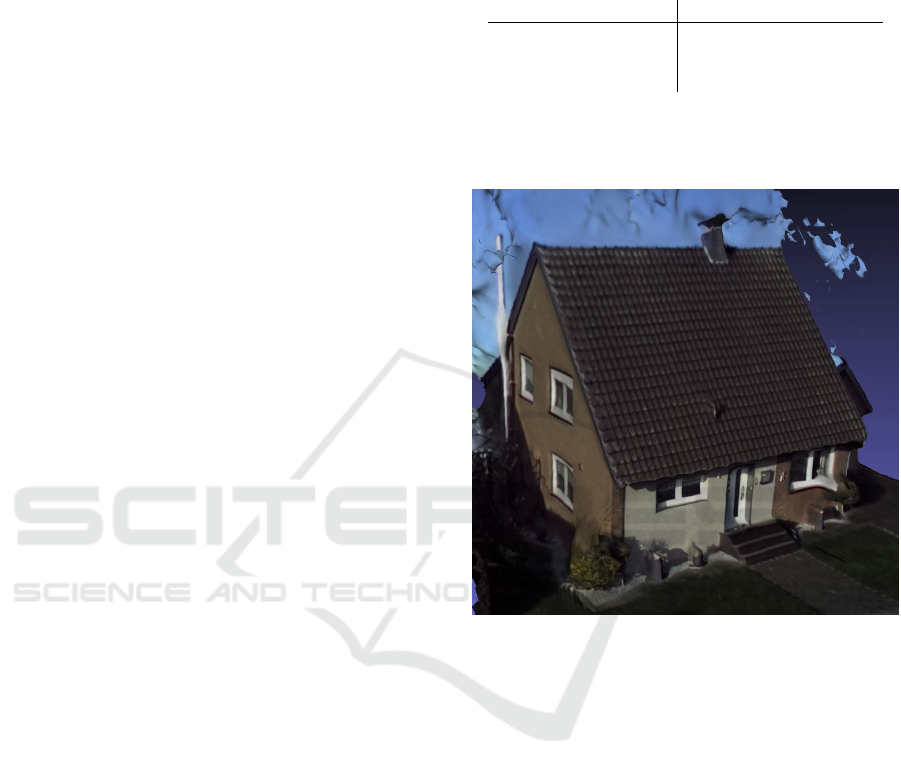
Figures 6 and 7 show exemplary reconstructed
3D models for the largest number of images at the
medium resolution of 720p.
Figure 6: Resulting 3D model from Metashape (resolution
720p).
A direct comparison of the two models reveals
differences in quality. The program Metashape (Fig-
ure 6) delivers better quality results than Meshroom
(Figure 7). The boundaries of the object are less
uneven. Also the actual flat surfaces of the build-
ing appear much smoother in the reconstruction of
Metashape. Besides the unevenness of the boundaries
and surfaces, the texture of the model in Figure 6 also
appears sharper and less blurred.
In the second part of the tests, all runs were per-
formed with the data recorded in the maximum reso-
lution of 2.2K. The results of the two reconstruction
programs will be compared with each other again for
the largest number of used images.
Figures 8 and 9 show the resulting 3D models with
the highest number of images used.
Overall, this comparison reveals similar differ-
ences. Again, the building facades from Metashape
were reconstructed less uneven. The boundaries and
edges of the building are also much clearer. This is
SIMULTECH 2020 - 10th International Conference on Simulation and Modeling Methodologies, Technologies and Applications
30
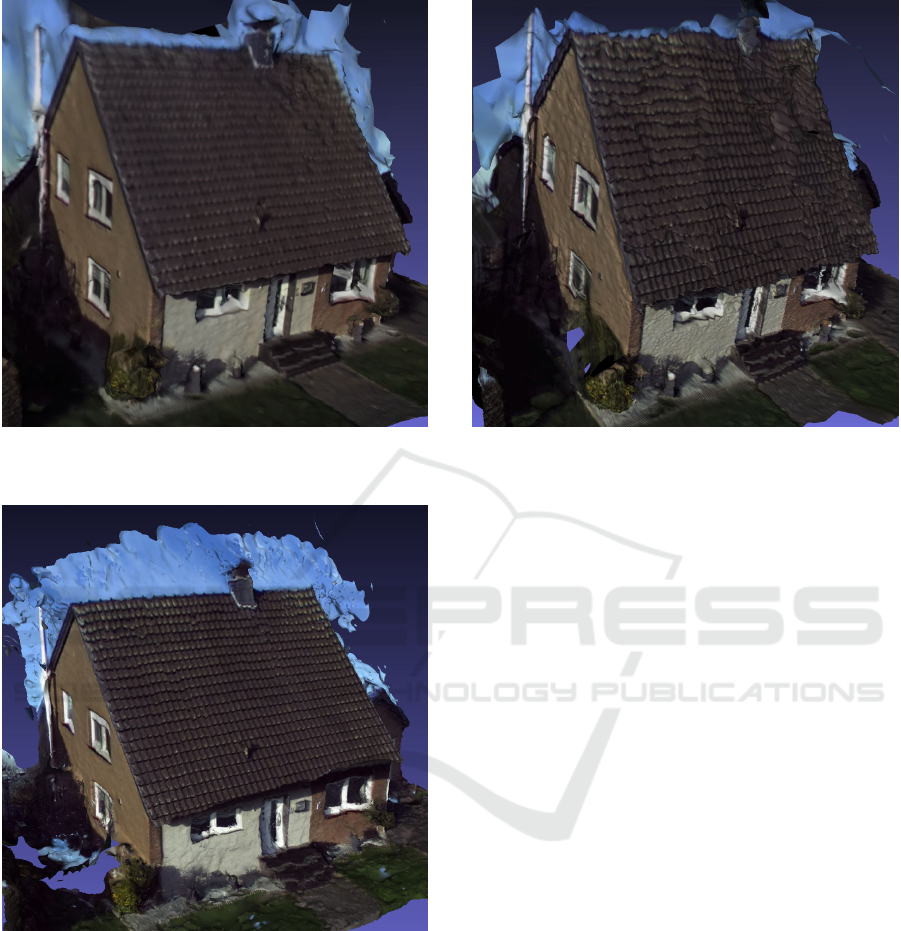
Figure 7: Resulting 3D model from Meshroom (resolution
720p).
Figure 8: Resulting 3D model from Metashape (resolution
2.2K).
particularly noticeable in the transition between the
building and the sky. If all parts of the reconstructed
sky were removed, Metashape would have a relatively
straight edge. The reconstruction with Meshroom on
the other hand has a much more uneven and jagged
roof edge.
The tests with less images used for the reconstruc-
tion showed similar results. In general Metashape de-
livered better quality in all reconstructions. With a
very low number of images the overall quality was re-
Figure 9: Resulting 3D model from Meshroom (resolution
2.2K).
duced. Less than 66 images led to many holes and
artefacts in the resulting 3D models.
In general it can be stated, that contrary to expec-
tations, the quality is not improved by using the higher
camera resolution. By using the maximum resolution,
the quality of the reconstructed models is worse. Es-
pecially the frontal facade of the building shows con-
siderably more unevenness. Also the floor is more un-
even when using the higher resolution and is showing
single gaps that were not reconstructed correctly.
In all reconstructed models, artefacts arise be-
tween the object and its surroundings. With regard
to the reconstructed building, this is particularly no-
ticeable in the transition from the building to the sky.
In the immediate vicinity of the building, parts of the
sky are also reconstructed. In the course of quality as-
sessment these artefacts will not be considered. Since
the creation of these artefacts cannot be prevented in
both programs, they must be removed in the process
of manual cutting anyway. Thus they do not represent
an explicit characteristic of quality in a direct compar-
ison.
4.2 Positioning of Standard Objects into
the Game Engine Unity
With the developed automated process chain it is also
possible to import recurring objects. As already men-
tioned above, objects can be recognized with YOLO
and then be replaced by prefabricated 3D models at
the corresponding positions within the scene. Regard-
ing poly count and effective modelling, this allows the
Toolchain Development for Automated Scene Reconstruction using Artificial Neural Network Object Detection and Photogrammetry for the
Application in Driving Simulators
31
models to be optimized in advance.
In the following section, the detection of such
standard objects and their import are discussed. The
tests were performed for the detection of cars at the
roadside of the recorded scene. However, it is theo-
retically possible to use any of the object classes de-
tectable by YOLO, see (Kuznetsova et al., 2018).
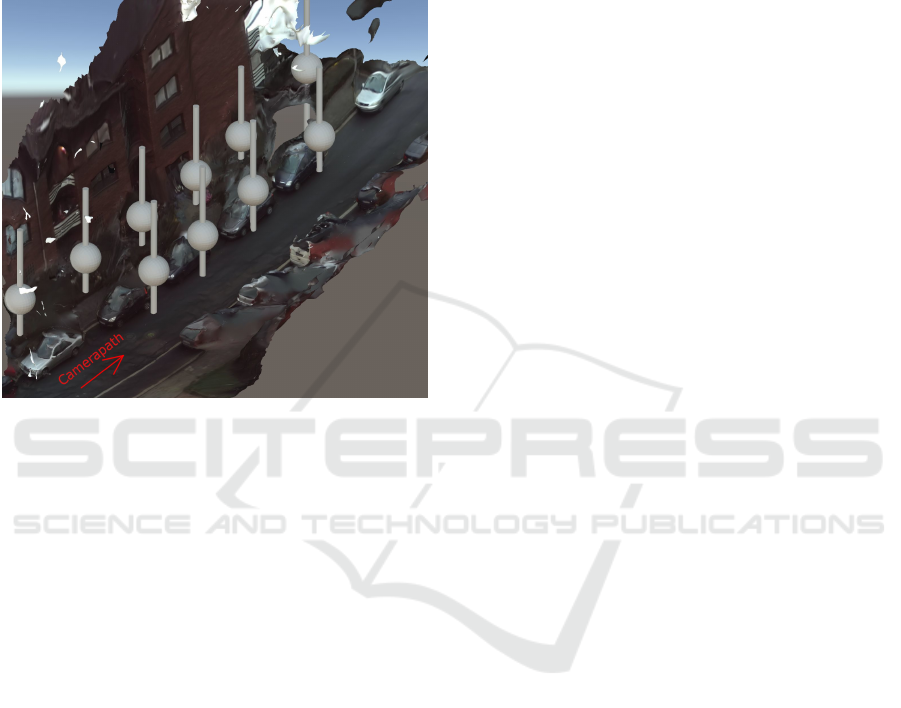
Figure 10: Imported standard objects at the detected posi-
tions of cars along a street.
Example objects are imported into the recon-
structed scenario to visualize the detected positions.
They consist of a long cylinder and a sphere. In Fig-
ure 10 it is clearly visible that the detected positions
do not match the actual positions of the objects in the
scene. They are shifted by a constant factor (here
4 m) along the x-axis. If the shift is corrected the
calculated positions match the positions of the recon-
structed model. A possible reason for the necessary
correction is the general positioning of the 3D model.
On the one hand, the reconstructed model has a spe-
cific coordinate system given by the reconstruction
program. On the other hand, the objects are refer-
enced to the coordinate system of the camera. There-
fore, it is necessary to convert between the two coor-
dinate systems.
In the current version of the process chain this is
done by taking the positional information of only one
image. If this is inaccurately aligned by the recon-
struction program or the information itself is inaccu-
rate, the whole model can easily be shifted.
In a second test scenario the positions of cars are
examined again. This time using a straight building
facade. Figure 11 shows the resulting point cloud for
the selected scenario. The positions of the cars, which
have to be detected, were marked manually by a red
circle and the automatically calculated positions were
marked by loading the sample objects. When compar-
ing the respective positions, differences are noticeable
depending on the camera path covered. At the be-
ginning of the recording (right part of Figure 11), the
automatically determined positions almost match the
manually marked positions. With increasing distance
covered by the camera, however, the positions deviate
more and more from each other. The automatically
calculated position of the last car deviates about 10
meters from the manually marked position.
The actual course of the recorded facade is com-
pletely straight and without curves. In the point cloud
shown, however, a bend to the right is clearly visible.
5 CONCLUSION
In the course of this paper a process chain for the
automated reconstruction of 3D models and integra-
tion into a simulation environment is presented. The
process chain uses data recorded from a stereoscopic
camera. By using the YOLO artificial neural network,
the process chain recognizes individual objects within
the video frames and clusters them. Specific objects -
such as buildings - getting converted into a 3D model
by a 3D reconstruction program using photogrammet-
ric methods. In addition to the object itself, its three-
dimensional position is calculated and saved. For this
purpose, the positional tracking of the stereoscopic
camera is used. Based on this position, the object can
be imported into a Unity scene. With the exception of
cutting the raw mesh and starting the import process,
the process chain is fully automated and does not re-
quire any user input.
To allow a certain modularity besides the automa-
tion, independent programs and scripts were devel-
oped. They were combined into a process chain by
developing a supervising control program. The used
parameters of all programs were combined in two
configuration files for easy handling. The flow of
the process chain already can be changed by adjust-
ing various parameters. This also makes it possible to
reconstruct scenarios coherently. Connected building
facades can thus be reconstructed by adjusting only
one parameter in a coherent model. It is also possible
to reconstruct a scene from different camera angles.
With the current design of the process chain, it is al-
ready possible to use a large number of cameras.
For the actual reconstruction of the 3D models,
existing programs within the process chain are used.
Two different reconstruction programs have already
been integrated into the workflow. On one hand, the
proprietary program Metashape from Agisoft can be
SIMULTECH 2020 - 10th International Conference on Simulation and Modeling Methodologies, Technologies and Applications
32
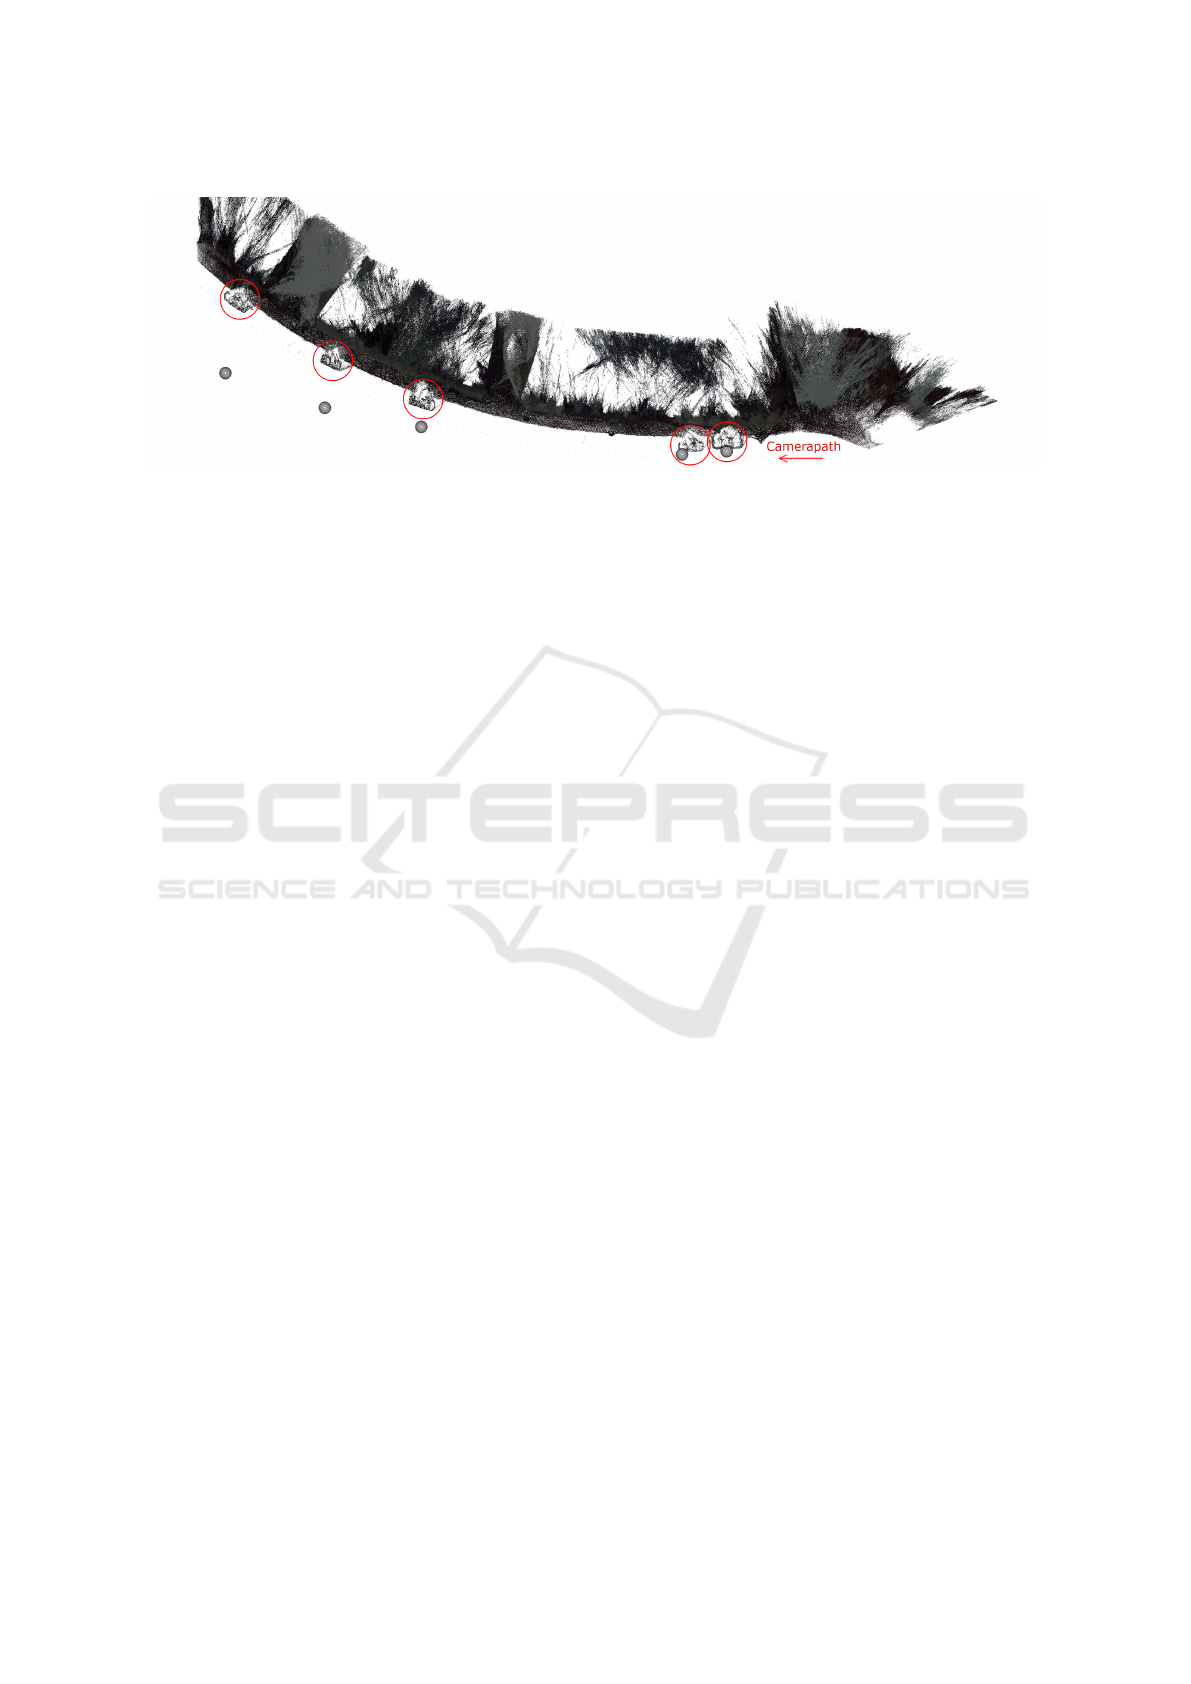
Figure 11: Imported standard objects at the detected positions of cars along a facade.
used. A corresponding license with access to the
Python API must be available to use it. On the other
hand, the free open-source program Meshroom can be
used for reconstruction.
The differences between the two used programs
were examined in detail. For all examples used in this
work, the proprietary program Metashape generally
gave better results.
By calculating the occlusion of individual objects,
it is already possible to roughly divide the various ob-
jects within a scene according to the ability of being
reconstructed. It can already be estimated if an object
is suitable for reconstruction or whether it is too much
hidden by other objects in front of it.
Furthermore, with the scripts created in this work,
it is possible to cut the resulting 3D models and
import them into the game engine Unity via a cre-
ated graphical user interface. Not only newly recon-
structed models can be imported during the process
chain. It is also possible to import detected, recurring
objects in the form of standard objects.
It was shown that the calculation of the object po-
sitions within certain scenarios already matches the
recorded data with sufficient accuracy. Standard ob-
jects can thus be included in newly reconstructed sce-
narios but they require some manual corrections by
the user to compensate the shift. For the placement of
the reconstructed 3D objects, however, only a single
position specification is used so far. Depending on the
accuracy of the image arrangement within the recon-
struction program, this can lead to a general inaccu-
racy in positioning, especially in the case of longer,
connected objects.
During the recording of connected building fa-
cades, general position deviations were also detected.
The position calculated by the camera deviates more
and more from reality during the recording of house
facades. Due to the rearrangement of the images dur-
ing the reconstruction of the 3D objects, the posi-
tions subsequently deviate more with increasing cam-
era movement. The objects can therefore only be ap-
proximately positioned.
6 OUTLOOK
Autonomous inland shipping is currently being re-
searched in the ongoing project ”Autonomes Binnen-
schiff – Simulation und Demonstration von automa-
tisiertem Fahren in der Binnenschifffahrt”. Sensors
from a real prototype ship are simulated to validate
and improve the control algorithms. Afterwards these
algorithms are tested in the simulation and on the
ship. Especially for the cameras, the simulation envi-
ronment has to be as realistic as possible with photo-
realistic textures and objects. In this research project,
the presented process chain will be adapted to the
changed environment and used to simplify the gen-
eration of it.
Further development of the entire process chain
will be carried out besides these specific adaptations.
By implementing the automatic evaluation of the suit-
ability for reconstruction and the resulting models
themself, the degree of automation will be further in-
creased. Next to this evaluation, using the already cal-
culated occlusion value, all used images will be eval-
uated in terms of quality. Bad images, such as blurry
ones, will be discarded in further updates of the pro-
cess chain.
Through the use of additional sensors, such as dif-
ferential GPS, gyroscope and accelerometer, the po-
sitioning of the reconstructed objects will be further
improved. Furthermore multiple images and their cor-
responding positions in real world coordinates will be
regarded for the reconstruction process.
Toolchain Development for Automated Scene Reconstruction using Artificial Neural Network Object Detection and Photogrammetry for the
Application in Driving Simulators
33

ACKNOWLEDGEMENTS
The ongoing research in the project ”Autonomes Bin-
nenschiff – Simulation und Demonstration von au-
tomatisiertem Fahren in der Binnenschifffahrt”, in
which the presented process chain will be used and
improved, is funded by the European Regional De-
velopment Fund (ERDF).
REFERENCES
Agisoft LLC (2018). Agisoft Metashape User Manual, Pro-
fessional Edition, 1.5 edition.
Agisoft LLC (2020). Agisoft metashape.
https://www.agisoft.com/; Last visited 06.03.2020.
AlexeyAB (2018). Github zed-yolo.
https://github.com/stereolabs/zed-yolo; Last vis-
ited 31.01.2020.
AliceVision (2020). Alicevision, meshroom.
https://alicevision.org; Last visited 06.03.2020.
Donath, D. (2009). Photogrammetrie. Vieweg+Teubner,
Wiesbaden.
He, K., Zhang, X., Ren, S., and Sun, J. (2016). Deep resid-
ual learning for image recognition. In Proceedings of
the IEEE conference on computer vision and pattern
recognition, pages 770–778.
Kuznetsova, A., Rom, H., Alldrin, N., Uijlings, J. R. R.,
Krasin, I., Pont-Tuset, J., Kamali, S., Popov, S., Mal-
loci, M., Duerig, T., and Ferrari, V. (2018). The open
images dataset V4: unified image classification, object
detection, and visual relationship detection at scale.
CoRR, abs/1811.00982.
Redmon, J., Divvala, S. K., Girshick, R. B., and Farhadi, A.
(2015). You only look once: Unified, real-time object
detection. CoRR, abs/1506.02640.
Redmon, J. and Farhadi, A. (2016). YOLO9000: better,
faster, stronger. CoRR, abs/1612.08242.
Redmon, J. and Farhadi, A. (2018). Yolov3: An incremental
improvement. arXiv preprint arXiv:1804.02767.
Schonberger, J. L. and Frahm, J.-M. (2016). Structure-
from-motion revisited. In Proceedings of the IEEE
Conference on Computer Vision and Pattern Recogni-
tion, pages 4104–4113.
Shashi, M. and Jain, K. (2007). Use of amateur cameras in
architectural photogrammetry. In Map World Forum,
Hyderabad, India.
Stereolabs Inc. (2020). Stereolabs zed 2k stereo camera.
https://www.stereolabs.com/; Last visited 07.02.2020.
Szeliski, R. (2010). Computer Vision: Algorithms and Ap-
plications. Springer-Verlag, Berlin, Heidelberg, 1st
edition.
Westoby, M. J., Brasington, J., Glasser, N. F., Hambrey,
M. J., and Reynolds, J. (2012). Structure-from-motion
photogrammetry: A low-cost, effective tool for geo-
science applications. Geomorphology, 179:300–314.
Wu, C. (2013). Towards linear-time incremental structure
from motion. In 2013 International Conference on
3D Vision-3DV 2013, pages 127–134. IEEE.
Wu, C., Agarwal, S., Curless, B., and Seitz, S. M. (2011).
Multicore bundle adjustment. In CVPR 2011, pages
3057–3064. IEEE.
SIMULTECH 2020 - 10th International Conference on Simulation and Modeling Methodologies, Technologies and Applications
34
