
Commit–Defect and Architectural Metrics–based Quality Assessment
of C Language
Devansh Tiwari
1
, Hironori Washizaki
1
, Yoshiaki Fukazawa
1
, Tomoyuki Fukuoka
2
, Junji Tamaki
2
,
Nobuhiro Hosotani
2
, Munetaka Kohama
2
, Yann-Ga
¨
el Gu
´
eh
´
eneuc
3
and Foutse Khomh
4
1
Waseda University, Tokyo, Japan
2
eXmotion Co. Ltd., Tokyo, Japan
3
Concordia University, Montreal, Canada
4
Polytechnique Montr
´
eal, Montreal, Canada
Keywords:
Software Architecture, C Language, Dependency Graph, Software Metric Analysis, Code Smells, Defect
Prediction, Commit History.
Abstract:
The foundation of any software system is its design and architecture. Maintaining and improving the ar-
chitecture and design as systems grow are difficult tasks. Many studies on the architecture and design of
object-oriented systems exist but only few studies pertain to the architecture and design of procedural systems.
Herein we study the quality of systems for the C language, and investigate how dependencies and associated
metrics among files, functions, and modules are related to defects. We also investigate whether a set of static,
dependency, and social-network metrics are related to problems in the architecture. Additionally, we examine
the bug fixing commits from the commit history and the relations among bug-fixing commits and metrics.
Thirteen open source systems from trending GitHub projects are used for study. We found that files with a
high number of bug fixing commits are correlated to higher cycles and centrality, indicating that key files of
the architecture in C systems are the same files causing issues in the development process. We identify some
version releases having huge impact on architecture and files which could be considered at high risk and need
more attention.
1 INTRODUCTION
Software architecture, which is the backbone of any
software system, is error prone. Although costly to
maintain and evolve, it directly affects the quality of
software systems (Capilla et al., 2016). Bug fixing
is just 17% of the maintenance costs, while enhance-
ment is 60% (Glass, 2001). These enhancements
include corrective (bug fixing), preventative, perfec-
tive and adaptive maintenance comprising fixing and
refactoring the architecture at several stages (McCor-
mack, 2019).
Previous studies have investigated software ar-
chitecture maintenance, improvement, and defect
detection/prediction, including architecture recovery
(Erdemir et al., 2011; Mancoridis et al., 1999), de-
pendency assessments (Cai et al., 2019), and metrics
(E.J. Newman and Girvan, 2004). Bug fixes during
the software evolution are also related to the soft-
ware architecture, since architecture is an abstraction
of code.
The evolution of software quality and architec-
ture can largely be encapsulated by version control
systems with their whole history of commits and re-
leases (Weicheng et al., 2013; Behnamghader et al.,
2017; Tufano et al., 2017). We identified several ar-
chitecture level metrics in literature, and used them
to quantify the dependencies. We also used measures
like number of fixing commits and age of file to in-
vestigate relation with evolution of architecture.
The majority of previous works on software ar-
chitecture assessment and risk detection has focused
on object-oriented programming languages like C#,
C++, or Java. Many tools for architecture systems in
these languages are available (Xiao et al., 2014; Lat-
tix, 2019). In contrast, research on the software archi-
tecture for procedural languages like C are lacking, al-
though procedural languages are common in industry,
like operating systems, embedded systems and sev-
eral applications. Despite the fact that architecture is
idealised to be language independent, developers do
develop a bias keeping implementation requirements
Tiwari, D., Washizaki, H., Fukazawa, Y., Fukuoka, T., Tamaki, J., Hosotani, N., Kohama, M., Guéhéneuc, Y. and Khomh, F.
Commit–Defect and Architectural Metrics–based Quality Assessment of C Language.
DOI: 10.5220/0009582205790586
In Proceedings of the 15th International Conference on Evaluation of Novel Approaches to Software Engineering (ENASE 2020), pages 579-586
ISBN: 978-989-758-421-3
Copyright
c
2020 by SCITEPRESS – Science and Technology Publications, Lda. All rights reserved
579

in mind. Moreover, even assuming the architecture to
be language independent, improving and refactoring
the software require changes at implementation level,
unlike to initial goal of architecture. Thus we need to
investigate software in flipped manner, from imple-
mentation to architecture.
Herein we study C systems to assess their defect-
metrics evolution and its relationship with the soft-
ware architecture. We focus on dependency view-
point of architecture, which is a controllable aspect,
and commit data which is historical behaviour to pro-
vide developers with decisive information to alter
implementation and conduct refactoring accordingly.
We answer the following research questions (RQs):
• RQ1. What is the distribution of dependency met-
rics, social network analysis (SNA) metrics and
commit history data over a set of C projects?
This question assesses whether the metrics used
in evaluations can identify distinctive quality fea-
tures and discriminate between different architec-
tures. Visualization techniques are used to verify
whether metrics deviations are in sync with archi-
tectural abnormalities.
• RQ2. What are the relations among the met-
rics? Do these metrics impact the number of bug
fixes/defects?
Here, we determine the importance of each
metric to evaluate the architecture. It helps iden-
tify whether these metrics are related to defects in
the software product.
• RQ3. How do metrics and defects grow through-
out the commit timeline of the software, and do
they show relation with dependency and social-
network based metrics?
This question investigates the growth of metrics
as the project grows using the commit histories of
the system. It helps to determine whether metrics
are able to show congruence with architectural de-
velopments.
The rest of this paper is divided as follows. Section 2
provides the background and related works. Section 3
reviews the experimental setup and data description.
Section 4 presents the results and evaluation. Sections
5 and 6 discuss the threats to validity and conclusions,
respectively.
2 RELATED WORK
The architecture has the most profound effect on the
technical and financial aspects of software, but most
of the architectural studies have investigated objected-
oriented systems. Since those systems inherently
induce OO design principles, adherence to quality
standards is anticipated (Tiwari et al., 2019). Re-
searchers and industries have developed various tools,
which provide an architectural-level visualization and
quality feedback. Few examples are eUML2
1
and
JetBrains IDE
2
or Jetbrains CLion
3
. There is also
SonarQube
4
, which interestingly has C language sup-
port, but unfortunately is not part of an open source
project. Moreover, the majority of related work are
code-level analysis and lack architecture-level sup-
port. Various architecture-level metrics have been de-
fined to quantify the quality. The Q value (E.J. New-
man and Girvan, 2004) was introduced to quantify
the randomness of the architecture, propagation cost
(MacCormack et al., 2006) measures the extent that
change can be propagated in a dependency graph,
and Decoupling Level (Mo et al., 2016) can tell
how easy it is to decouple an architecture. Several
other community-based modularity metrics proposed
by Newman (Newman, 2006) also help find patterns
in the architecture.
The evolution of software systems reveals un-
derlying assumptions, which are usually not docu-
mented. Tacit knowledge, or undocumented assump-
tions used by developers to make design decisions, are
major issues when searching for the reasons behind a
specified architecture design (Kruchten et al., 2006).
Most developers have their own assumptions, which
sometimes conflict (Tang, 2011). These types of ar-
chitecture assumptions should be more prevalent in
C due to its highly flexible nature, as developers can
exhaustively decide on the structure, complexity, and
intricate connections. Although a few recent studies
have investigated the C language architecture (Tiwari
et al., 2019; Biaggi et al., 2018), they discussed the
static state of software with dependencies, but did not
explore the defect and evolution aspect.
3 EXPERIMENTAL SETUP AND
DATA
Figure 1 shows the flow of our study. It can be di-
vided into four parts: (i) Architecture Representation
(ii) Dependency and SNA Metrics (iii) Fixing Com-
mits and Evolutionary Analysis (iv) Project Data
1
http://soyatec.com/euml2/
2
https://jetbrains.com/help/idea/module-dependencies-tool
-window.html
3
https://www.jetbrains.com/clion/
4
https://www.sonarqube.org/
ENASE 2020 - 15th International Conference on Evaluation of Novel Approaches to Software Engineering
580
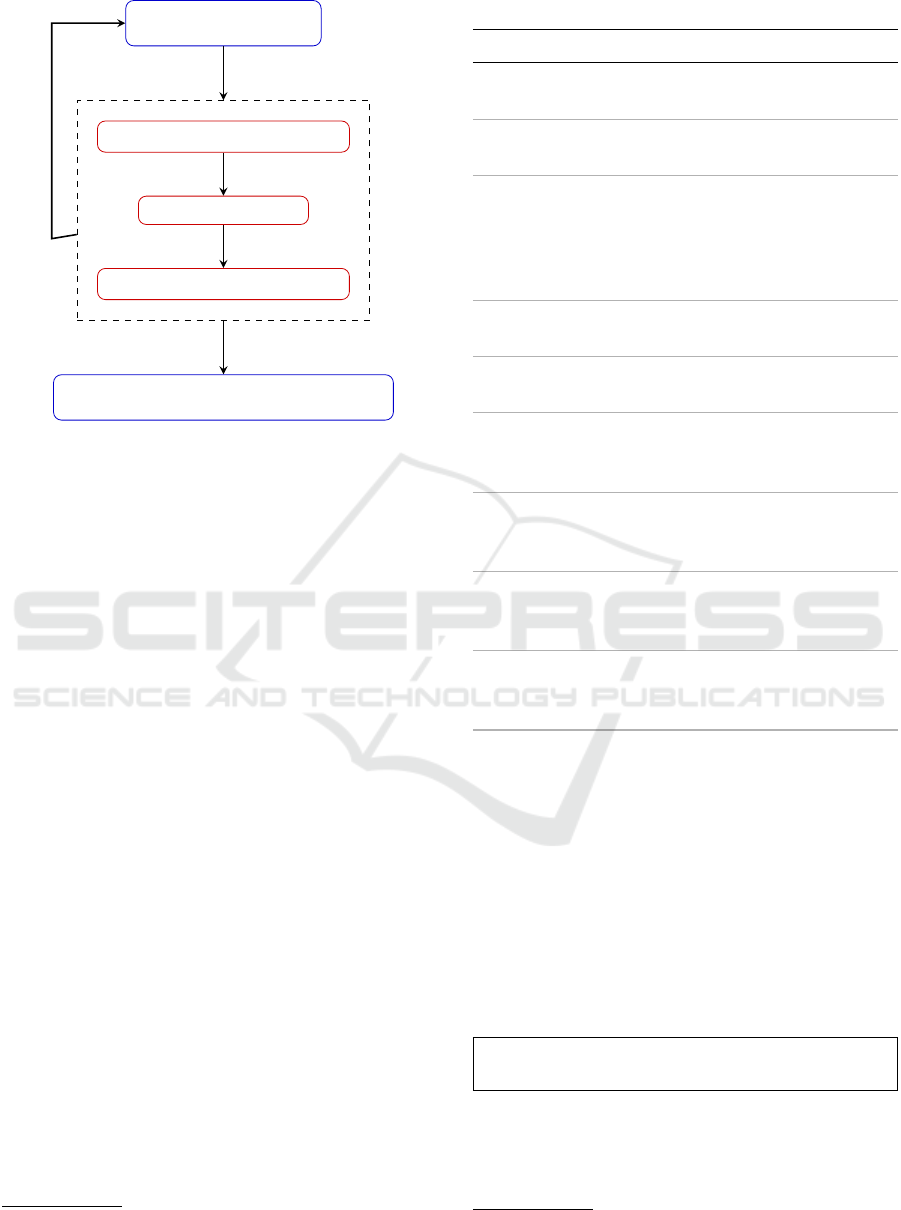
C Project Source Code
Dependency Graph Generator
Metrics Generator
Bug Fixing Commit Analyzer
Relationships among metrics and defects
Java & Python Tool
For all Projects
Figure 1: Flow Diagram.
3.1 Architecture Representation
Software architecture representation depends on the
language and context. Dependencies in C language
are represented as either include dependencies (in-
cluding files in the header) or symbol dependencies
(function calls). It has been shown that symbol depen-
dencies capture the architecture better than include
dependencies (Lutellier et al., 2015). We used symbol
dependencies to generate dependency graphs. Mod-
ules in the case of C language are terminal directo-
ries. There may be several abstraction levels of the
representation of dependencies, namely function, file,
and module based. In our study, we pre-processed
C files before generating the architectural represen-
tation. We focused mainly on file and module de-
pendency graphs and their associated metrics. These
graphs were generated using cflow
5
and ctags
6
which
are incorporated in our tool.
3.2 Dependency and SNA Metrics
We used the generated dependency graphs to evaluate
several dependency graph-based and social network-
based metrics. Table 1 shows the metrics used and
the corresponding description. These metrics were
evaluated for each file contributing to the dependency
graph. We used NetworkX (Hagberg et al., 2008) to
assess the social network metrics and PyDriller (Spa-
dini et al., 2018) to extract commit data.
5
https://www.gnu.org/software/cflow/
6
http://ctags.sourceforge.net/
Table 1: File Dependency Graph-based Metrics.
Metric Name Explanation
In–degrees Number of all incoming function
calls from other files.
Out–Degrees Number of all outgoing function
calls to other files.
Fan-in/out
visibility
(MacCormack
et al., 2006)
Fan-in visibility is how much
other entities depend on a given
file. Fan-out visibility is how
much an entity depends on other
files.
External Func-
tions Called
Number of functions from other
modules called by each file
Average Pa-
rameters
Average parameters of functions
in a file
Degree Cen-
trality
A Social Network metric indicat-
ing the importance of a node us-
ing its in-degrees
Load Central-
ity
This represents the fraction of all
shortest paths that pass through a
given node
Betweenness
Centrality
This is the number of these short-
est paths that pass through a ver-
tex
Cycle Inclu-
sions
Number of times the node is in-
cluded in a cycle in its depen-
dency graph
3.3 Defect–Metric Analysis
The evolution of defects of a project can be captured
using the data from the version control. For each file,
we looped through all the commits affecting that file
from the project and calculated the total commits, bug
fixing commits, and average time taken (in weeks) to
fix defects. We also extracted the commit data for ver-
sions of the product to use in the analysis. We used the
following tokens taken from GitHub
7
to tag a commit
as bug fixing:
close, fix, resolve, fixed, fixes, closed, resolved, re-
solves
Table 2 contains the commit measures extracted for
the entire commit timeline and the respective expla-
nation. All four of the metrics were normalized using
the age of the file (in weeks) to account for higher
7
https://help.github.com/en/github/managing-your-work
-on-github/closing-issues-using-keywords
Commit–Defect and Architectural Metrics–based Quality Assessment of C Language
581

Table 2: Extracted measures from Commits for Each File.
Metric Name Explanation
All commits Number of commits for each
file/week
All modifications Number of modifications for
each file/week
Fixing Commits Number of fixing commits for
each file/week
Time taken to fix Average time taken in weeks to
fix the defects/bugs. PyDriller
uses the SZZ algorithm to eval-
uate the time.
commits for older files.
The commit measures and architecture metrics
can be divided into dependent and independent vari-
ables.
• Independent: In/Out degrees, Fan-in/out Visibil-
ity, External functions called, Average parame-
ters, Centralities, Cycles, All commits
• Dependent: Fixing commits, Time taken to fix
Picking one dependent variable at a time, we con-
ducted regression analysis to determine which factors
have large effect on the number of fixing commits and
time taken to fix.
3.4 Project Data
We used GitHub’s curated popular/trending projects,
to select the most popular C projects for our study
(on 14 September 2019). These projects were popular
due their high community engagement and size. We
manually checked the projects to verify that they con-
tained sufficient numbers of C files to generate com-
mit history and dependencies. Table 3 lists summary
of these projects. It shows the size of each project in
Kilo Lines of Code (KLOC). Next column is lines of
code written in C language, and last column is per-
centage of lines written in C language.
4 RESULTS AND EVALUATION
4.1 RQ1: Metrics Distribution
Figure 2 shows the distribution of 9 metrics over 13
projects. The projects are plotted in order of small
size to large size (kLoc). The variability of the met-
rics over all the projects indicates the difference in
Table 3: Projects Summary.
Project Name Commits
LOC (k)
Total C C%
libui 3945 41.9 18.3 43.7
libusb 1403 38.3 23.9 62.3
lvgl 2914 45.0 44.1 98.2
librdkafka 3210 89.1 72.9 81.8
Arduino 3377 134.8 78.0 57.9
mpv 47404 154.2 124.1 80.5
hashcat 6386 607.2 158.2 26.1
raylib 3338 178.9 158.9 88.8
numpy 21433 340.3 166.1 48.8
micropython 10669 254.2 200.0 78.7
nodemcu-firm. 2171 321.5 299.9 93.3
JohnTheRipper 2078 412.5 300.3 72.8
esp-idf 10062 569.0 478.0 84.0
their underlying assumptions. lvgl has the most com-
mits per week (Figure 2a) and is relatively active com-
pared to the other repositories. Arduino and raylib
have very few fixing commits (Figure 2b), indicating
these systems have stabilized and do not have frequent
releases. Due to the same reason, the time taken (Fig-
ure 2d) by these projects to fix bugs is also very small.
For fan-in and fan-out visibility (Figure 2e and Figure
2f), esp-idf, which is an IoT Development framework,
has a really high value. This is because it has a very
complex network and is difficult to comprehend. On
the other hand, projects like raylib and hashcat have
really low values. These projects have only a few files
with high fan-in and fan-out visibilities, and the rest
of the files communicate through them, suggesting a
better design decision.
We confirmed that each project has different distri-
bution, but the metrics behave according to char-
acteristics/complexity of each project, which pro-
vides higher comprehension of complexity in archi-
tecture. This also helps in identification of metric
anomalies in files, which should be further investi-
gated by developers.
4.2 RQ2: Metrics Relation
Table 4 shows the Pearson correlation and signifi-
cance level among the metrics for the project mpv.
Due to space constraints, the table is truncated to
the major metrics and only one project. We selected
project mpv as an example due to its large size and
high numbers of commits. Load centrality is signif-
icantly correlated with fixing commits and all com-
mits. External Functions Called is also highly corre-
lated to the fixing commits, indicating files with high
dependencies suffer from high defect proneness. In
ENASE 2020 - 15th International Conference on Evaluation of Novel Approaches to Software Engineering
582
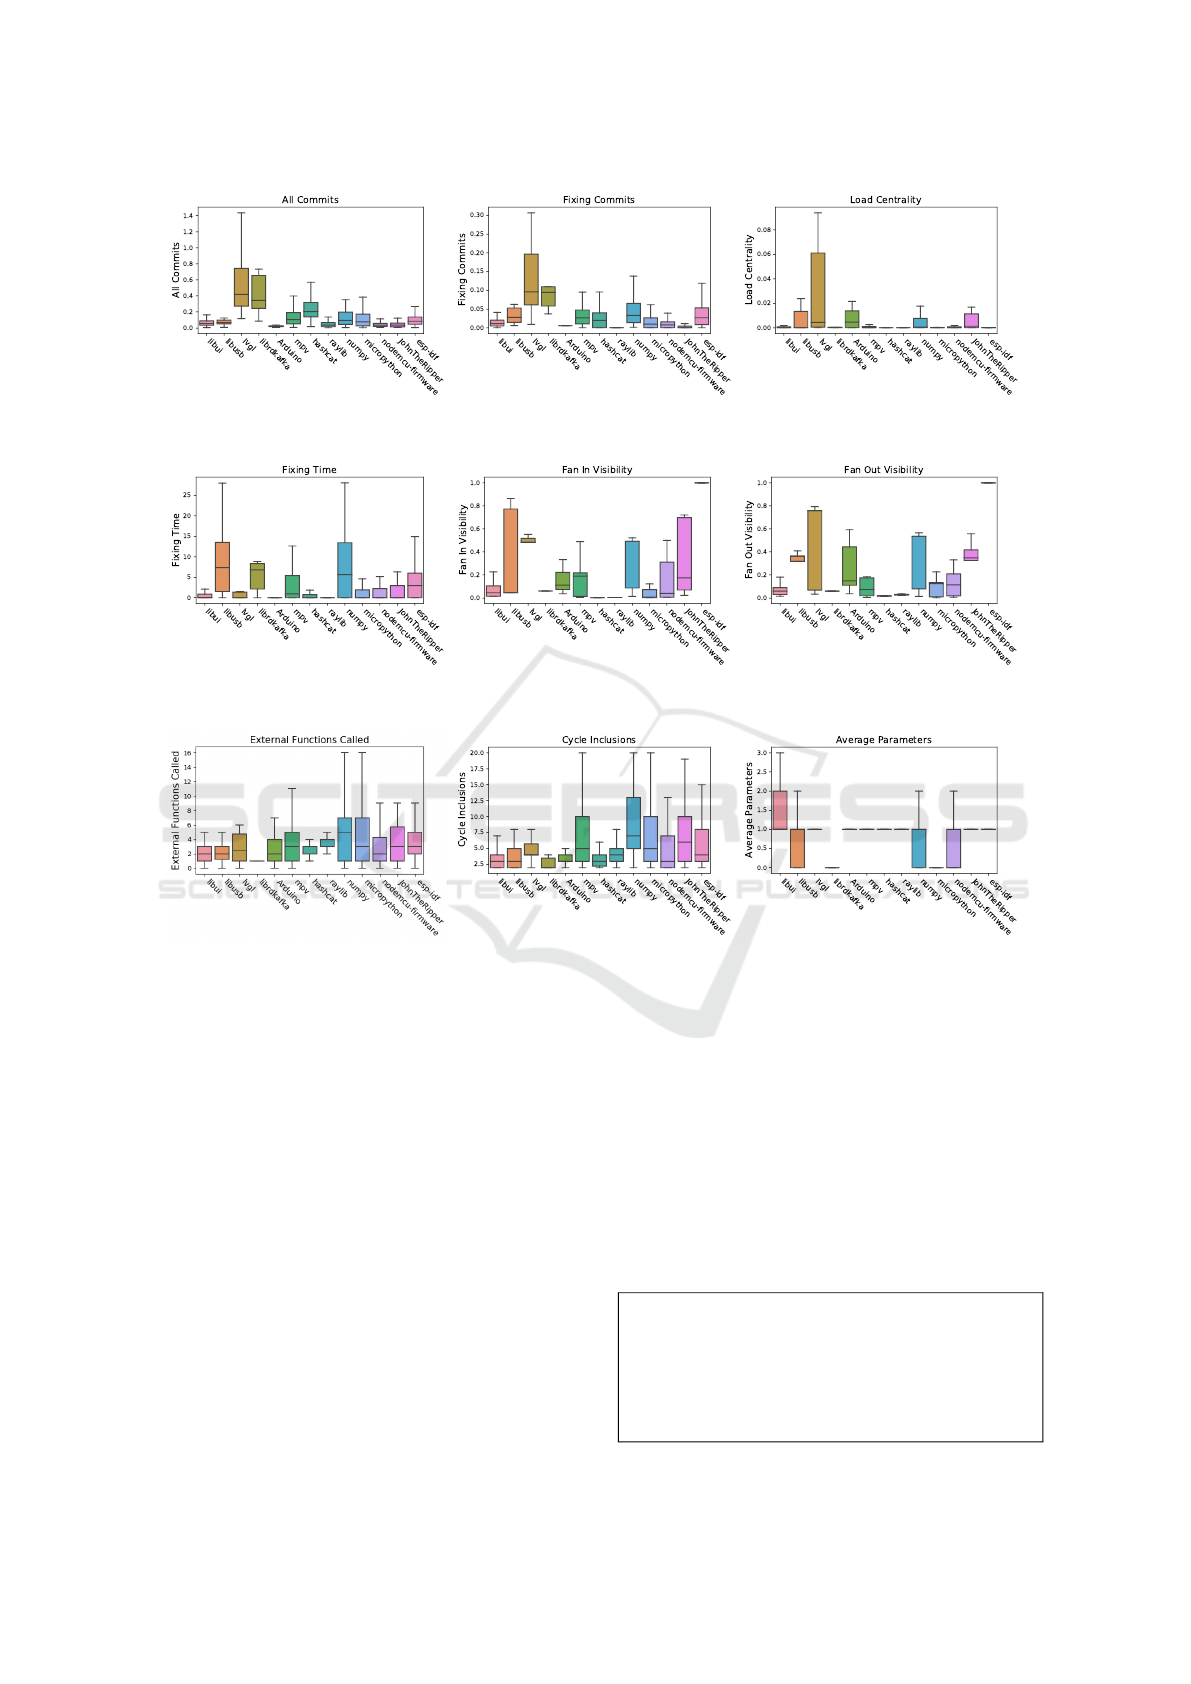
(a) All Commits/week (b) Fixing Commits/week (c) Load Centrality
(d) Fixing Time Taken/week (e) Fan-in Visibility (f) Fan-Out Visibility
(g) External Functions Called (h) Cycle Inclusions (i) Average Parameters
Figure 2: Metric Distributions.
this case, the fixing time is not highly correlated with
any other metric. However, it is somewhat correlated
in other projects. For example, in Arduino, the fix-
ing time is positively correlated with the number of
parameters, indicating the higher the number of pa-
rameters in a file’s methods, more time is required to
fix the file. Files having high fan-in as well as high
fan-out are at high risk, as it can be seen in Figure
2 that esp-idf, lvgl and numpy having high number of
fixing commits. We also conducted a correlation anal-
ysis with project-level metrics like propagation cost,
Q Value, and module dependencies and found that the
number of fixing commits is highly correlated to the
propagation cost.
Table 5 and Table 6 shows a truncated version
of the result for regression analysis with target vari-
able fixing commits and time taken to fix, respec-
tively. We identify Fan-out visibility and Load cen-
trality can significantly estimate the number of fix-
ing commits. Moreover, Fan-out visibility and degree
centrality have significantly high coefficient in esti-
mating time taken to fix. Hence, files with high fan-
out visibility show buggy behaviour than others. In-
terestingly, degree centrality has high effect on time
taken to fix, but negative effect in case of number of
fixing commits. It indicates that although the number
of bugs encountered in such files are low, fixing them
takes long time.
We identified correlations among centrality, fix-
ing commits, External Functions Called, indicating
files with high dependencies suffer from high de-
fect proneness. Fan-out visibility is also identified
having high effect on number of fixing commits and
corresponding fixing time.
Commit–Defect and Architectural Metrics–based Quality Assessment of C Language
583
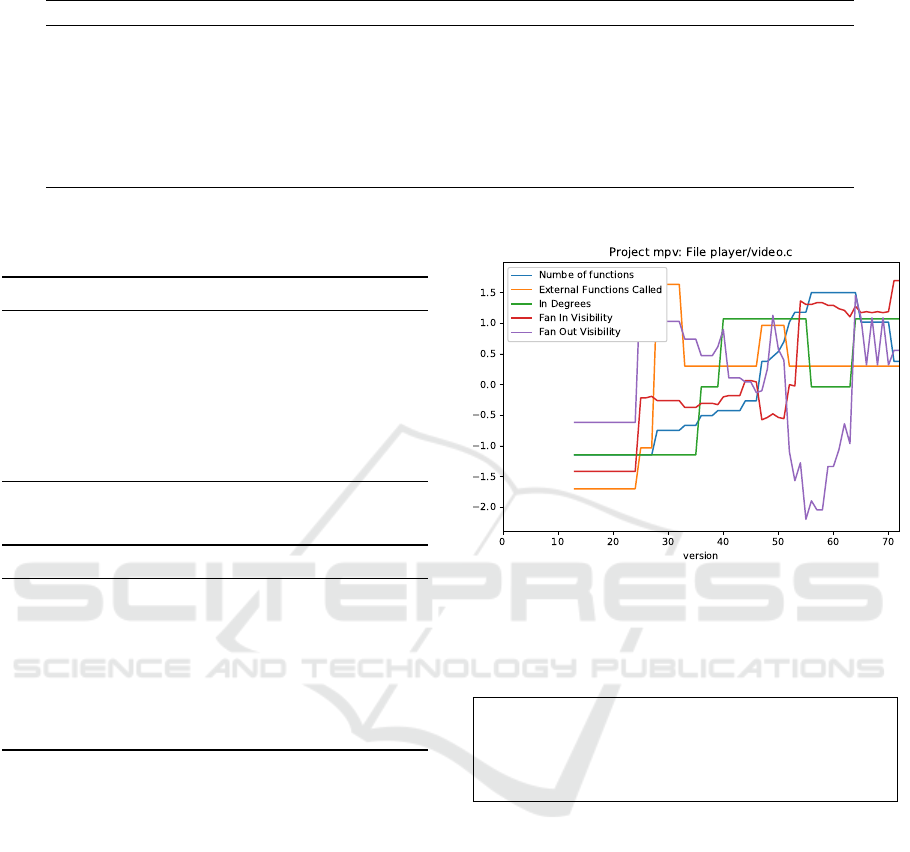
Table 4: Correlation Table for Dependency Metrics and SNA Metrics for Project mpv.
1 2 3 4 5 6 7 8
Out Degrees(1)
Fan-in Visibility(2) -0.09
Fan-out Visibility(3) 0.68*** -0.17
External Functions Called(4) 1.0*** -0.09 0.68***
Load Centrality(5) 0.66*** 0.09 0.44*** 0.66***
Cycle Inclusions(6) 0.61*** 0.47*** 0.31** 0.61*** 0.57***
Fixing Commits(7) 0.74*** -0.05 0.5*** 0.74*** 0.42*** 0.46***
All Commits (8) 0.78*** -0.04 0.5*** 0.78*** 0.46*** 0.5*** 0.98***
Time Given(9) 0.25* 0.01 0.22* 0.25* 0.17 0.13 0.23* 0.21
p < .0001 “ ∗ ∗ ∗ ∗”; p < .001 “ ∗ ∗ ∗ ”, p < .01 “ ∗ ∗”, p < .05 “ ∗ ”
Table 5: Regression Analysis, Target var=Time taken to fix.
Metric Name Estimate p value
No. of functions 0.0508 < 0.001
In Degrees −0.003 0.641
Fan-out Visibility 2.855 < 0.001
Ext. Functions Called 0.209 < 0.001
Average Parameters 0.115 0.268
Degree Centrality 8.371 < 0.001
Load Centrality −13.708 0.355
Table 6: Regression Analysis, Target var=Fixing Commits.
Metric Name Estimate p value
No. of functions < 0.001 < 0.001
In Degrees < 0.001 < 0.001
Fan-out Visibility 0.015 < 0.001
Ext. Functions Called 0.004 < 0.001
Average Parameters 0.001 0.233
Degree Centrality −0.030 0.133
Load Centrality 0.669 < 0.001
4.3 RQ3: Defect–Metrics Analysis
To understand the evolution of metrics, we chose the
file named video.c from project mpv because it has
the highest number of fixing commits. This file was
fixed once about every 3.3 weeks, which is the highest
in all files. This project has 73 released versions. Fig-
ure 3 shows how the values of metrics change through
the 73 versions. Since mpv is a fairly large project, it
has also been refactored many times. For easy visu-
alization, the metric values are min-max normalized.
The file video.c was created around version 12 and
the large refactoring around version 24 made it highly
dependent. It was later reduced but regained the com-
plexity as the product grew. Fan-out visibility, i.e.
dependence on other files was considerably reduced
around version 55, but it went high again in few ver-
sions. On inspection of version log, we found few
complex experimental features were added to the file
Figure 3: Normalized Metrics variation for Project mpv.
during this period, leading to high fan-out visibility.
Such observation shows it could be possible to find
major releases of the software using the commit data.
We confirmed that metric inflections can help
identify which version release introduced major
changes or experimental phases, and whether the
complexity in terms of metrics increased/decreased.
5 THREATS TO VALIDITY
Tufano (Tufano et al., 2017) showed that many archi-
tectural issues are present in a system since its incep-
tion and have a high serviceability. Therefore, analyz-
ing the initial commits in the evolution history might
provide some useful insights. We used the commit
history from Github for our evolution analysis. How-
ever, there is a risk of not capturing the file history
properly because what happens between two commits
is unknown (Weicheng et al., 2013).
Visualizing every project and their distribution
also poses problem of normalization. Even after nor-
malization, few projects’ range of metric values still
could not indicate the clarity in distribution. In the
experiment, we pre-processed the C files before gen-
ENASE 2020 - 15th International Conference on Evaluation of Novel Approaches to Software Engineering
584

erating dependency graphs, which is helpful in re-
moving the macros, but in turns creates a risk of pre-
processing failure. In that case, the whole file poses
risk of not getting processed. Another threat is that
if a project size is extremely big or very small, the
metrics values might not represent the true degree of
skewness.
6 CONCLUSION AND FUTURE
WORK
We believe that our discussed metrics and evolution-
ary analysis for C language help identify and local-
ize architecture anomalies in files, functions, version
releases as well as provide refactoring support. We
used file-based dependency graphs to generate so-
cial network and dependency metrics. These metrics
are strongly correlated with fixing commits, indicat-
ing files with a higher fixing frequency could have
unique patterns with the corresponding metrics. This
relation helps identify such files beforehand, allow-
ing preemptive actions to mitigate complex files and
modules that lead to breakdown to be taken. These
actions could include splitting huge files, separating
header file interfaces, or investing more resources (de-
velopers and time) to specific files/modules. We also
showed that the evolution of metrics as a product
grows and sudden changes indicate refactoring, ma-
jor bug fixes, or a defect induction.
Our study excluded module-based and function-
based metrics. In the future, we plan to use such de-
pendencies to gain insights on the modular and in-
tricate analysis of the relationships among modules,
files, architecture quality, and defects. The density
of fixing commits could identify files/modules which
face high dependency strain. This information will
allow developers to know entities in project that need
extra care. Moreover, we plan to add design rules and
new metrics, like decoupling level (Mo et al., 2016)
which will add additional descriptive ability for the
structure of project. The evolutionary phase could
use evolution models to quantify change (Aoyama,
2002), determining when and how the files and ver-
sions heavily changed, and their consequences in ar-
chitecture. Understanding the commit messages and
investigating phrase patterns in bug fixing and induc-
ing commits could also lead to insightful results.
The studied projects had high numbers of com-
mits, which totaled tens of thousands in some
projects. Thus we also plan to analyze the commit
messages for phrase pattern in bug fixing/inducing
commits. In future, we plan to parallelize our ap-
proach and study the evolution of metrics for all com-
mits, instead of versions. We will also include more
projects with varying size and different domains, as
this will help understand the relationship between
metrics, defects and domains.
REFERENCES
Aoyama, M. (2002). Metrics and analysis of software ar-
chitecture evolution with discontinuity. In Proceed-
ings of the International Workshop on Principles of
Software Evolution, IWPSE ’02, pages 103–107, New
York, NY, USA. ACM.
Behnamghader, P., Alfayez, R., Srisopha, K., and Boehm,
B. (2017). Towards better understanding of soft-
ware quality evolution through commit-impact anal-
ysis. In 2017 IEEE International Conference on Soft-
ware Quality, Reliability and Security (QRS), pages
251–262.
Biaggi, A., Fontana, F. A., and Roveda, R. (2018). An archi-
tectural smells detection tool for c and c++ projects.
In 2018 44th Euromicro Conference on Software En-
gineering and Advanced Applications (SEAA), pages
417–420.
Cai, Y., Xiao, L., Kazman, R., Mo, R., and Feng, Q. (2019).
Design rule spaces: A new model for representing and
analyzing software architecture. IEEE Transactions
on Software Engineering, 45(7):657–682.
Capilla, R., Jansen, A., Tang, A., Avgeriou, P., and Babar,
M. A. (2016). 10 years of software architecture
knowledge management: Practice and future. Jour-
nal of Systems and Software, 116:191 – 205.
E.J. Newman, M. and Girvan, M. (2004). Finding and eval-
uating community structure in networks. Physical re-
view. E, Statistical, nonlinear, and soft matter physics,
69:026113.
Erdemir, U., Tekin, U., and Buzluca, F. (2011). Object ori-
ented software clustering based on community struc-
ture. In 2011 18th Asia-Pacific Software Engineering
Conference, pages 315–321.
Glass, R. L. (2001). Frequently forgotten fundamental
facts about software engineering. IEEE Software,
18(3):112–111.
Hagberg, A. A., Schult, D. A., and Swart, P. J. (2008). Ex-
ploring network structure, dynamics, and function us-
ing networkx. In Varoquaux, G., Vaught, T., and Mill-
man, J., editors, Proceedings of the 7th Python in Sci-
ence Conference, pages 11 – 15, Pasadena, CA USA.
Kruchten, P., Lago, P., and van Vliet, H. (2006). Building
up and reasoning about architectural knowledge. In
Hofmeister, C., Crnkovic, I., and Reussner, R., edi-
tors, Quality of Software Architectures, pages 43–58,
Berlin, Heidelberg. Springer Berlin Heidelberg.
Lattix (2019). Lattix.
Lutellier, T., Chollak, D., Garcia, J., Tan, L., Rayside, D.,
Medvidovic, N., and Kroeger, R. (2015). Comparing
software architecture recovery techniques using accu-
rate dependencies. In 2015 IEEE/ACM 37th IEEE In-
ternational Conference on Software Engineering, vol-
ume 2, pages 69–78.
Commit–Defect and Architectural Metrics–based Quality Assessment of C Language
585

MacCormack, A., Rusnak, J., and Baldwin, C. Y. (2006).
Exploring the structure of complex software designs:
An empirical study of open source and proprietary
code. Manage. Sci., 52(7):1015–1030.
Mancoridis, S., Mitchell, B. S., Chen, Y., and Gansner,
E. R. (1999). Bunch: A clustering tool for the recov-
ery and maintenance of software system structures. In
Proceedings of the IEEE International Conference on
Software Maintenance, ICSM ’99, pages 50–, Wash-
ington, DC, USA. IEEE Computer Society.
McCormack, J. (2019). Fowler technical debt quad-
rant. http://users.monash.edu/
∼
jonmc/CSE2305/
Topics/13.25.SWEng4/html/text.html. Accessed: 3rd
December 2019.
Mo, R., Cai, Y., Kazman, R., Xiao, L., and Feng, Q.
(2016). Decoupling level: A new metric for archi-
tectural maintenance complexity. In 2016 IEEE/ACM
38th International Conference on Software Engineer-
ing (ICSE), pages 499–510.
Newman, M. E. J. (2006). Modularity and community
structure in networks. Proceedings of the National
Academy of Sciences, 103(23):8577–8582.
Spadini, D., Aniche, M., and Bacchelli, A. (2018). Py-
driller: Python framework for mining software repos-
itories. In Proceedings of the 2018 26th ACM Joint
Meeting on European Software Engineering Confer-
ence and Symposium on the Foundations of Software
Engineering, ESEC/FSE 2018, pages 908–911, New
York, NY, USA. ACM.
Tang, A. (2011). Software designers, are you biased?
In Proceedings of the 6th International Workshop
on SHAring and Reusing Architectural Knowledge,
SHARK ’11, pages 1–8, New York, NY, USA. ACM.
Tiwari, D., Washizaki, H., Fukazawa, Y., Fukuoka, T.,
Tamaki, J., Hosotani, N., and Kohama, M. (2019).
Metrics driven architectural analysis using depen-
dency graphs for c language projects. In 2019 IEEE
43rd Annual Computer Software and Applications
Conference (COMPSAC), volume 1, pages 117–122.
Tufano, M., Palomba, F., Bavota, G., Oliveto, R., Penta,
M. D., De Lucia, A., and Poshyvanyk, D. (2017).
When and why your code starts to smell bad (and
whether the smells go away). IEEE Transactions on
Software Engineering, 43(11):1063–1088.
Weicheng, Y., Beijun, S., and Ben, X. (2013). Mining
github: Why commit stops – exploring the relation-
ship between developer’s commit pattern and file ver-
sion evolution. In 2013 20th Asia-Pacific Software En-
gineering Conference (APSEC), volume 2, pages 165–
169.
Xiao, L., Cai, Y., and Kazman, R. (2014). Titan: A toolset
that connects software architecture with quality analy-
sis. In Proceedings of the 22Nd ACM SIGSOFT Inter-
national Symposium on Foundations of Software En-
gineering, FSE 2014, pages 763–766, New York, NY,
USA. ACM.
ENASE 2020 - 15th International Conference on Evaluation of Novel Approaches to Software Engineering
586
