
ATDx: Building an Architectural Technical Debt Index
Roberto Verdecchia
1
, Patricia Lago
1
, Ivano Malavolta
1
and Ipek Ozkaya
2
1
Vrije Universiteit Amsterdam, The Netherlands
2
Software Engineering Institute, Carnegie Mellon University, U.S.A.
Keywords:
Software Architecture, Technical Debt, Software Analytics, Software Metrics, Software Maintenance.
Abstract:
Architectural technical debt (ATD) in software-intensive systems refers to the architecture design decisions
which work as expedient in the short term, but later negatively impact system evolvability and maintainability.
Over the years numerous approaches have been proposed to detect particular types of ATD at a refined level
of granularity via source code analysis. Nevertheless, how to gain an encompassing overview of the ATD
present in a software-intensive system is still an open question. In this study, we present a multi-step approach
designed to build an ATD index (ATDx), which provides insights into a set of ATD dimensions building
upon existing architectural rules by leveraging statistical analysis. The ATDx approach can be adopted by
researchers and practitioners alike in order to gain a better understanding of the nature of the ATD present in
software-intensive systems, and provides a systematic framework to implement concrete instances of ATDx
according to specific project and organizational needs.
1 INTRODUCTION
Architectural Technical Debt (ATD) in a software-
intensive system denotes architectural design choices
which, while being suitable or even optimal when
adopted, lower the maintainability and evolvability of
the system in the long term, hindering future develop-
ment activities (Li et al., 2015b). With respect to other
types of debt, e.g., test or build debt(Li et al., 2015a),
ATD is characterized by being widespread throughout
code-bases, mostly invisible (Kruchten et al., 2012),
and of high remediation costs.
Due to its impact on software development prac-
tices, and its high industrial relevance, ATD is attract-
ing a growing interest within the scientific commu-
nity and software analysis tool vendors (Verdecchia
et al., 2018). Notably, over the years, numerous ap-
proaches have been proposed to detect, mostly via
source code analysis, ATD instances present in soft-
ware intensive-systems. Such methods rely on the
analysis of symptoms through which ATD manifests
itself, and are conceived to detect specific types of
ATD by adopting heterogeneous strategies, ranging
from the inspection of bug-prone components (Xiao
et al., 2016), to the analysis of dependency anti-
patterns (Arcelli Fontana et al., 2017), maintainability
issues (Malavolta et al., 2018), and the evaluation of
components modularity (Martini et al., 2018b). Addi-
tionally, numerous static analysis tools, such as NDe-
pend
1
, CAST
2
, and SonarQube
3
, are currently avail-
able on the market, enabling to keep track of tech-
nical debt and architecture-related issues present in
code-bases. Both academic and industrial approaches
currently focus on fine-grained analysis techniques,
considering ad-hoc definitions of technical debt and
software architecture, in order to best fit their anal-
ysis processes. Nevertheless, to date, how to gain an
encompassing overview of the (potentially highly het-
erogeneous) ATD present in a software-intensive sys-
tem is still an open question.
In order to fill this gap, in this study we present
ATDx, an approach designed to provide data-driven,
intuitive, and actionable insights on the ATD
present in a software-intensive system. ATDx con-
sists of a theoretical, multi-step, and semi-automated
process, concisely entailing (i) the inclusion of archi-
tectural rules supported by pre-existing analysis tools,
(ii) the identification of outlier values (after normal-
ization) via statistical analysis, and (iii) the aggrega-
tion of analysis results into a set of customizable ATD
dimensions. ATDx is meant to serve two types of
stakeholders: (i) researchers conducting quantitative
studies on source-related ATD and (ii) practitioners
carrying out software portfolio analysis and manage-
1
https://www.ndepend.com
2
https://www.castsoftware.com/
3
https://www.sonarqube.org
Verdecchia, R., Lago, P., Malavolta, I. and Ozkaya, I.
ATDx: Building an Architectural Technical Debt Index.
DOI: 10.5220/0009577805310539
In Proceedings of the 15th International Conference on Evaluation of Novel Approaches to Software Engineering (ENASE 2020), pages 531-539
ISBN: 978-989-758-421-3
Copyright
c
2020 by SCITEPRESS – Science and Technology Publications, Lda. All rights reserved
531

ment, to suitably detect ATD items and get actionable
insights about the ATD present in their systems ac-
cording to their organizational and technical needs.
We discuss a set of benefits and drawbacks which
characterize the current ATDx definition, which were
identified from a viability investigation of ATDx.
Among other, the most relevant characteristics of
ATDx are: analysis tool and programming language
independence, (ii) data-driven results at multiple lev-
els of granularity, (iii) extensibility, and (iv) customiz-
ability to specific application domains.
The main contributions of the paper are: (i) the
ATDx approach for building a multi-level index of
ATD, (ii) the description of the process for building
an instance of ATDx, and (iii) a thorough discussion
of the limitations and drawbacks of ATDx.
The remainder of the paper is structured as fol-
lows. In the next section, we present the theoret-
ical framework underlying the ATDx approach. In
Section 3 we document the steps entailed in the im-
plementation of a concrete instance of ATDx. Sec-
tion 4 discusses the main benefits and drawbacks of
the ATDx approach, which emerged from a viability
investigation. In Section 5 the related work to our
study is presented. Finally, Section 6 reports on the
conclusions of the study and the future work.
2 THE ATDx APPROACH
In this section we present the definitions on which the
calculation of ATDx relies (Section 2.1), followed by
the description of the approach (Section 2.2).
2.1 Definitions
Definition 1. Architectural Rule. Given a source
code analysis tool T and its supported analysis rules
R
T
, the architectural rules AR
T
supported by T
are defined as the subset of all rules R
T
i
∈ R
T
, i =
{1, . . . , |R
T
|} such that:
• R
T
i
is relevant from an architectural perspective;
• R
T
i
is able to detect a technical debt item, i.e., a
design or implementation construct that is expe-
dient in the short term, but set up a technical con-
text that can make future changes more costly or
impossible (Avgeriou et al., 2016).
We consider every AR
T
i
as a function AR
T
i
: E →
{0, 1}, where E is the set of architectural elements
according to a granularity level (see below). In case
that an element e ∈ E violates rule AR
T
i
, then AR
T
i
(e)
will return 1, and 0 otherwise.
For example, a rule AR
T
i
checking if the
java.lang.Error is extended in a Java system is (i)
architectural since it predicates on the high-level de-
sign of Java-based systems, and (ii) related to techni-
cal debt since the design of the Java Virtual Machine
(JVM) assumes that java.lang.Error and its sub-
classes are managed only by the JVM.
—noindent Definition 2. Granularity Level.
Given an architectural rule AR
T
i
, its granularity level
Gr
T
i
is defined as the smallest unit of the system be-
ing analysed which may violate AR
T
i
, e.g., a class, a
method, or a line of code. As an example, if we con-
sider a rule which deals with cloned classes, its corre-
sponding granularity level is “class”.
The ad-hoc mapping of design rules to different
granularity levels enables us to evaluate and com-
pare the occurrence of rules violations across differ-
ent software projects at a refined level of precision,
instead of trivially adopting a single metric for the
size of software projects for all the rules in AR
T
, e.g.,
source lines of code (SLOC).
Definition 3. ATD Dimension. Given a set of ar-
chitectural rules AR
T
, the set of ATD dimensions
ATDD
T
represents a set of clusters of architectural
rules AR
T
i
⊆ AR
T
with similar focus. One architec-
tural rule AR
T
i
can belong to one or more ATD dimen-
sions ATDD
T
j
⊆ ATDD
T
and the mapping between
AR
T
i
and ATDD
T
j
is established by generalizing the
semantic focus of AR
T
i
.
For example, if an architectural rule AR
T
i
deals
with the conversion of Java classes into Java inter-
faces, the AR
T
i
could fall under the general “Interface”
ATD dimension (for further details on the identified
ATD dimensions and their establishment, refer to Sec-
tion 3.2).
We use the 3-tuple hAR
T
i
, ATDD
T
j
, Gr
T
i
i, as the
mapping of each architectural rule AR
T
i
to its gran-
ularity level Gr
T
i
, and one or more ATD dimensions
ATDD
T
j
. It is important to note that, while an AR
T
i
can be associated to one and only one granularity level
Gr
T
i
, an AR
T
i
can be mapped to multiple ATDD
T
j
s, and
vice versa.
2.2 Approach Description
ATDx aims to provide a birds-eye view of the ATD
present in a software-intensive system by analyz-
ing the set of architectural rules AR
T
supported by
an analysis tool T , and subsequently aggregating
the analysis results into different ATD dimensions
ATDD
T
. Intuitively, starting from an already available
large-scale dataset of AR
T
executions NORM
T
and a
System Under Analysis SUA, ATDx performs a sta-
tistical analysis of all elements in NORM for detect-
ENASE 2020 - 15th International Conference on Evaluation of Novel Approaches to Software Engineering
532

ing anomalous occurrences of architectural rule viola-
tions in SUA. If the SUA exhibits an anomalous num-
ber of violations of a certain rule AR
T
i
∈ AR
T
, then
the corresponding ATD dimension ATDD
T
i
∈ ATDD
T
mapped to AR
T
i
is incremented. In a sense, ATDx rep-
resents the synthetized facets of ATD (derived from
the architectural rules in AR
T
), rather than the total
ATD present in the system.
ATDx leverages the calculation of the number of
architectural rule violations of a System S over the
size of S in order to compare the occurrence of rule
violations across projects of different sizes. Specifi-
cally, for each AR
T
i
, we first calculate the set of vio-
lations of AR
T
i
in a system by defining AR
T
i
(S) as the
union of all violations of AR
T
i
in S, i.e.,
AR
T
i
(S) =
[
e∈Gr
T
i
(S)
ar
T
i
(e) (1)
where Gr
T
i
(S) is the set of all elements e in S accord-
ing to the granularity Gr
T
i
(e.g., the set of all classes in
a Java-based system), and ar
T
i
(e) is a function return-
ing e if the element e violates the architectural rule
AR
T
i
, the empty set otherwise.
Subsequently, we calculate NORM
T
i
(S), defined
as the normalized number of architectural rule vio-
lations |AR
T
i
(S)| over the total number of elements e
according to granularity Gr
T
i
, i.e.
NORM
T
i
(S) =
|AR
T
i
(S)|
|Gr
T
i
(S)|
(2)
where |Gr
T
i
(S)| is the cumulative size of S expressed
according to granularity level Gr
T
i
, and |AR
T
i
(S)| is
the total number of violations of rule R
T
i
(see For-
mula 1).
Once the NORM
T
i
(S) for S is calculated, we sta-
tistically detect if it exhibits an anomalous value. In
order to do so, we require the set NORM
T
i
, which
contains the values of NORM
T
i
(S) for each software
project belonging to a pre-defined set of software
projects, i.e.,
NORM
T
i
= {NORM
T
i
(S
1
), . . . , NORM
T
i
(S
n
)} (3)
where n is the total number of projects belonging to
the dataset of software projects considered. Given the
calculation of NORM
T
i
, we can identify if NORM
T
i
(S)
constitutes an anomalous measurement by comparing
its value with the other ones contained in NORM
T
i
.
Specifically, given the set of values NORM
T
i
and the
value of NORM
T
i
(S), we define the function outlier
as: outlier : X
n
× [0, 1] → {0, 1}, where X = [0, 1];
outlier returns 1 if NORM
T
i
(S) is greater than the up-
per inner fence of NORM
T
i
, and 0 otherwise.
4
4
If Q1 and Q3 are the lower and upper quartiles of a set
In order to provide an overview of the ATD di-
mensions of a system S, for each ATD dimension
ATDD
T
j
⊆ ATDD
T
we define the value of ATDD
T
j
(S)
as the average number of outlier values of the AR
T
i
mapped to it, i.e.,
ATDD
T
j
(S) =
∑
n
i=1
outlier(NORM
T
i
, NORM
T
i
(S))
n
(4)
where n is the total number of rules in AR
T
mapped
to ATDD
T
j
.
Finally, we also define an overall value
AT Dx
T
(S), embodying the overall architectural
technical debt of S calculated via our algorithm, as
the average value of all the defined ATD dimensions
ATDD
T
, i.e.
AT Dx
T
(S) =
∑
n
j=1
ATDD
T
j
n
(5)
where n is the total number of ATD dimensions
ATDD
T
considered.
3 ATDx BUILDING STEPS
In this section, we document the steps required in or-
der to build ATDx. Specifically, the implementation
process documented in this section is presented in a
generic fashion, i.e., it is not bound to any specific
analysis tool or technology. The described process
can be performed by both (i) researchers investigat-
ing ATD phenomena, and (ii) practitioners analyzing
their software portfolios. In fact, following the de-
scribed theoretical steps allows to implement the in-
stance of ATDx which best fits the specific technical,
organizational, and tool-related needs considered.
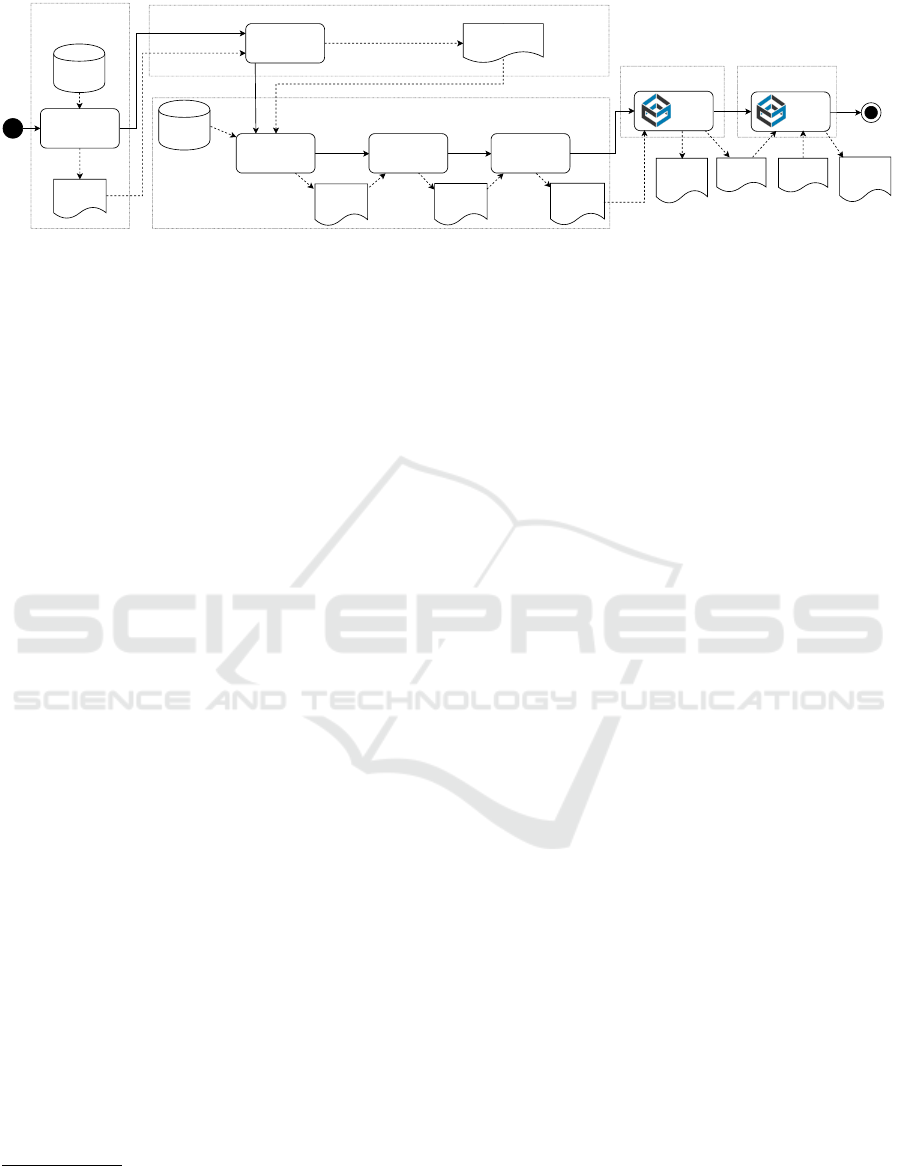
Fig. 1 presents the main steps of the ATDx ap-
proach. Given an analysis tool T, five steps are re-
quired to build an instance of ATDx, namely: (i) the
identification of the architectural rules belonging to
AR
T
, (ii) the formulation of the 3-tuples of the form
hAR
T
i
, Gr
T
i
, ATDD
T
j
i, (iii) the execution of T on a
set of already available software projects to form the
dataset of AR
T
i
(S) measurements, (iv) the execution
of the ATDx analysis on the constructed dataset, and
(v) the application of the ATDx approach on the spe-
cific system under analysis (SUA).
3.1 Step 1: Identification of the AR
T
Set
The first step of the ATDx building process consists in
the identification of a set of architectural rules AR
T
on
of observations, respectively, then the upper inner fence lies
at Q3 + 1.5(Q3 - Q1) (Frigge et al., 1989). Informally, the
upper inner fence is the theoretical value lying at the top of
the upper whisker of a boxplot.
ATDx: Building an Architectural Technical Debt Index
533
AR
T
Identification
AR
T
Software
Repository
Mining
Initial
Repository
Dataset
Repository
Filtering
Final
Repository
Dataset
Manual
AR
T
Classification
3-tuple
(AR
T
,Gr
T
,ATDD
T
)
ATDx
Analysis
AR
T
(S)
Calculation
ATDD
T
(S),
ATDx
T
(S)
Values
STEP1-
AR
T
SetIdentification
STEP3-AR
T
DatasetBuilding
STEP2-3-tupleFormulation
STEP4-ATDxAnalysis
STEP5-ATDxSUA
Analysis
Source
Code
RulesR
T
Software
Repositories
AR
T
(S),Gr
T
(S)
Values
ATDxSUA
Analysis
NORM
T
(S)
Values
SUA
ATDD
T
(SUA),
ATDx
T
(SUA)
Values
Figure 1: Overview of the ATDx process.
which the calculation of ATDx can be based. Specifi-
cally, given an analysis tool T and its supported anal-
ysis rules R
T
, a manual inspection is carried out in
order to assess if the rules qualify as AR
T
according
to the criteria presented in Definition 1. This process
can be carried out either by inspecting the concrete
implementation of the rules R
T
under scrutiny, or by
consulting the documentation of T , if available.
3.2 Step 2: Formulation of 3-tuples
hAR
T
i
, ATDD
j
T
, Gr
T
i
i
After the identification of AR
T
, the 3-tuples hAR
i
,
ATDD
j
, Gr
i
i are established by mapping each AR
T
i
to (i) one or more architectural technical debt dimen-
sions AT DD
T
j
and (ii) its granularity level GR
T
i
.
The process of mapping an AR
T
i
to its correspond-
ing architectural dimensions ATDD
j
T
is conducted by
performing iterative content analysis sessions with
open coding (Lidwell et al., 2010) targeting the im-
plementation or documentation of the rule in order to
extract the semantic meaning of the rule. More in de-
tails, once the semantic meaning of each rule is well
understood, the AR
T
i
under scrutiny is labeled with
one or more keywords expressing schematically its
semantic meaning. Such analysis is carried out in an
iterative fashion, i.e., by continuously comparing the
potential ATDD
T
j
associated to the AR
T
i
under anal-
ysis with already identified dimensions, in order to
reach a uniform final AT DD
T
set.
Similarly, the process of mapping an architectural
rule AR
T
i
to its corresponding level of granularity Gr
T
i
is also carried out via manual analysis of the archi-
tectural rule, and subsequently identifying the unit of
analysis that the rule considers (e.g., function, class,
or file level).
5
5
In the fortunate instance in which the GR
T
i
mapped to
AR
T
i
is explicitly specified in the source from which the
rules R
T
are gathered, such information should be preferred
over a manual inspection of the rule.
3.3 Step 3: Building the AR
T
(SUA)
Dataset
After the identification of the AR
T
set (Step 1), it
is possible to build the dataset of AR
T
(S) measure-
ments. This process consists of (i) identifying an ini-
tial set of projects to be considered for inclusion in
the dataset, (ii) carrying out a quality filtering pro-
cess in order to ensure the soundness of the included
projects, and (iii) identifying the AR
T
(S) sets and ex-
tracting the |Gr
T
(S)| values of each project included
in the dataset. The selection of the initial dataset of
projects to be considered for inclusion is a design
choice specific to the concrete instance of ATDx. In
other words, such choice is dependent on the analy-
sis goal for which ATDx is adopted, the availability
of the software projects to be analyzed, and the tool
T adopted to calculate the AR
T
(S) sets. It is impor-
tant to bear in mind that, given the statistical nature
of ATDx, having a low number of projects in this step
would not lead to meaningful ATDx analysis results
(for more insights on this point see Section 4).
As for the selection of projects to be considered,
the step of carrying out a quality-filtering process on
the initial set of projects depends on the setting in
which ATDx is implemented. In case that ATDx is de-
ployed in an experimental setting, e.g., by considering
open-source software (OSS) projects, this step has to
be carried out in order to ensure that no toy software-
projects, such as demos or software examples writ-
ten for educational purposes, are included in the final
dataset of projects (Kalliamvakou et al., 2016).
After the identification of a final set of projects to
be considered for analysis, the AR
T
(S) sets are calcu-
lated for each system S in the dataset. The execution
of such process varies according to the adopted analy-
sis tool T . In addition to the AR
T
(S) calculation, dur-
ing this phase also the values |Gr
T
i
(S)|, calculated for
each considered Gr
T
i
, are extracted for each project S
in the dataset, as such values will also be needed to
carry out subsequent ATDx steps.
ENASE 2020 - 15th International Conference on Evaluation of Novel Approaches to Software Engineering
534

3.4 Step 4: ATDx Analysis
Once the AR
T
(S) and Gr
T
(S) sets are calculated for
the whole dataset of projects, the analysis presented
in Section 2 can be executed. Specifically, the ATDx
analysis takes as input AR
T
(S) and Gr
T
(S) sets for a
set of software projects, and outputs, for each project,
its ATDD
T
(S) and AT Dx
T
(S) values. It is worth
noticing that, after a first execution of the ATDx ap-
proach, it is possible to carry out further ATDx analy-
ses on additional projects by relying on the previously
formulated 3-tuples hAR
T
i
, ATDD
T
j
, Gr
T
i
i, and the pre-
calculated intermediate values of the ATDx analysis
NORM
T
i
, as further documented in Algorithm 1).
3.5 Step 5: Applying ATDx to a SUA
Finally, after the execution of ATDx on all projects in
the dataset, the resulting ATDD
T
and ATDx
T
values
of a specific SUA can be computed.
Algorithm 1: Computing AT DD
T
dimensions and
AT Dx
T
value for a single SUA.
Input: SUA, AR
T
, NORM
T
, ATDD
T
Output: ATDD
T
(SUA), ATDx
T
(SUA)
1 dimensions ← empty dictionary
2 atdx ← 0
3 for all dimensions j in ATDD
T
do
4 dimensions[j] ← 0
5 for all rules AR
T
i
in AR
T
do
6 violations ← |AR
T
i
(SUA)|
7 normalizedViolations ← NORM
T
i
(SUA)
8 if outlier(NORM
T
i
, normalizedViolations) then
9 dimensions[j] ← dimensions[j] + 1
10 for all entries j in dimensions do
11 dimensions[j] ← dimensions[j] / getNumRules(j)
12 atdx ← atdx + dimensions[j]
13 atdx ← atdx / |ATDD
T
|
14 return dimensions, adtx
As shown in Algorithm 1, the computation takes
as input 4 parameters: (i) the SUA, the set of
rules AR
T
, the values computed in the previous step
NORM
T
, and the set of dimensions ATDD
T
. The
output of the algorithm is the set of ATD values of
the SUA ATDD
T
(SUA) (one for each dimension) and
AT Dx
T
(SUA). The ATDD
T
values provide support
in gaining more insights in the severeness of the ATD
according to the identified ATD dimensions, while the
ATDx
T
value provides a unified overview of the rel-
ative ATD present in the SUA. After setting up the
initial variables for the output to be produced (lines 1-
2), the algorithm proceeds by building a dictionary
containing an entry for each dimension in ATDD
T
,
with the name of the dimension as key and 0 as value
(lines 3-4). Then, the algorithm iterates over each
rule in AR
T
(line 5) and collects the number of its
violations, both raw (line 6) and normalized by the
level of granularity of the current rule (line 7). If the
normalized number of violations is an outlier with re-
spect to the values collected for the whole dataset of
projects (line 8), then the entry of the dimensions
dictionary corresponding to the dimension of the cur-
rent rule is incremented (line 9). For each dimension
j we normalize its current value according to the to-
tal number of rules belonging to j in order to mitigate
the potential effect that the number of rules belonging
to the dimension may have, and increment the cur-
rent AT Dx
T
with the computed score (lines 10-12).
Finally, the AT Dx
T
value is normalized by the to-
tal number of dimensions supported by all AR
T
rules
(line 13) and both dimensions and ATDx values are
returned (line 14).
4 DISCUSSION
In order get further insights into the viability of ATDx,
we implemented a prototype of ATDx, built by consid-
ering a set of predefined SonarQube rules (Ernst et al.,
2017), and a large-scale dataset of over 6.7K software
projects. The raw data, analysis scripts, and results
of such investigation, accompanied by a companion
technical report, is made available online for further
consultation.
6
Following, the benefits and drawbacks
characterizing ATDx, and/or emerging from the pro-
totype implementation, are reported.
4.1 Approach Benefits
4.1.1 Tool Independence
ATDx is a tool-independent approach by design. This
allows its future adopters to tailor it according to the
specific development context considered, by basing
the ATDx calculation on the analysis tools which are
deemed more fitting. Specifically, the adoption of
ATDx, rather than imposing a technological constraint
its own tools and practices, is intended to leverage al-
ready deployed analysis tools, hence lowering the ef-
fort required for its adoption.
4.1.2 Language Independence
ATDx allows combining the results of different
language-specific analyses via the ATDx building
process discussed in Section 2.2. This enables its
adopters to aggregate analysis results into a sin-
gle comprehensive overview of the ATD present in
6
https://github.com/ATDindeX/ATDx
ATDx: Building an Architectural Technical Debt Index
535

a software-intensive system, encompassing architec-
tural components implemented in heterogeneous pro-
gramming languages.
4.1.3 Tool Composability
In our viability investigation we considered a single
analysis tool, namely SonarQube. Nevertheless, the
ATDx approach, thanks to its entailed abstraction and
normalization steps, allows to aggregate analysis re-
sults gathered via heterogeneous tools, e.g., static and
dynamic analyzers, in order to gain a simple, unified,
overview of the ATD present in a software system.
4.1.4 Multi-level Granularity Results
ATDx provides the means to inspect ATD issues at
various levels of granularity. At the highest level
of abstraction, the ATDx value, representing the to-
tal ATD present in a software-intensive system, en-
ables to swiftly gain knowledge of the ATD present
in a software system, and to compare its normalized
value with the ones of other projects. At a more re-
fined level of granularity lies the set of architectural
technical debt dimensions ATDD
T
. Such semantic
decomposition provides the possibility to intuitively
gain an overview of the ATD items of different na-
ture which are present in the considered system. The
ATDD
T
values enable adopters to effectively compare
the ATD status across different projects and to visual-
ize it, supporting the communication of related con-
cepts and a deeper understanding of the root causes
of ATD. Finally, at the finest level of granularity, the
derived data utilized to build the overview can be ana-
lyzed. This provides the lowest level of the ATDx cal-
culation, namely the normalized AR
T
outlier values,
in order to gain a deep, actionable, and data-driven
guidance on where the architectural debt is rooted.
This last level of granularity enables developers to
pinpoint the precise location of the source of ATD.
4.1.5 Exstensibility
After the implementation of an ATDx instance, it is
possible to add new rules to the existing AR
T
set by
re-executing Steps 1 to 4 of ATDx exclusively on the
newly added rules. This accounts for scenarios such
as the support of new rules added by tool vendors, or
the inclusion a posteriori of an an additional archi-
tectural rule. Additionally, it is possible to include
additional tools in the ATDx analysis by integrating
the new results with the ones obtained from already
adopted tools. This process is carried out by expand-
ing the previously identified ATDD
T
dimensions, and
possibly including new emerging ATD dimensions.
4.1.6 Data-driven
Instead of relying on predefined thresholds to iden-
tify outlier values of architectural rules, ATDx takes
advantage of normalization and statistical analysis of
data gathered from the analysis of a dataset of soft-
ware projects. Hence, ATDx is not prone to design
problems related to the definition of metric thresh-
olds, as it identifies severe architectural rule violations
based on the evaluation of empirical values collected
from a multitude of (possibly third-party) projects.
4.1.7 Lightweight Analysis for Additional SUA
Once an initial dataset of NORM
T
i
values is col-
lected, the evaluation of additional systems via ATDx
is straightforward. In fact, as a dataset of NORM
T
i
values is already available, the analysis can be car-
ried out exclusively on the new SUA, without the need
to re-execute the analysis for all projects belonging
to the dataset. Additionally, as ATDx is designed to
leverage tools already deployed in a specific indus-
trial setting, pre-computed data can be used as input
for ATDx, enabling to carry out the analysis by invest-
ing a negligible amount of effort.
4.1.8 Domain-specific Customization
As ATDx relies on the analysis of a dataset of soft-
ware projects, rather than considering a single one,
it is possible to tailor the approach by including in
the dataset exclusively software projects belonging to
a specific domain, e.g., safety-critical systems, mo-
bile applications. In fact, ATDx analysis results may
vary according to the application domain considered.
Hence, to get more refined and accurate results, a
curated dataset of software projects belonging to the
same domain can be considered, enabling to fine-tune
the detection of severe rule violations according to the
specific domain considered.
4.2 Approach Drawbacks
4.2.1 Dataset Dependence
Naturally, the ATDx approach is dependent, by def-
inition, on a dataset of software projects. Hence,
while numerous ATD analysis approaches require ex-
clusively the SUA (Verdecchia et al., 2018), our ap-
proach needs instead various software systems in or-
der to detect outlier values. This implies that the
ATDx results of a SUA are only “relative” to the other
projects considered, and are not representing an uni-
versal result. Additionally, to provide accurate ATDx
analysis results, it is necessary to ensure the quality
ENASE 2020 - 15th International Conference on Evaluation of Novel Approaches to Software Engineering
536

of the utilized dataset. In order to mitigate this latter
drawback, a quality filtering process on a preliminary
dataset of software projects should be executed (see
also Section 3.3). Regarding the scale of the dataset,
we plan to carry out quantitative and qualitative ex-
periments by considering different domains in order
to identify the minimum number of projects required
to achieve saturation of results (i.e., when the inclu-
sion of additional projects does not lead to statistically
significant changes of results).
4.2.2 ATDx Implementation Validation
In order to verify the correctness of an implemented
instance of ATDx, it is necessary to evaluate and even-
tually tune it in a real development context. This pro-
cess entails (i) the selection of a set of software sys-
tems, (ii) their analysis via ATDx, and (iii) the in-
spection of the analysis results by means of focus-
groups with the developers who implemented the se-
lected software projects. As the focus of our study
is defining a generic approach through which specific
instantiations of ATDx can be implemented, this pro-
cess was deemed as out of scope for the ATDx proto-
type implementation carried out for this study.
4.2.3 Emphasis of Outlier Values
The design of ATDx relies on the identification of
outlier normalized values of AR
T
violations (i.e., val-
ues within the upper inner fence and the upper outer
fence). Hence, the emphasis of ATDx is on se-
vere ATD issues present in software-intensive sys-
tems. While in our ATDx viability investigation we
observed numerous projects characterized by outlier
values (4179/6706), such process could be deemed as
“lossy” if a more fine-grained analysis is expected. To
mitigate this potential drawback, it is possible to mod-
ify the approach by considering more inclusive strate-
gies, e.g., by considering as “outliers” the values be-
tween the third quartile and the upper outer fence, or
even mapping a discrete value according to the quar-
tile associated to an AR(S) value.
4.2.4 Balance of AR Number Mapped to ATDD
As the different ATDD values constituting ATDx are
computed by considering distinct sets of ARs, it is
necessary that the number of rules across the differ-
ent sets is balanced. In fact, if the distinct sets exhibit
notable differences in cardinality, the weight of under-
represented sets could lead to an unfair representation
of an ATDD. This drawback has to be considered and
mitigated while designing an ATDx instance, by care-
fully selecting ARs, considering their recurrence, rel-
evance, and the cardinality of the mapped AT DDs.
4.2.5 Potential Empirically Unreachable ATDD
Maximum Values
Reaching a maximum value in a certain dimension
ATDD
T
i
is by definition theoretically possible, but em-
pirically extremely improbable. By design, a sys-
tem S reaches the maximum in one dimension if and
only if it possesses outlier values in all ARs com-
posing ATDD
T
i
. If S possesses a maximum value of
ATDD
T
i
, this would indicate that S is characterized
by exceptionally severe and recurrent issues in that
dimension. In our viability investigation with Sonar-
Qube such project was not present for all dimensions.
A possible heuristic to solve this potential drawback
would be to rescale the values of a dimension i to the
[0, max
i
] range, where max
i
is the maximum value in
the dimension i across all rules in AR
T
mapped to i.
Nevertheless, we refrained from such solution for the
sake of clarity.
5 RELATED WORK
Numerous software analysis approaches have been
proposed to detect ATD in software-intensive sys-
tems. Among the most prominent and current ones,
the approach of Arcelli Fontana et al. (Arcelli Fontana
et al., 2016; Martini et al., 2018a), (Roveda et al.,
2018) focuses on the identification of ATD by ana-
lyzing dependency architectural smells, which could
lead to the emergence of an additional ATDD dimen-
sion, namely “Dependency”. Similarly, Kazman et
al. (Kazman et al., 2015; Xiao et al., 2016) (Cai
and Kazman, 2017), analyzed ATD by inspecting an-
tipatterns of semantically related architectural com-
ponents, e.g., via the analysis of bug-prone compo-
nents. In (Roveda et al., 2018), another ATD index
is presented. Differently from our ATDx, this con-
centrates entirely on architectural smells, notably re-
lated to dependency violations. Finally, Le et al. (Le
et al., 2018) reported on an empirical investigation of
architectural decay via the analysis of 8 architectural
smells of different nature. Interestingly, in a similar
fashion to ATDx, the smell violations are evaluated by
adopting interquartile analysis (Tukey, 1977). Never-
theless, such analysis is carried out at an intra archi-
tectural rule level, and, in contrast to ATDx, values are
not normalized per system-size. More ATD identifi-
cation approaches are reported in a secondary study of
Verdecchia et al. (Verdecchia et al., 2018). Regarding
the identification of metrics thresholds, similarly to
ATDx: Building an Architectural Technical Debt Index
537

ATDx, in (Alves et al., 2010) an interquartile strategy
is adopted to identify the severeness of metric values.
Differently, this study does not focus on ATD and,
while adopting a system-size normalization strategy,
it takes only one level of granularity (NCLOC). In a
recent work, Ulan et al. (Ulan et al., 2019) proposed
a software metric aggregation approach based on dis-
tribution. Our approach is different by (i) focusing
specifically on outlier architectural rule violations, (ii)
considering sizes according to distinct granularities,
and (iii) clustering results into semantic dimensions.
6 CONCLUSIONS
In this study we presented ATDx, an approach de-
signed to gain an encompassing overview of the
source-code detectable ATD present in a software-
intensive system. The ATDx approach concisely en-
tails (i) the manual inspection of pre-existing source-
code rules, (ii) the identification of outlier normalized
values via statistical analysis, and (iii) the aggregation
of analysis results into a set of ATD dimensions. As
future work, we plan to address the identified draw-
backs by refining our theoretical framework of ATDx.
Additionally, we would like to enhance the current ap-
proach by including the temporal factor into our anal-
ysis. Subsequently, we plan to implement a concrete
instance of ATDx, and validate it by conducting a
large-scale study involving industrial partners in or-
der to assess (i) the usefulness and actionability of the
proposed index, (ii) its sensibility w.r.t. different anal-
ysis tools, and its (iii) performance when dealing with
larger datasets. As stated in (Nord et al., 2012), ATD
is a complex, heterogeneous, and multifaceted prob-
lem. Our approach contributes to advance the field
towards establishing a holistic, encompassing, view
of the ATD present in a software-intensive system.
ACKNOWLEDGMENTS
This material is partially based upon work funded and
supported by the Department of Defense under Con-
tract No. FA8702-15-D-0002 with Carnegie Mellon
University for the operation of the Software Engineer-
ing Institute, a federally funded research and develop-
ment center. DM20-0240.
REFERENCES
Alves, T. L., Ypma, C., and Visser, J. (2010). Deriving met-
ric thresholds from benchmark data. In 2010 IEEE
International Conference on Software Maintenance,
pages 1–10. IEEE.
Arcelli Fontana, F., Pigazzini, I., Roveda, R., Tamburri, D.,
Zanoni, M., and Di Nitto, E. (2017). Arcan: A tool for
architectural smells detection. In IEEE International
Conference on Software Architecture Workshops (IC-
SAW), pages 282–285. IEEE.
Arcelli Fontana, F., Roveda, R., and Zanoni, M. (2016).
Tool support for evaluating architectural debt of an ex-
isting system: An experience report. In Annual ACM
Symposium on Applied Computing, pages 1347–1349.
Avgeriou, P., Kruchten, P., Ozkaya, I., and Seaman, C.
(2016). Managing Technical Debt in Software Engi-
neering (Dagstuhl Seminar 16162). In Dagstuhl Re-
ports, volume 6. Schloss Dagstuhl-Leibniz-Zentrum
fuer Informatik.
Cai, Y. and Kazman, R. (2017). Detecting and quantify-
ing architectural debt: theory and practice. In 2017
IEEE/ACM 39th International Conference on Soft-
ware Engineering Companion, pages 503–504. IEEE.
Ernst, N. A., Bellomo, S., Ozkaya, I., and Nord, R. L.
(2017). What to fix? distinguishing between de-
sign and non-design rules in automated tools. In
IEEE International Conference on Software Architec-
ture (ICSA), pages 165–168.
Frigge, M., Hoaglin, D. C., and Iglewicz, B. (1989). Some
implementations of the boxplot. The American Statis-
tician, 43(1):50–54.
Kalliamvakou, E., Gousios, G., Blincoe, K., Singer, L., Ger-
man, D. M., and Damian, D. (2016). An In-depth
Study of the Promises and Perils of Mining GitHub.
Empirical Software Engineering, 21(5):2035–2071.
Kazman, R., Cai, Y., Mo, R., Feng, Q., Xiao, L., Haziyev,
S., Fedak, V., and Shapochka, A. (2015). A case study
in locating the architectural roots of technical debt. In
2015 IEEE/ACM 37th IEEE International Conference
on Software Engineering, volume 2, pages 179–188.
IEEE.
Kruchten, P., Nord, R. L., and Ozkaya, I. (2012). Technical
debt: From metaphor to theory and practice. IEEE
Software, 29(6):18–21.
Le, D. M., Link, D., Shahbazian, A., and Medvidovic, N.
(2018). An empirical study of architectural decay in
open-source software. In IEEE International Confer-
ence on Software Architecture (ICSA), pages 176–185.
Li, Z., Avgeriou, P., and Liang, P. (2015a). A systematic
mapping study on technical debt and its management.
Journal of Systems and Software, 101:193–220.
Li, Z., Liang, P., and Avgeriou, P. (2015b). Architectural
technical debt identification based on architecture de-
cisions and change scenarios. In Working IEEE/IFIP
Conference on Software Architecture, pages 65–74.
Lidwell, W., Holden, K., and Butler, J. (2010). Universal
Principles of Design. Rockport Pub.
Malavolta, I., Verdecchia, R., Filipovic, B., Bruntink, M.,
and Lago, P. (2018). How maintainability issues of
android apps evolve. In 2018 IEEE International Con-
ference on Software Maintenance and Evolution (IC-
SME), pages 334–344. IEEE.
Martini, A., Fontana, F. A., Biaggi, A., and Roveda, R.
(2018a). Identifying and prioritizing architectural debt
ENASE 2020 - 15th International Conference on Evaluation of Novel Approaches to Software Engineering
538

through architectural smells: a case study in a large
software company. In European Conference on Soft-
ware Architecture, pages 320–335. Springer.
Martini, A., Sikander, E., and Madlani, N. (2018b). A
semi-automated framework for the identification and
estimation of architectural technical debt: A compar-
ative case-study on the modularization of a software
component. Information and Software Technology,
93:264–279.
Nord, R. L., Ozkaya, I., Kruchten, P., and Gonzalez-Rojas,
M. (2012). In search of a metric for managing archi-
tectural technical debt. In Joint Working IEEE/IFIP
Conference on Software Architecture and European
Conference on Software Architecture, pages 91–100.
Roveda, R., Arcelli Fontana, F., Pigazzini, I., and Zanoni,
M. (2018). Towards an architectural debt index. In
44th Euromicro Conference on Software Engineering
and Advanced Applications (SEAA), pages 408–416.
IEEE.
Tukey, J. W. (1977). Exploratory Data Analysis. Reading,
Addision-Wesley, 688.
Ulan, M., L
¨
owe, W., Ericsson, M., and Wingkvist, A.
(2019). Towards meaningful software metrics ag-
gregation. In Proceedings of the 18th Belgium-
Netherlands Software Evolution Workshop.
Verdecchia, R., Malavolta, I., and Lago, P. (2018). Ar-
chitectural technical debt identification: The research
landscape. In IEEE/ACM International Conference on
Technical Debt (TechDebt), pages 11–20.
Xiao, L., Cai, Y., Kazman, R., Mo, R., and Feng, Q. (2016).
Identifying and quantifying architectural debt. In Pro-
ceedings of the 38th International Conference on Soft-
ware Engineering, pages 488–498. ACM.
ATDx: Building an Architectural Technical Debt Index
539
