
Introduction to DiNA: An Extendable Web-application for
Directed Network Analysis
M
´
at
´
e Csongor Sz
´
ell, Mikl
´
os Becsei and Gergely Kocsis
a
University of Debrecen, Faculty of Informatics, Department of Informatics Systems and Network, Kassai Str. 26,
Debrecen, Hungary
Keywords:
Directed Graph, Network Topology, Web Interface.
Abstract:
A new web-application is presented that can be used to easily express basic properties of directed graphs and
run some rather complex algorithms on them. The application builds up from two distinct parts. i.) It contains
a core package written in plain Java representing the graph and implementing the algorithms and ii.) it has
a web user interface with which it become easy to call methods of the core package. Both the core package
and the web-interface were developed in a modular way making it easy to add new algorithms or even to run
pre-implemented algorithms of already well-known graph analyzer tools. At the current state of the work we
are implementing new algorithms and extending the features of the web user interface. The application is
available at http://dina.inf.unideb.hu/.
1 INTRODUCTION
Since the wide-spread application of network science
in several multidisciplinary areas lots of tools have
been introduced to make graph analysis more easy
and efficient (Kuchaiev et al., 2011; Jokar et al., 2016;
F. Briatte et al., 2020). However there still are groups
of scientists finding it more comfortable, faster or
even more efficient to implement an algorithm from
scratch in a well known old language (like C++, Java
or FORTRAN) than to get used to a new tool. And in
some cases this decision does prove to be a good one
(Teng, 2016).
In the presented project we aim to develop an ap-
plication with a web-based user interface that beside
providing out-of-the box solution for some easy graph
statistics and algorithms, makes it possible for scien-
tists to add and run implementations already existing
in other graph analysis tools or even their own graph
analyzer or processor codes.
Naturally it is not a goal of ours to compete with
professional tools like Gephi (Bastian et al., 2009),
NetworkX (NetworkX developers, 2019) or Wolfram-
alpha (Wolfram Alpha LLC, 2020) in number of algo-
rithms or in efficiency (even though we are keeping on
adding new features and refactoring the already im-
plemented ones). We would like to provide an easy-
a
https://orcid.org/0000-0003-0018-4201
to-use extendable tool for graph analysis for online
and offline use. Also our solution will not provide any
mean of network visualization (at least in its current
state). Since we barely provide any own written algo-
rithms in our application there is no use of any com-
parison to other platforms running exactly the same
implementations.
2 THE APPLICATION
Our application builds up from two distinct parts. We
have implemented a core package in Java that can
store and process directed graphs by running sim-
ple statistics, and some rather complex algorithms on
them like finding the giant strongly connected compo-
nent (Nuutila, 1994; Sharir, 1981) or the tendrils and
tubes of different layers of the graph (Tim
´
ar et al.,
2017). Section 2.1 introduces this core part of the ap-
plication. The strength of this package is the architec-
ture of it, that makes it really easy to be extended by
implementations of new algorithms. In section 2.1.1
we present the structure of this core package while in
section 2.1.2 we even show how a new algorithm can
be added to it.
The other part of the application is the web user
interface that is on the one hand able to dynamically
update the list of available algorithms after the exten-
sion of the core, while we also plan to add the pos-
Széll, M., Becsei, M. and Kocsis, G.
Introduction to DiNA: An Extendable Web-application for Directed Network Analysis.
DOI: 10.5220/0009577701290135
In Proceedings of the 5th International Conference on Complexity, Future Information Systems and Risk (COMPLEXIS 2020), pages 129-135
ISBN: 978-989-758-427-5
Copyright
c
2020 by SCITEPRESS – Science and Technology Publications, Lda. All rights reserved
129
sibility for users to add their own implementations or
to include already existing algorithms implemented in
well-known tools. This interface is presented in sec-
tion 2.2 including the applied technologies (see sub-
section 2.2.1) and the way how the interface is up-
dated after adding a new algorithm to the core (see
subsection 2.2.2). Subsection 2.3 shows the actually
available features of the application.
2.1 The Core Java Package
As mentioned above the core of the application is cur-
rently a package written in Java providing the possi-
bility of reading in and processing graphs. One of our
aims is however to make it possible in the future to
use our application with different other cores as well.
So we designed this core in a way that makes it easily
replaceable.
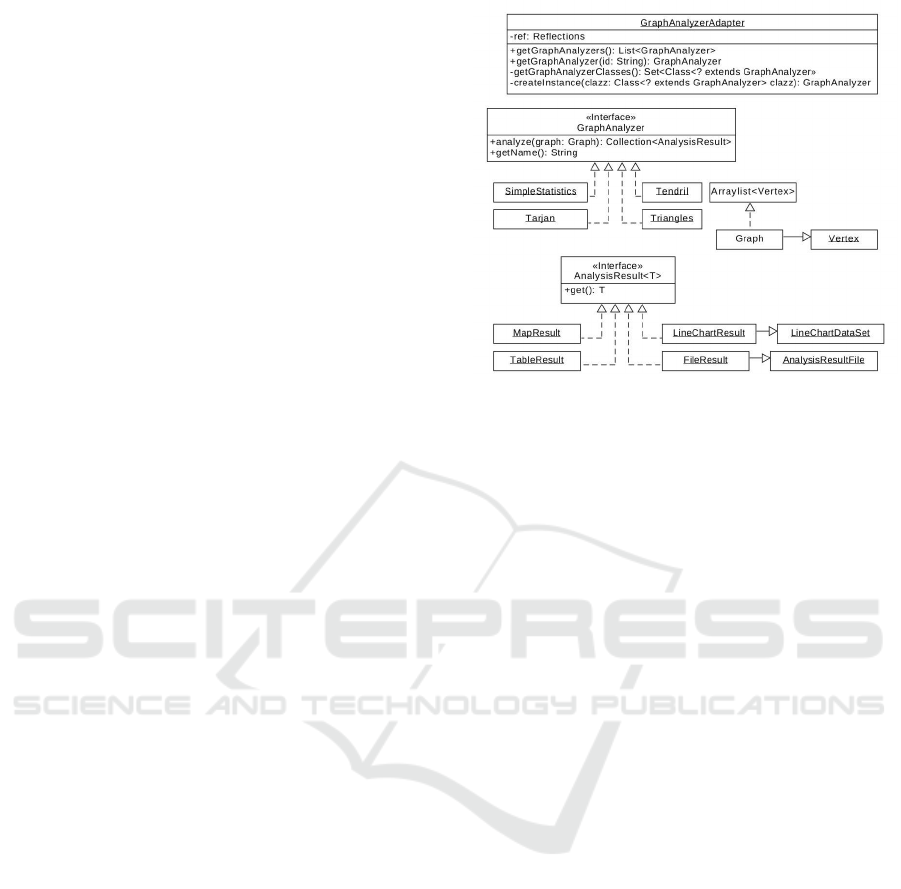
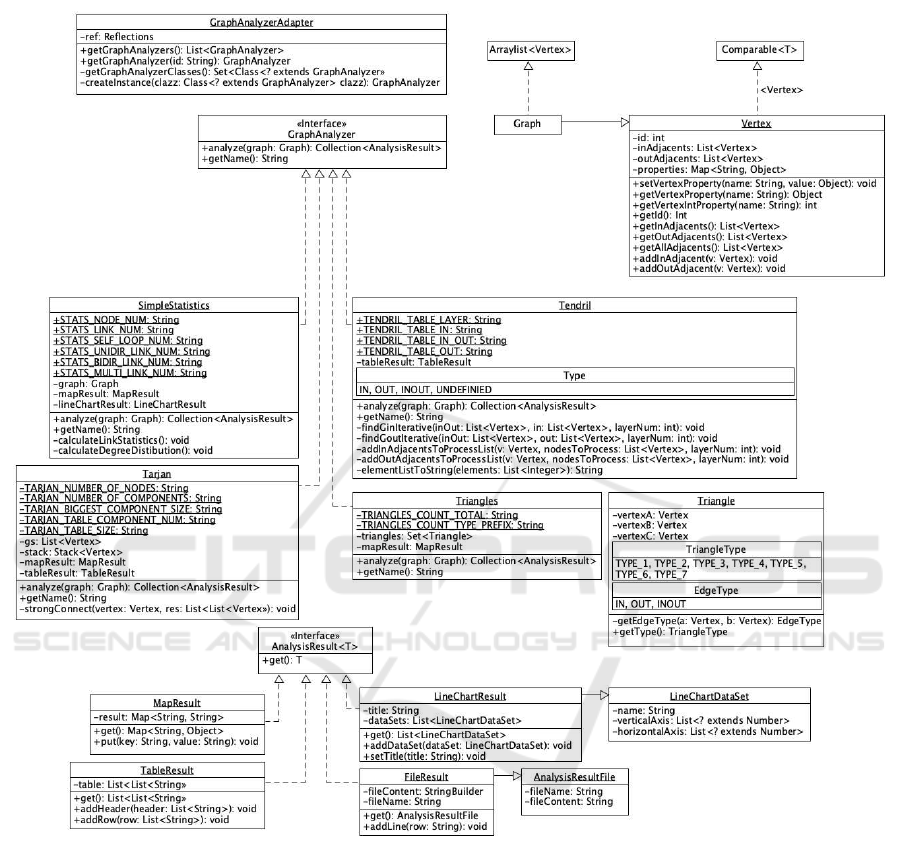
2.1.1 The Structure of the Core Application
The basic structure of the core Java application is
presented on Figure 1. A graph is represented by
an ArrayList of Vertex objects. Such a Graph
has to be the input of the algorithms implementing
the GraphAnalyzer interface, which has two func-
tions. Each graph parsing algorithm has a user-
friendly name that can be queried with the getName
function. This is the name that will appear in the
user interface. The graph analysis itself is performed
by the analyze method, which returns a collection
of AnalysisResult-type elements, allowing an algo-
rithm to produce multiple types of results (e.g. a list
of key-value pairs and a line graph).
The AnalysisResult interface of the DiNA
package allows the graph parsing algorithm to pro-
duce different types of results. The generic interface
has a single get function that returns a generic object
containing the result. There are currently 4 different
result types in the package, which have been designed
based on the format of the results generated by the
existing algorithms and the emerging user needs. Ac-
cordingly, an analysis algorithm can produce the fol-
lowing types of results:
• MapResult can store simple key-value pairs
where both key and value are of string type. This
result type is to be used when for example a group
of different numerical properties of the graph is to
be returned. For each property a key-value pair
can be given, where the key is the name and the
value may be a number.
• TableResult performs a table-like operation, so
one can specify a header in the form of a list of
strings, or one can add rows to the table, also as
Figure 1: The UML class diagram of the core Java pack-
age. A more detailed diagram is available in the Appendix
(Figure 5).
a list of strings. This may be useful for exam-
ple when the result builds up from sets of nodes.
More than one value can be put into one cell.
• LineChartResult stores the results in the form
needed to draw a line chart. Additionally it is pos-
sible to map elements of multiple data sets to a
line chart. To represent the data sets, we created
a LineChartDataSet class that stores the values
displayed on the vertical and horizontal axes as a
list of numbers. We used this format for example
for the degree distributions.
• FileResult returns the result in the desired
file format for the algorithm. This format is a
semicolon-separated CSV format for existing al-
gorithms. However it can be customized for a new
algorithm because FileResult builds the final
file from the rows in the file, and the internal struc-
ture of the rows depends only on the developer
implementing the algorithm. Naturally, it is also
possible to set the file name as a string. We cre-
ated a custom class called AnalysisResultFile
to describe the file name and its contents, which
handles both the name and the content as strings.
The package also contains an interface named
GraphAnalyzerAdapter whose role is to make it
easy for external applications to get all the imple-
mented algorithms of the package. The implemen-
tation of this feature uses ronmamo Reflections
package. This class was used for the implemen-
tation of the web user interface of the applica-
tion. If one would like to create another inter-
face for the core application this class is to be
used to connect the core and the interface. The
getGraphAnalyzers() method returns all the an-
COMPLEXIS 2020 - 5th International Conference on Complexity, Future Information Systems and Risk
130
alyzers that are to be presented on the new user
interface. The getGraphAnalyzer(id: String)
method returns a given analyzer so that it can be
called using its id.
2.1.2 Example of Extending the Core with a
New Algorithm
As a result of the above presented structure of the
core package adding a new graph analyzing algo-
rithm does not require any changes of the code of
the user interface or of the adapter class. The algo-
rithm will be represented by a class that implements
the GraphAnalyzer interface. In the class, one can
freely define either private or public methods to
help structure the algorithm code. The algorithm pro-
duces the result as the return value of the analyze
method, which is a collection of the above mentioned
result types. This allows an algorithm to produce mul-
tiple results, even in different formats. A typical ex-
ample is when an algorithm produces a given result
for being processed directly by the interface and also
a FileResult that can be saved by the user for later
use.
In order to present how exactly a new algorithm
can be added to the package let’s see how we have
added the algorithm counting different types of trian-
gles in the graph. A triangle means a triad of nodes
where there is a link between each two nodes. Taking
into account the direction of edges there are 7 differ-
ent possible types of triangle in directed graphs (see
(Roughgarden, 2014; Suri and Vassilvitskii, 2011)).
Our implementation counts the number of triangles of
all these types. The first step is to create a new class
in the algorithms package (this will be the Triangles
class in this case) that extends the GraphAnalyzer
interface. This results in a class that must contain an
analyze function with the Collection return value
containing elements of type AnalysisResult, and a
getName function that can be implemented by return-
ing the desired name in the form of a string (in this
case it will be Triangles as well).
The next step is to decide what type of result or
results we want to produce. In this case we chose one
MapResult and one FileResult. This is because we
want to display the number of different types of trian-
gles in the form of a key-value pairs and in addition,
we want to make the analysis results available in a
savable format.
To implement the algorithm, we needed a
Triangle model class to represent a triad of nodes.
This model can tell us the type of relationship be-
tween the three nodes it contains. The implementa-
tion of the equals method allows two triangle models
to be considered the same, regardless of the order of
the nodes. (Note that one possible type of triangle can
appear in several forms as a result of reflection and/or
rotation). Utilizing this, our algorithm generates all
the triangles in the graph that are stored in a set. Due
to the proper equals method, a triangle is discovered
only once.
By iterating through the various triangle types, we
filter out and count the number of triangles found cor-
responding to each type. These results are then added
to a MapResult and to a FileResult in the appro-
priate format. Finally, we place the two results into a
list, which is returned by the analyze method.
It is important to note that we are currently work-
ing on extending the application with new algorithms
using the above procedure. Beside adding our own
implementations we have good experiences while try-
ing to include third party algorithms as well. Namely
we have added successfully the implementation of the
Tarjan algorithm by JGrapht to the core package and
made it visible on the web-interface as well.
2.2 The Web User Interface
Although the core Java package is implemented in a
way that makes it easy to run the algorithms as a part
of a Java program, calling these algorithms from a
user friendly interface is of course much more com-
fortable. So we have developed a web user interface
to the application fulfilling the natural requirement of
users.
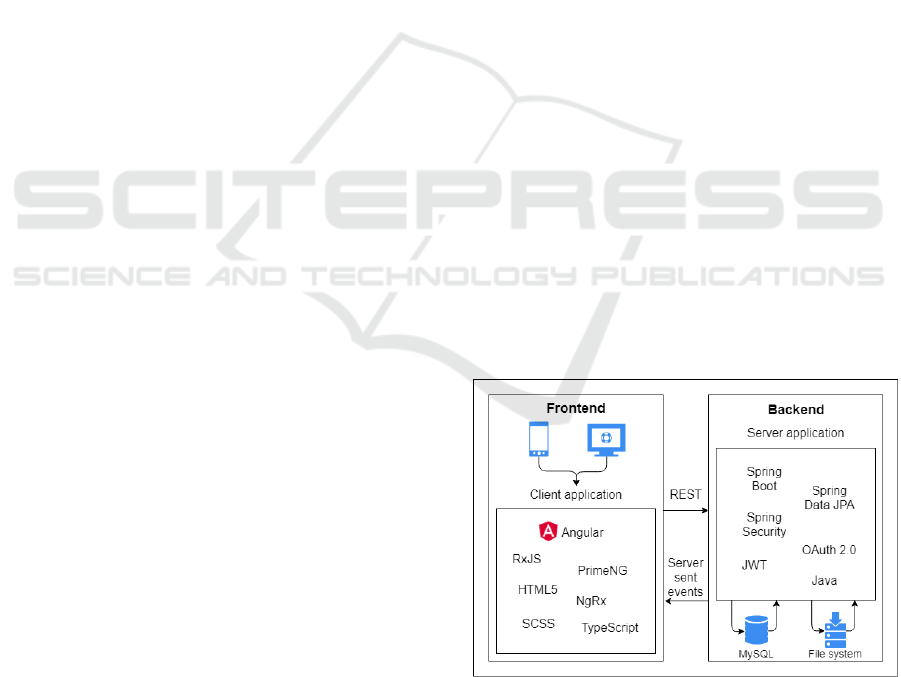
2.2.1 Technologies and Frameworks of the Web
User Interface
Figure 2: The architecture of the web user interface. We
follow client-server architecture using the technologies pre-
sented on the figure. The Java core package is added to the
server side so the algorithms run there.
The web-application is implemented according to
client-server architecture. The server role is provided
Introduction to DiNA: An Extendable Web-application for Directed Network Analysis
131
by a Spring Boot
1
application written in Java, which
the client communicates with via REST
2
endpoints.
This solution also provides the ability for any client
capable of using the REST API to send requests to
the server so that the entire client can be easily re-
placed by another one. This provides again a new
level of modularity for our application. The secure
connection between the client and the server is pro-
vided through the OAuth 2.0 protocol
3
using a JWT
authorization token, which is handled by the Spring
Framework Security module. The MySQL relational
database manager is used to store the data needed for
the application and generated during its use. Database
operations are initiated through interfaces provided by
Spring Data JPA
4
.
The structure of the web-application and the cho-
sen technologies are presented on Figure 2. Note that
for the communication beside the REST API, Server
Sent Events are also used making it possible to run
asynchronous communication in required cases. The
Java core package is added to the server side thus the
algorithms run on the server.
The client-side application was built on the Angu-
lar
5
web platform. To create the user interface, we
decided to use an open source component library, Pri-
meNG
6
, to make development faster and more effi-
cient, and to make the user interface more consistent
and clean. The higher level native components im-
plementing the application are implemented in Type-
Script
7
language. The interface structure is imple-
mented in HTML. The appearance is provided by
SCSS style sheets. For client state management, we
used the NgRx
8
library specifically for Angular
9
.
2.2.2 Updating the Interface After the Addition
of New Algorithm Implementations
After adding a new algorithm to the core Java pack-
age the web user interface also needs to be rebuilt and
restarted in order to make the changes visible on it.
This can be done in four easy steps: i.) Rebuild the
core Java package. ii.) Add the resulting jar file to the
1
https://en.wikipedia.org/wiki/Spring Framework\
#Spring Boot
2
https://restfulapi.net/
3
https://medium.com/@technospace/
an-introduction-to-oauth-2-0-4c71b5fb19ff
4
https://spring.io/projects/spring-data-jpa
5
https://angular.io/docs
6
https://www.primefaces.org/primeng
7
https://www.tutorialspoint.com/typescript/
typescript
overview.htm
8
https://ngrx.io/docs
9
https://angular.io/guide/rx-library
All links above last visited: 01.15.2020.
server source and rebuild the server. iii.) Upload the
new server file to its location. iv.) Stop the previous
server and start the new one. As a result the new algo-
rithm appears in the list of possible ones and the user
interface is automatically generated for its results.
2.3 Current Features of the Application
In its current state the application provides the follow-
ing functionalities:
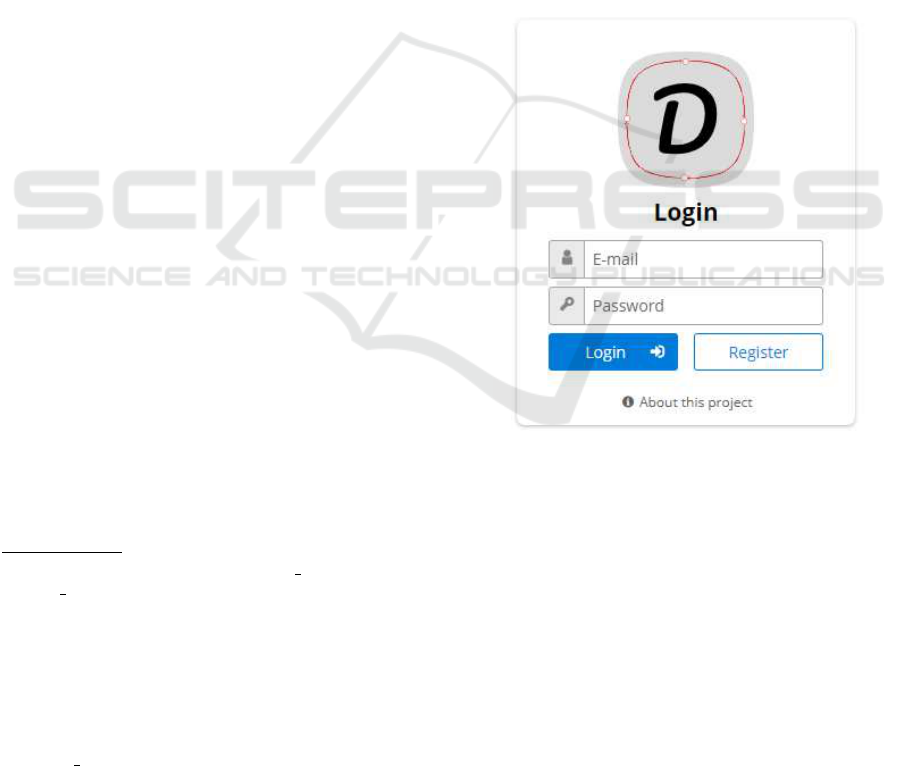
• Authentication and Authorization: Users of the
web interface can register and later log in by an
e-mail address and password pair. The address is
not verified by e-mail but CAPTCHA verification
is used during the registration. With a registered
account the user can instantly log in to the appli-
cation. Without logging in, the rest of the pages of
the application cannot be reached (see Figure 3).
Figure 3: The login window of the application. For logging
in only an e-mail address and a password is needed to be re-
gitsred, a CAPTCHA is to be passed. The link at the bottom
contains information about the application.
• Upload files containing graphs: After logging in
users can upload their graph files. These files are
stored on our server in order to make it possible
to run multiple algorithms without the need of up-
loading them again. The uploaded file has to con-
tain the number of nodes in the first line and the
ends of edges separated by spaces from the second
line (see example formats on Figure 4). The ap-
plication also supports other simple input formats
(like only edges in the list in a file without node
or edge number) and the gml file format (Himsolt,
2000) is planned to be added as well as a possible
input format.
COMPLEXIS 2020 - 5th International Conference on Complexity, Future Information Systems and Risk
132
sample 1: 5 sample 2: 1,3
1 3 3,1
3 1 3,3
3 3 4,1
4 1 4,1
4 1 4,4
4 4 4,5
4 5 5,5
5 5
Figure 4: Sample input formats accepted by the application.
In sample 1 the first line is the number of nodes and the
following lines directed edges by their ends. Sample 2 does
not predefine the number of nodes so only mentioned nodes
will be present in the graph. As a result in this case the node
with id 2 will be missing from the second graph. Allowed
delimiters are ”<space>” ”,” and ”;”.
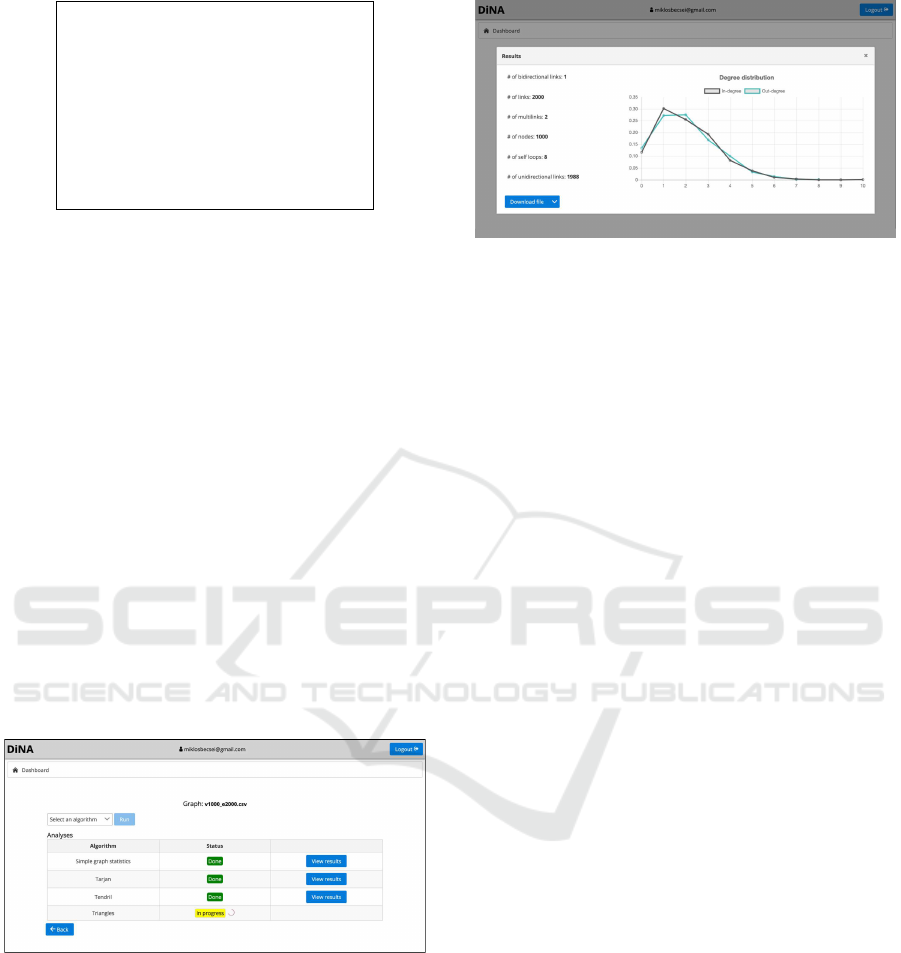
• Run graph analyzer algorithms and persistently
store the results: Using a drop-down list users
can run analyzer algorithms. Their description ap-
pears in a help window after clicking on the ap-
pearing help icon. Since some of the runs may
take a long time, they can be started in the back-
ground and even if the user leaves the site they
keep on running. When the user returns and logs
in again, the status of the run will be ”done” or ”in
progress” depending on the state of it (see Figure
5). As another result of this solution more than
one algorithms can run at the same time. Note
however that each algorithm can run only once
on the same graph. While the results of them are
stored.
Figure 5: Snapshot of the application. Three analysis algo-
rithms are finished while one is still running. The possible
algorithms can be selected from a drop-down list including
only those that are not run yet. The description of the se-
lected algorithm can be seen after selecting it, when a help
icon appears.
• Download analysis results: For those algorithms
whose implementation provide FileResult out-
put in the core Java package automatically a
download button appears (see Figure 6), with
which the results can be downloaded to the local
computer. The format of this file is specified by
Figure 6: The result of running simple graph statistics on a
sample graph. Beside that the results are instantly presented
on the screen, it is also possible to download the data as a
CSV formatted file.
the actual implementation of the algorithm. The
resulted file keeps available on the server till the
user deletes it.
• Deleting uploaded graphs and analysis results:
We made it possible to delete all data of users in-
cluding all graphs and algorithm results from the
server.
• User management: There is an administrator ac-
count for the application that can delete modify
and create user accounts. However of course even
administrator users cannot read other users’ pass-
words.
3 DISCUSSION
We presented a new web-application that can be used
to easily express basic properties of directed graphs
and run some rather complex algorithms on them.
The application contains i.) a core package written in
plain Java implementing the algorithms, and it has ii.)
a web user interface with which it become easy to call
methods of the core package. We showed how both
the core Java package and the web user interface can
be extended by adding implementations of new algo-
rithms without affecting the structure of them. As it
was shown our application does not want to compete
already existing other solutions but the aim is to pro-
vide a platform which through it may be a bit more
easy to use them. While in the other hand we not just
provide this empty skeleton, we try to include as much
strating algorithms as possible in order not to have to
start from the beginning when a new user tries to use
them.
Currently and in our future plans we are extend-
ing the interface and the core package to make it able
to run algorithm implementations of other already ex-
isting tools. We have good experiences with JGrapht
Introduction to DiNA: An Extendable Web-application for Directed Network Analysis
133

already. We are also working on the addition of extra
algorithms which are not implemented by other anal-
ysis tools. Also we are refactoring our already imple-
mented algorithms to make them more efficient. The
application is available at http://dina.inf.unideb.hu/.
ACKNOWLEDGEMENTS
Mikl
´
os Becsei was supported by the construction
EFOP-3.6.3-VEKOP-16-2017-00002. The project
was supported by the European Union, co-financed
by the European Social Fund.
M
´
at
´
e Csongor Sz
´
ell and Gergely Kocsis are sup-
ported by the EFOP-3.6.1-16-2016-00022 project.
The project is co-financed by the European Union and
the European Social Fund.
REFERENCES
Bastian, M., Heymann, S., and Jacomy, M. (2009). Gephi:
an open source software for exploring and manipulat-
ing networks. In International AAAI Conference on
Weblogs and Social Media.
F. Briatte et al. (2020). Awesome network analysis. https:
//github.com/briatte/awesome-network-analysis/ (l.v.:
01.15.2020).
Himsolt, M. (2000). Graphlet: design andimplementation
of a grapheditor. Software – Practice and Experience,
30. pp. 1303-1324.
Jokar, N., Honarvar, A. R., Esfandiari, K., and
Aghamirzadeh, S. (2016). The review of social net-
works analysis tools. Bulletin de la Soci
´
et
´
e Royale
des Sciences de Li
`
ege, 85. pp. 329-339.
Kuchaiev, O., Stevanovi, A., Hayes, W., and Prulj, N.
(2011). Graphcrunch 2: Software tool for network
modeling, alignment and clustering. BMC bioinfor-
matics, 12/24.
NetworkX developers (2014-2019). Official site of net-
workx. https://networkx.github.io/ (l.v.: 01.15.2020).
Nuutila, E. (1994). On finding the strongly connected com-
ponents in a directed graph. Information Processing
Letters, 49/1. pp. 9-14.
Roughgarden, T. (2014). Reading in algorithms counting
triangles. CS167: Readings in Algorithms class mate-
rial. https://cs.stanford.edu/
∼
rishig/courses/s16.html
(l.v.: 20.01.2020).
Sharir, M. (1981). A strong-connectivity algorithm and its
applications to data flow analysis. Computers and
Mathematics with Applications, 7/1. pp. 67–72.
Suri, S. and Vassilvitskii, S. (2011). Counting triangles and
the curse of the last reducer. pp. 607-614.
Teng, S.-H. (2016). Scalable Algorithms for Data and Net-
work Analysis. now Publishers Inc, Boston–Delft.
Tim
´
ar, G., Goltsev, A. V., Dorogovtsev, S. N., and Mendes,
J. F. F. (2017). Mapping the structure of directed net-
works: Beyond the bow-tie diagram. Physical Review
Letters, 118. (078301).
Wolfram Alpha LLC (2020). Official site of wolfram aplha.
https://www.wolframalpha.com/ (l.v.: 01.15.2020).
COMPLEXIS 2020 - 5th International Conference on Complexity, Future Information Systems and Risk
134
APPENDIX
Figure 7: The detailed UML class diagram of the core Java application. Note how the interfaces make it easy to extend this
package by increasing abstration.
Introduction to DiNA: An Extendable Web-application for Directed Network Analysis
135
