
Urban Consumption Patterns: OpenStreetMap Quality for Social
Science Research
Hamidreza Rabiei-Dastjerdi
1a
1
, Gavin McArdle
1b
2
and Andrea Ballatore
2c
3
1
School of Computer Science and CeADAR, University College Dublin, Belfield, Dublin, Ireland
2
Department of Geography, Birkbeck, University of London, Malet Street, London, U.K.
Keywords: Consumption Inequality, OpenStreetMap (OSM), Data Quality, London.
Abstract: Citizen consumption refers to the goods and services which citizens utilise. This includes time spent on leisure
and cultural activities as well as the consumption of necessary and luxury goods and services. The spatial
dimension of consumption inequality can show the underlying urban spatial structure and processes of a city.
Usually, the main barrier to effectively measuring consumption is the availability and accessibility of spatial
data. While the main body of the literature utilises official, government data, such data is not always available,
up-to-date or can be costly to acquire. In this paper, we discuss the potential of Volunteered Geographic
Information (VGI) as a source of spatial data for determining consumption inequality. To this end, we
compared OpenStreetMap (OSM) data, that can be used as proxies for consumption inequality, with official
data in the area of Greater London. The results show that OSM is currently inadequate for studying the spatial
dimension of consumption. It is our view that while VGI is appropriate for tasks such as routing and
navigation, it also has the potential to add value to social science studies in the future.
1 INTRODUCTION
Cities are centres of consumption due to the size of
population and density (Glaeser et al. 2001) but
access to consumption spaces is not equal for all
citizens (Mahadevia and Sarkar 2012). While the
focus of the literature on urban inequality is usually
on income inequality, consumption inequality
deserves more attention. Briefly, consumption means
what people consume including what they allocate
time to such as leisure or cultural activities e.g.
cinema and music, luxury goods such as jewellery
and necessary goods such as food and medicine. On
one hand, shopping baskets vary across income
groups in terms of quality and quantity. On the other
hand, from a geographic point of view, it is taken for
granted that the prices of goods and services are
usually not constant in different parts of cities due to
a
https://orcid.org/0000-0003-2576-793X
b
https://orcid.org/0000-0003-0613-546X
c
https://orcid.org/0000-0003-3477-7654
1
https://www.bls.gov/cex/tables.htm
2
https://www.gov.uk/government/statistics/
english-indices-of-deprivation-2015
their quality and consumers' ability and willingness to
pay for them.
Although measuring consumption and leisure is
complex due to the multidimensionality of
consumption (Attanasio et al. 2012) such as allocated
time for leisure (Aguiar and Hurst 2007), identifying
where different goods and services are offered in the
city is a common interest of many disciplines such as
urban geography, urban economy, and sociology (Cai
et al. 2010). There are different data sources for
measuring consumption, such as Consumer
Expenditure Surveys
1
4
by the US Bureau of Labor
Statistics which provides data on expenditure,
income, and demographic characteristics of
consumers but this survey does not cover all
components of urban utilities such as leisure. Even
the Index of Multiple Deprivation
2
5
in the UK which
covers income, employment, health deprivation and
disability, education, skills and training, barriers to
278
Rabiei-Dastjerdi, H., McArdle, G. and Ballatore, A.
Urban Consumption Patterns: OpenStreetMap Quality for Social Science Research.
DOI: 10.5220/0009576302780285
In Proceedings of the 6th International Conference on Geographical Information Systems Theory, Applications and Management (GISTAM 2020), pages 278-285
ISBN: 978-989-758-425-1
Copyright
c
2020 by SCITEPRESS – Science and Technology Publications, Lda. All rights reserved

housing and services, crime and living environment
does not include consumption and leisure data. Other
efforts are usually limited to mapping energy
consumption and water consumption regardless of the
sociospatial setting of the city.
Measuring consumption and leisure inequality
(Attanasio and Pistaferri 2016), and mapping patterns
of consumption inequality of goods e.g. the
geographical distribution of fast food outlets and
supermarkets, pharmacies, and cultural centres of a
city draw a different picture from income inequality
(Attanasio and Pistaferri 2016). Many researchers
believe Volunteered Geographic Information (VGI)
can be an effective alternative to official data
(Goodchild 2007) or can enrich or complement
official data (Antoniou 2011). Among VGI platforms,
OpenStreetMap (OSM)
3
6 has been tested in various
domains such as land use classification (Pfoser 2013),
road network analysis (Zhang and Malczewski 2017),
and disaster management (Zook et al. 2010). While
many previous studies seem promising of the high
potentials of OSM applications, there is little research
on the extraction of locational insight from user-
generated data (Shelton et al. 2015) to investigate
spatial inequality, especially the spatial dimension of
consumption inequality. This is not surprising since,
OSM was not intended for this purpose, yet we seek
to understand if it is suitable for this type of study.
The focus of the literature is on different metrics
of accuracy related to OSM data, but mainly on the
road network and landmarks (Fan et al. 2014; Graser
et al. 2014). The aim of this paper is to examine the
question as to whether OSM data can be used as an
alternative to official data to measure or map spatial
variation of consumption inequality in goods and
urban amenities (Fraser et al. 2010; Dai and Wang
2011). The three main contributions of this paper are:
Assessing completeness, accuracy, and usefulness
of OSM data layers to study consumption
inequality in London.
Testing OSM data in mapping the spatial
dimension of consumption inequality.
Highlighting some of the limitations of using
OSM data in urban studies.
2 BACKGROUND
Crawford describes how “the ethos of consumption
has penetrated every sphere of our lives…[and]
increasingly constructs the way we see the world”
3
https://www.openstreetmap.org
(Crawford 1992, p. 11). Moreover, as Crew and Lowe
argue, “retailing and consumption create and recreate
place-specific” (Crewe and Lowe 1995, p. 1878).
Similarly, Functional Utility can help us to
understand the preferences of individuals for different
goods and services. Simply put, individuals buy the
most important goods and services of their necessities
based on their needs and ability to pay. (Currid‐
Halkett et al. 2019) classified consumption into three
frameworks from an economic geography
perspective, 1. commodification of cultures 2. high-
end luxurious 3. amenities. In this research, we
investigate the potential usage of OSM data to map
the spatial dimension of these main categories of
consumption in the city. The first one represents
cultural centres such as cinemas and theatres. The
second one can be viewed as conspicuous goods
(Veblen or luxury goods), and the last one as
necessary goods for life (Currid‐Halkett et al. 2019).
Table 1 shows which OSM tags may be used to
study and map consumption inequality in the city. It
also identifies why the selected tags are proxies of
consumption inequality based on relevant references
to the literature. For example, from a welfare point of
view, consumption inequality of basic necessities,
especially food is very important (Attanasio and
Pistaferri 2016). Food, as one of the basic needs of
human life, is a proxy for both nutrition and leisure
(Mair et al. 2008), but fast-food is energy-dense,
nutrient-poor and can cause obesity (Bowman et al.
2004). Fashion is a specific good that shows where
local identity and global drivers are united (Crewe
and Lowe 1996) and it is a cultural signifier
(McRobbie 1994) and is classified as Veblen goods.
Similarly, a beauty salon belongs to this class.
Furthermore, the swimming pool layer in OSM has
the potential to map the difference between rich and
poor neighbourhoods (Stephens 1996).
VGI has attractive characteristics such as free use
for users and researchers. During the last decade, a
plethora of research has been done using this type of
data (Longueville et al. 2010). The huge range of
applications and potential of VGI opens new horizons
for socioeconomic research and applications to
overcome data limitations and availability (Sun and
Du 2017). OSM, a prominent example of VGI,
attracts much attention, especially where there is no
validated or official data (Moomen et al. 2019). OSM
is available under an Open Database License
4
7, and
users can use, edit and share the maps without
copyright permission.
Recent
growing usage of OSM in different
4
https://opendatacommons.org/licenses/odbl/summary/
Urban Consumption Patterns: OpenStreetMap Quality for Social Science Research
279

Table 1: List of selected OSM Tags and layers.
Name Prox
y
/Descri
p
tion References
Fast food Malnutrition/Health (Burns and Inglis 2007; Mair et al. 2008)
Beaut
y
Salon Veblen
g
oo
d
(
Kwate et al. 2009
)
Garden Leisure
/
Health
(
Chen and Jim 2008; Lou
g
hran 2014
)
,
Swimming pool Leisure
/
Health (Stephens 1996; Salvati et al. 2016)
Cinema Entertainment
/
Culture (Shiel and Fitzmaurice 2001)
Pharmac
y
Health (Clark et al. 2012; Todd et al. 2014)
Librar
y
Entertainment
/
Culture
(
Calcuttawala 2004; Park 2012
)
,
Banks Access to finance
(
Liu et al. 2015
)
Baker
y
Food/ Health/Nutrition
(
Dai and Wan
g
2011
)
Restau
r
ant Leisure
/
Health/ Foo
d
(Mehta and Chang 2008)
domains
of socioeconomic and health research
includes the spatial availability of alcohol (Bright et
al. 2018), social activity of the population
(Putrenko 2017), and retail tobacco exposure
(Rodriguez et al. 2013).
The literature on consumption (inequality) is
usually based on official data and is concentrated on
the consumption of energy (Pereira and Assis 2013;
Souza et al. 2009) or water (Panagopoulos et al. 2012;
Vandecasteele et al. 2014). Usually, an important
driver in sociospatial studies is availability and access
to valid spatial data. Official data are not always up-
to-date and free to access for researchers. This
prompts the question in this paper regarding the
possibility of using OSM data to map consumption
inequality in the city as an alternative to official data.
To achieve this, we need to assess the veracity of
OSM data for this purpose. Different guidelines and
measures have been suggested to assess data quality
(Batini et al. 2009). Each method usually suggests
different metrics for different aspects of data quality.
For spatial data, seven key metrics are as follows
(Guptill and Morrison 1995; Shi et al. 2002; McArdle
and Kitchin 2016).
1. Lineage: the history of data.
2. Positional Accuracy: absolute and relative position.
3. Attribute Accuracy: the accuracy of quantitative
and qualitative data.
4. Completeness: to what extent spatial and attribute
data are complete, including geographical coverage
of spatial data (maps).
5. Logical Consistency: trustiness or dependability of
data.
6. Semantic Accuracy: consistency and persistency of
classes of objects.
7. Temporal Data: observation date, the validity of
time and type of update.
5
http://download.geofabrik.de/europe/great-
britain/england/greater-london.html
Although all measures are important in OSM
assessment (Fan et al. 2014; Ballatore and Zipf 2015),
based on our theoretical framework and the aims of
our research, we gave priority to the completeness of
data because it is a significant metric to study the
spatial dimension of inequality research. It is our
position that without a minimum acceptable degree of
completeness of data, it is not possible to measure any
type of (spatial) inequality in the city. McArdle and
Kitchin describe completeness as the degree to which
spatial and attribute data are included or omitted from
the database. It also describes how the sample is
derived from the full population and presents the
spatial boundaries of the data (McArdle and Kitchin
2016).
3 CASE STUDY & DATA
The case study is Greater London. London is a
thoroughly studied global city that is an ideal and
unique place to assess the usefulness and
completeness of OSM urban data. Researchers agree
that OSM data for London are extremely rich and so
it is an ideal case study to assess the best-case
completeness of OSM data for urban sociospatial
research (Ballatore and Sabbata 2018). OSM Shape
files were collected through two methods using the
GeoFabrik
5
8
website and the QGIS plugin
6
9 tool, for the
Greater London area in November 2019.
4 RESULTS & DISCUSSION
Table 2 shows the difference between the number of
entities of each layer in the official data and OSM data
that
we selected to measure consumption inequality.
6
https://plugins.qgis.org/plugins/QuickOSM/
GISTAM 2020 - 6th International Conference on Geographical Information Systems Theory, Applications and Management
280

Table 2: Comparison between OSM and official data sources.
OSM Tag Download Source and Number
of entities
Official
Statistics
Date Reference Format
geofabrik.de
(tag=amenity)
QuickOSM
(tag=class)
Fast foo
d
2398 2400 8662 June 2016 gov.u
k
Georef
/
CSV
Swimming pool 13 15 196 Oct 2008 london.gov.uk Report
Cinema 69 69 116 May 2019 data.london.gov.u
k
Georef
/
CSV
Library 169 169 342 Dec 2019 data.london.gov.uk GeoPackage
7
10
Pharmac
y
816 815 1839 Se
p
2019 ordnancesurve
y
.co.u
k
Georef/txt
Theatre 92 80 118 Jan 2019 data.london.gov.uk GeoPackage
Pub 2211 Na 4098 Jan 2019 data.london.
g
ov.u
k
GeoPacka
g
e
Museum and
Public galler
y
Na 86 163 Jan 2019 data.london.gov.uk GeoPackage
Jewelry Design Na 288 320 Nov 2018 data.london.gov.uk GeoPackage
Music
Venue
4
Venues
797 March 2018 data.london.gov.uk GeoPackage
School
4
Rehearsal
Studio
79 June 2019
Instrument
2
Recording
Studio
71 June 2019
All layers of OSM present a lower number of points
compared
to official data although official data is
usually updated slowly and scarcely. Most official
point
layer data were downloaded from the
LondonDatastore
8
11. To assess the impact of utilising
OSM data, typical spatial analysis approaches used to
identify the spatial aspects of consumption were
applied to the OSM and official data. Figure 1
presents, (a) the number of OSM data, (b) number of
official data, (c) Getis Ordi Gi*(Getis and Ord 2010)
of OSM, and (d) Getis Ordi Gi* of official data
respectively for 1. cinema as a cultural centre, 2.
jewellery shops as a provider of luxury good, and 3.
pharmacy as a place to provide basic necessary goods
in a 1000-meter hexagonal gird of the Greater London
Area. Getis Ordi Gi* (Z Score) shows the hotspots
and coldspots of selected layers on each map. Figure
1 shows how three selected layers including cinemas
(cultural consumption), jewellery shops (Veblen
goods), and pharmacies (necessary goods) are
distributed in both OSM and official data.
Both datasets show a concentration of data points
in the city centre. It shows that editors and contributors
in OSM are more focused on the centre of London
where the population activities and consumption
spaces are concentrated while other areas are ignored.
In other words, there is an inconsistency between the
geographical coverage of OSM and official data. This
means that OSM data are not representative of the
7
https://www.geopackage.org/
ground truth data. All Getis indexes (Z Score) also
illustrate a sharp gap between OSM and the official
dataset. For example, the maps in Figure 3c and 3d
show that hotspots and coldspots of pharmacy have
different patterns of data concentration and richness.
These types of visualisation were selected because they
can show the difference between point layers of official
and OSM datasets for this social science study.
The
analysis has shown the gaps in the OSM data and
highlights the challenges of using OSM data for a study
on consumption and inequality. Each dataset would
yield different results. The gaps may relate to the
semantic completeness of map features. Semantic
information describes the function or meaning of a map
feature such as its name or type. In many cases, the
spatial information is available but the description of
the spatial feature which is essential for sociospatial
research is absent and leads to an inability to classify
the feature type which impacts completeness and
veracity (Iddianozie and McArdle 2019).
5 CONCLUSIONS
Data collection is costly and time consuming, and
permission to use or license the data is a barrier in
providing the necessary data for research. Emerging
VGI in general and in particular the OSM platform
are
considered as tools to overcome the data barrier
8
https://data.london.gov.uk/dataset/statistical-gis-
boundary-files-london
Urban Consumption Patterns: OpenStreetMap Quality for Social Science Research
281
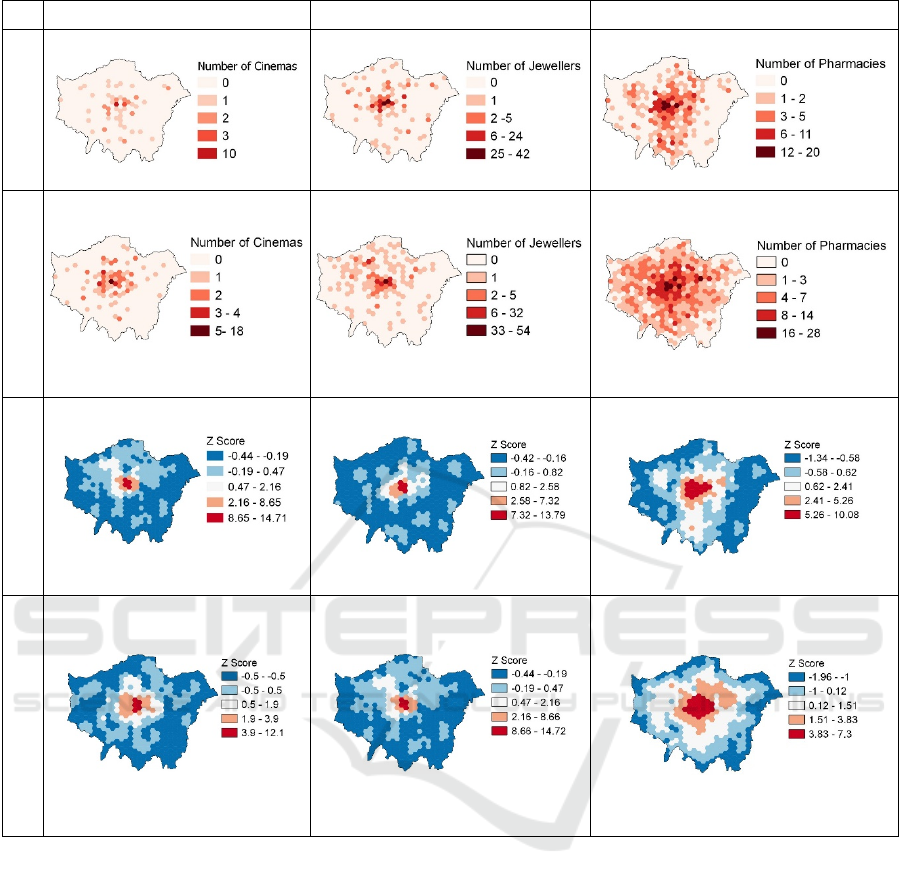
1. Cinema (Cultural Centre) 2. Jewellery (Veblen Good) 3. Pharmacy (Necessary Good)
a. Number in OSM
b.Number of Official Data
c.Getis Ordi Gi* of OSM
d.Getis Ordi Gi* of Offcial Data
Figure 1: Spatial Coverages and Patterns of Cinema, Jewelry Shops, and Pharmacy in OSM and Official Dataset. (Figure a)
Intensity of red color shows the number of points in each hexagon (Figure a and Figure b). Dark red color shows hotspots
and dark blue is coldstops (Figure c and Figure d) or Getis Ordi Gi* based on Z Score.
and limitation. OSM provides easy access to spatial
data for citizens, policy designers, urban mangers,
and researchers in some domains such as tracking and
road mapping. However, at present the veracity of
OSM data is insufficient for mapping underlying
sociospatial patterns.
Other studies have corroborated the inadequacy of
OSM in other research areas (Muzaffar et al. 2017).
In addition, we have seen in this paper that OSM data
and tags are not consistent across different
downloading methods. This issue makes OSM less
useable in urban socioeconomic research especially
for researchers with less technical skills. This
research raises these critical questions:
1. Why are some layers of OSM (especially layers
which were assessed in this paper) not complete?
How can the OSM mapping community be supported
to address this type of completeness?
2. Are there any relationships between the
completeness of OSM data and the underlying
socioeconomic process? Or in other words, can we
use spatial patterns of richness/incompleteness of
OSM data as a proxy for urban spatial inequality
especially (spatial) digital divide in the city?
3.
Will OSM find its position in the future for
urbansocioeconomic research comparing to
authoritative data sources considering the past and
GISTAM 2020 - 6th International Conference on Geographical Information Systems Theory, Applications and Management
282

current trends of enriching? Or How can we deal with
this problem?
It is not our intention to be negative towards OSM.
Afterall, it is not the remit of OSM to provide data for
the type of projects discussed in this paper, instead we
wish to highlight the potential of OSM as tool for use
within the social sciences. We have highlighted some
of the current shortcomings of OSM for this purpose.
A partial solution might be technical, but there are
other underlying cultural and socioeconomic factors
in OSM production and consumption that have
potential for multidisciplinary and interdisciplinary
research (Ballatore and Sabbata 2020). We will
explore these in future research.
ACKNOWLEDGEMENTS
Hamidreza Rabiei-Dastjerdi is a Marie Skłodowska-
Curie Career-FIT Fellow at UCD School of Computer
Science, CeADAR (Ireland’s National Centre for
Applied Data Analytics). Career-FIT has received
funding from the European Union’s Horizon 2020
research and innovation programme under the Marie
Skłodowska-Curie grant agreement No. 713654. The
Ordnance Survey Points of Interest data is licensed to
Birkbeck, University of London.
REFERENCES
Aguiar, M.; Hurst, E. (2007): Measuring Trends in Leisure:
The Allocation of Time Over Five Decades. In The
Quarterly Journal of Economics 122 (3), pp. 969–1006.
DOI: 10.1162/qjec.122.3.969.
Antoniou, V. (2011): User generated spatial content: an
analysis of the phenomenon and its challenges for
mapping agencies. UCL (University College London).
Attanasio, Orazio; Hurst, Erik; Pistaferri, Luigi (2012): The
Evolution of Income, Consumption, and Leisure
Inequality in The US, 1980-2010. Cambridge, MA.
Attanasio, Orazio P.; Pistaferri, Luigi (2016): Consumption
Inequality. In Journal of Economic Perspectives 30 (2),
pp. 3–28. DOI: 10.1257/jep.30.2.3.
Ballatore, Andrea; Sabbata, Stefano de (2018): Charting the
Geographies of Crowdsourced Information in Greater
London. In Ali Mansourian, Petter Pilesjö, Lars Harrie,
Ron van Lammeren (Eds.): Geospatial Technologies
for All, vol. 64. Cham: Springer International
Publishing (Lecture Notes in Geoinformation and
Cartography), pp. 149–168.
Ballatore, Andrea; Sabbata, Stefano de (2020): Los Angeles
as a digital place: The geographies of user‐generated
content. In Transactions in GIS 64 (1), p. 309. DOI:
10.1111/tgis.12600.
Ballatore, Andrea; Zipf, Alexander (2015): A Conceptual
Quality Framework for Volunteered Geographic
Information. In Sara Irina Fabrikant, Martin Raubal,
Michela Bertolotto, Clare Davies, Scott Freundschuh,
Scott Bell (Eds.): Spatial Information Theory. Cham,
2015: Springer International Publishing, pp. 89–107.
Batini, Carlo; Cappiello, Cinzia; Francalanci, Chiara;
Maurino, Andrea (2009): Methodologies for data
quality assessment and improvement. In ACM Comput.
Surv. 41 (3), pp. 1–52. DOI:
10.1145/1541880.1541883.
Bowman, Shanthy A.; Gortmaker, Steven L.; Ebbeling,
Cara B.; Pereira, Mark A.; Ludwig, David S. (2004):
Effects of fast-food consumption on energy intake and
diet quality among children in a national household
survey. In Pediatrics 113 (1 Pt 1), pp. 112–118. DOI:
10.1542/peds.113.1.112.
Bright, Jonathan; Sabbata, Stefano de; Lee, Sumin; Ganesh,
Bharath; Humphreys, David K. (2018): OpenStreetMap
data for alcohol research: Reliability assessment and
quality indicators. In Health & place 50, pp. 130–136.
DOI: 10.1016/j.healthplace.2018.01.009.
Burns, C. M.; Inglis, A. D. (2007): Measuring food access
in Melbourne: access to healthy and fast foods by car,
bus and foot in an urban municipality in Melbourne. In
Health & place 13 (4), pp. 877–885. DOI:
10.1016/j.healthplace.2007.02.005.
Cai, Hongbin; Chen, Yuyu; Zhou, Li-An (2010): Income
and consumption inequality in urban China: 1992–
2003. In Economic Development and Cultural Change
58 (3), pp. 385–413.
Calcuttawala, Zohra (2004): Knowledge stores: The spatial
dynamics of public library accessibility and
consumption in Calcutta. University of Cincinnati.
Chen, Wendy Y.; Jim, C. Y. (2008): Cost–benefit analysis
of the leisure value of urban greening in the new
Chinese city of Zhuhai. In Cities 25 (5), pp. 298–309.
DOI: 10.1016/j.cities.2008.06.002.
Clark, Robyn A.; Coffee, Neil; Turner, Dorothy; Eckert,
Kerena A.; van Gaans, Deborah; Wilkinson, David et
al. (2012): Application of geographic modeling
techniques to quantify spatial access to health services
before and after an acute cardiac event: the Cardiac
Accessibility and Remoteness Index for Australia
(ARIA) project. In Circulation 125 (16), pp. 2006–
2014. DOI:
10.1161/CIRCULATIONAHA.111.083394.
Crawford, Margaret (1992): The world in a shopping mall.
In The city cultures Reader.
Crewe, Louise; Lowe, Michelle (1995): Gap on the map?
Towards a geography of consumption and identity. In
Environment and Planning A 27 (12), pp. 1877–1898.
Crewe, Louise; Lowe, Michelle (1996): United colours?
Globalization and localization tendencies in fashion
retailing. In Retailing, Consumption and Capital.
Towards the New Retail Geography. London:
Longman, pp. 271–283.
Currid‐Halkett, Elizabeth; Lee, Hyojung; Painter, Gary D.
(2019): Veblen goods and urban distinction: The
Urban Consumption Patterns: OpenStreetMap Quality for Social Science Research
283

economic geography of conspicuous consumption. In
Journal of Regional Science 59 (1), pp. 83–117.
Dai, Dajun; Wang, Fahui (2011): Geographic disparities in
accessibility to food stores in southwest Mississippi. In
Environ. Plann. B 38 (4), pp. 659–677. DOI:
10.1068/b36149.
Fan, Hongchao; Zipf, Alexander; Fu, Qing; Neis, Pascal
(2014): Quality assessment for building footprints data
on OpenStreetMap. In International Journal of
Geographical Information Science 28 (4), pp. 700–719.
DOI: 10.1080/13658816.2013.867495.
Fraser, Lorna K.; Edwards, Kimberly L.; Cade, Janet;
Clarke, Graham P. (2010): The geography of fast food
outlets: a review. In International journal of
environmental research and public health 7 (5),
pp. 2290–2308.
Getis, Arthur; Ord, J. Keith (2010): The Analysis of Spatial
Association by Use of Distance Statistics. In Luc
Anselin, Sergio J. Rey (Eds.): Perspectives on Spatial
Data Analysis. Berlin, Heidelberg: Springer Berlin
Heidelberg, pp. 127–145. Available online at
https://doi.org/10.1007/978-3-642-01976-0_10.
Glaeser, Edward L.; Kolko, Jed; Saiz, Albert (2001):
Consumer city. In Journal of Economic Geography 1
(1), pp. 27–50. DOI: 10.1093/jeg/1.1.27.
Goodchild, Michael F. (2007): Citizens as sensors: the
world of volunteered geography. In GeoJournal 69 (4),
pp. 211–221.
Graser, Anita; Straub, Markus; Dragaschnig, Melitta
(2014): Is OSM Good Enough for Vehicle Routing? A
Study Comparing Street Networks in Vienna. In Georg
Gärtner, Haosheng Huang (Eds.): Progress in location-
based services 2014, vol. 22. Cham: Springer (Lecture
Notes in Geoinformation and Cartography, 1863-2246),
pp. 3–17.
Guptill, Stephen C.; Morrison, Joel (1995): Elements of
spatial data quality. Kidlington: Elsevier Science.
Iddianozie, Chidubem; McArdle, Gavin (2019): A transfer
learning paradigm for spatial networks. In Chih-Cheng
Hung, George A. Papadopoulos (Eds.): The 34th
Annual ACM Symposium on Applied Computing.
Limassol, Cyprus, April 8-12, 2019. the 34th
ACM/SIGAPP Symposium. Limassol, Cyprus,
4/8/2019 - 4/12/2019. [New York, New York]:
Association for Computing Machinery, pp. 659–666.
Kwate, Naa Oyo A.; Yau, Chun-Yip; Loh, Ji-Meng;
Williams, Donya (2009): Inequality in obesigenic
environments: fast food density in New York City. In
Health & place 15 (1), pp. 364–373. DOI:
10.1016/j.healthplace.2008.07.003.
Liu, Yafei; Dijst, Martin; Geertman, Stan (2015):
Residential segregation and well-being inequality over
time: A study on the local and migrant elderly people in
Shanghai. In Cities 49, pp. 1–13. DOI:
10.1016/j.cities.2015.06.012.
Longueville, Bertrand De; Luraschi, Gianluca; Smits, Paul;
Peedell, Stephen; Groeve, Tom De (2010): Citizens as
sensors for natural hazards: A VGI integration
workflow. In Geomatica 64 (1), pp. 41–59.
Loughran, Kevin (2014): Parks for profit: The high line,
growth machines, and the uneven development of urban
public spaces. In City & Community 13 (1), pp. 49–68.
Mahadevia, Darshini; Sarkar, Sandip (2012): Handbook of
urban inequalities. In OUP Catalogue.
Mair, Heather; Sumner, Jennifer; Rotteau, Leahora (2008):
The politics of eating: Food practices as critically
reflexive leisure. In Leisure/Loisir 32 (2), pp. 379–405.
DOI: 10.1080/14927713.2008.9651415.
McArdle, Gavin; Kitchin, Rob (2016): Improving the
veracity of open and real-time urban data. In Built
Environment 42 (3), pp. 457–473.
McRobbie, Angela (1994): Postmodernism and popular
culture. London: Routledge.
Mehta, Neil K.; Chang, Virginia W. (2008): Weight Status
and Restaurant Availability: A Multilevel Analysis. In
American Journal of Preventive Medicine 34 (2),
pp. 127–133. DOI: 10.1016/j.amepre.2007.09.031.
Moomen, Abdul-Wadood; Bertolotto, Michela; Lacroix,
Pierre; Jensen, David (2019): Inadequate adaptation of
geospatial information for sustainable mining towards
agenda 2030 sustainable development goals. In Journal
of Cleaner Production 238, p. 117954. DOI:
10.1016/j.jclepro.2019.117954.
Muzaffar, Hafiz Muhammad; Tahir, Ali; Ali, Asmat;
Ahmad, Munir; McArdle, Gavin (2017): Quality
Assessment of Volunteered Geographic Information for
Educational Planning. In : Volunteered Geographic
Information and the Future of Geospatial Data: IGI
Global, pp. 76–96.
Panagopoulos, George P.; Bathrellos, George D.;
Skilodimou, Hariklia D.; Martsouka, Faini A. (2012):
Mapping Urban Water Demands Using Multi-Criteria
Analysis and GIS. In Water Resour Manage 26 (5),
pp. 1347–1363. DOI: 10.1007/s11269-011-9962-3.
Park, Sung Jae (2012): Measuring public library
accessibility: A case study using GIS. In Library &
Information Science Research 34 (1), pp. 13–21. DOI:
10.1016/j.lisr.2011.07.007.
Pfoser, Dieter (Ed.) (2013): Proceedings of the Second
ACM SIGSPATIAL International Workshop on
Crowdsourced and Volunteered Geographic
Information. the Second ACM SIGSPATIAL
International Workshop. Orlando, Florida, 11/5/2013 -
11/5/2013. New York, NY: ACM.
Putrenko, Viktor (2017): Data mining of relationship in
crowdsourcing projects and social activities of citizens.
In : 2017 IEEE First Ukraine Conference on Electrical
and Computer Engineering (UKRCON). Conference
proceedings : May 29-June 2, 2017, Kyiv, Ukraine.
2017 IEEE First Ukraine Conference on Electrical and
Computer Engineering (UKRCON). Kiev, 5/29/2017 -
6/2/2017. [Piscataway, New Jersey]: IEEE, pp. 1060–
1065.
Rodriguez, Daniel; Carlos, Heather A.; Adachi-Mejia,
Anna M.; Berke, Ethan M.; Sargent, James (2013):
Retail tobacco exposure: Using geographic analysis to
identify areas with excessively high retail density. In
nicotine & tobacco research 16 (2), pp. 155–165.
GISTAM 2020 - 6th International Conference on Geographical Information Systems Theory, Applications and Management
284

Salvati, Luca; Ridolfi, Elena; Pujol, David Saurí; Ruiz, Pere
Serra (2016): Latent sprawl, divided Mediterranean
landscapes: urban growth, swimming pools, and the
socio-spatial structure of Athens, Greece. In Urban
Geography 37 (2), pp. 296–312. DOI:
10.1080/02723638.2015.1058115.
Shi, Wenzhong; Goodchild, Michael F.; Fisher, Peter F.
(2002): Spatial data quality. London: Taylor & Francis.
Shiel, Mark; Fitzmaurice, Tony (2001): Cinema and the
city. Film and urban societies in a global context /
edited by Mark Shiel and Tony Fitzmaurice. Oxford:
Blackwell (Studies in urban and social change).
Stephens, Carolyn (1996): Healthy cities or unhealthy
islands? The health and social implications of urban
inequality. In Environment and Urbanization 8 (2),
pp. 9–30. DOI: 10.1177/095624789600800211.
Sun, Yeran; Du, Yunyan (2017): Big data and sustainable
cities: applications of new and emerging forms of
geospatial data in urban studies. In Open geospatial
data, softw. stand. 2 (1), p. 1940. DOI:
10.1186/s40965-017-0037-0.
Todd, Adam; Copeland, Alison; Husband, Andy; Kasim,
Adetayo; Bambra, Clare (2014): The positive pharmacy
care law: an area-level analysis of the relationship
between community pharmacy distribution, urbanity
and social deprivation in England. In BMJ open 4 (8),
e005764. DOI: 10.1136/bmjopen-2014-005764.
Vandecasteele, I.; Bianchi, A.; Batista e Silva, F.; Lavalle,
C.; Batelaan, O. (2014): Mapping current and future
European public water withdrawals and consumption.
In Hydrol. Earth Syst. Sci. 18 (2), pp. 407–416. DOI:
10.5194/hess-18-407-2014.
Zhang, Hongyu; Malczewski, Jacek (2017): Accuracy
evaluation of the Canadian OpenStreetMap road
networks. In International Journal of Geospatial and
Environmental Research 5 (2).
Zook, Matthew; Graham, Mark; Shelton, Taylor; Gorman,
Sean (2010): Volunteered Geographic Information and
Crowdsourcing Disaster Relief: A Case Study of the
Haitian Earthquake. In World Medical & Health Policy
2 (2), pp. 6–32. DOI: 10.2202/1948-4682.1069.
Urban Consumption Patterns: OpenStreetMap Quality for Social Science Research
285
