
Towards an Automatic Data Value Analysis Method for Relational
Databases
Malika Bendechache
a
, Nihar Sudhanshu Limaye and Rob Brennan
b
ADAPT Centre, School of Computing, Dublin City University, Dublin 9, Ireland
Keywords:
Data Value, RDB, Information Systems, CMM, Metrics, Survey.
Abstract:
Data is becoming one of the world’s most valuable resources and it is suggested that those who own the data
will own the future. However, despite data being an important asset, data owners struggle to assess its value.
Some recent pioneer works have led to an increased awareness of the necessity for measuring data value.
They have also put forward some simple but engaging survey-based methods to help with the first-level data
assessment in an organisation. However, these methods are manual and they depend on the costly input of
domain experts. In this paper, we propose to extend the manual survey-based approaches with additional
metrics and dimensions derived from the evolving literature on data value dimensions and tailored specifically
for our use case study. We also developed an automatic, metric-based data value assessment approach that (i)
automatically quantifies the business value of data in Relational Databases (RDB), and (ii) provides a scoring
method that facilitates the ranking and extraction of the most valuable RDB tables. We evaluate our proposed
approach on a real-world RDB database from a small online retailer (MyVolts) and show in our experimental
study that the data value assessments made by our automated system match those expressed by the domain
expert approach.
1 INTRODUCTION
With recent advances in information and communi-
cation technologies, such as digital sensor technolo-
gies, social media and digital transformation of or-
ganisations, we are able to collect huge amounts of
data across a wide variety of fields. Furthermore, we
live in an era where all what we do is leaving a digital
footprint (data) which can be recorded, collected and
used to provide insights (Bendechache et al., 2019).
Storing huge amounts of data and selecting which
part is worth curating or using to drive the analyt-
ics process can be very costly for companies (Brous
et al., 2016). This requires a form of data governance
to decide which data and business management ac-
tions should be conducted (Khatri and Brown, 2010).
The data management association, DAMA, defines
data governance “as the processes, policies, organisa-
tion and technologies required to manage and ensure
the availability, usability, integrity, consistency, au-
ditability and security of data” (International, 2017).
The basis of governance decision making is balanc-
a
https://orcid.org/0000-0003-0069-1860
b
https://orcid.org/0000-0001-8236-362X
ing value and risk (Tallon, 2013). This means it is
important to have methods to decide which data is
valuable and which data is not (International, 2017).
Data value can play a deciding role in data manage-
ment decisions as it can be used to rank the data based
on its importance to the organisation, thus facilitating
the decision-making process for data deletion, cura-
tion and improvement (Attard and Brennan, 2018).
Unfortunately research into data value is imma-
ture, despite notable contributions from practition-
ers (Laney, 2017). To date, most work has focused
on establishing the dimensions of data value (Vis-
cusi and Batini, 2014) rather than developing con-
crete metrics or assessment methods as is seen in
the related domain of data quality research (Zaveri
et al., 2016). One fruitful area of work has been on
manual data value assessment techniques (Brennan
et al., 2019) but these are not scalable to the typi-
cal data governance challenges being faced by organ-
isations today and will not satisfy the realtime, au-
tomated data value monitoring and control loops for
the next generation of data governance systems (Bren-
nan et al., 2018) based on the systems of insight
paradigm for digital transformation. However many
potential data value metrics overlap with data value
Bendechache, M., Limaye, N. and Brennan, R.
Towards an Automatic Data Value Analysis Method for Relational Databases.
DOI: 10.5220/0009575508330840
In Proceedings of the 22nd International Conference on Enterprise Information Systems (ICEIS 2020) - Volume 2, pages 833-840
ISBN: 978-989-758-423-7
Copyright
c
2020 by SCITEPRESS – Science and Technology Publications, Lda. All rights reserved
833

metrics (Laney, 2017) and there have been a number
of siloed data management applications developed in-
dependent of any overall governance system that in-
clude data value calculations in their core, for exam-
ple in file management (Wijnhoven et al., 2014) appli-
cations. Thus, for practical business applications that
are still overwhelmingly driven by data stored in rela-
tional databases there is a lack of clarity on how data
value or data governance may be deployed to improve
decision making.
The aim of this work is to answer the two fol-
lowing research questions: (i) To what extent can the
data value of a relational database (RDB) of an or-
ganisation be accurately quantified (measured) using
a metrics-based approach?, and (ii) Which existing
data value metrics are most effective at predicting the
value of data in a Relational database (RDB)?
To answer these two questions, we first propose
an extended questionnaire (survey) for manual data
value assessment of an RDB. The questions were de-
signed based on a set of relevant data value dimen-
sions for any RDB–including the real world use case
of an online retailer studied in this paper. The ex-
tended survey targets data value dimensions that are
now considered important but were omitted from the
original one. The survey was answered by domain
experts in an organisation and scored following the
method of Sadjko et al. to manually create a baseline
data value assessment for the organisation. Second,
we propose a new automatic metrics-based approach
to assessing the business value of an RDB. Our ap-
proach was evaluated on real RDB data provided by
MyVolts, a lean online retail SME which has largely
automated its business and stores all its business pro-
cess data in its RDB. Our automatic data value assess-
ment technique consists of a system that queries the
RDB to calculate metrics for each data value dimen-
sion assessed by the answers to the relevant questions
in the survey provided to the domain expert. Our goal
is to show that our automated technique can match
the data value assessment baselines provided by the
domain experts. We also propose a scoring method
for data assessment results which assigns a score to
the different tables in the RDB and returns a ranking
of the most valuable table amongst them. Addition-
ally, we integrate our proposed approach with a well-
known visualisation tool to provide faster and simpler
insights into the data value assessment results.
This paper makes the following contributions:
1. Proposing an extended questionnaire for manual
data value assessment.
2. Proposing an automatic and quantified metric-
based approach for data value assessment in an
RDB.
3. Comparing the results of both manual and auto-
matic data value assessment techniques.
4. Proposing a scoring method for data asset value.
5. Integrating a visualisation tool (Tableau) to show
the final scoring system.
The remainder of this paper is organised as follows:
Section 2 introduces value-driven data governance
and data value dimensions. Section 3 presents se-
lected related work. Section 4 explains our extended
survey-based approach, whereas Section 5 details
our proposed automatic data value analysis approach.
Section 6 describes our use case based on the RDB
of the company MyVolts. Section 7 presents and dis-
cusses the experimental results. The paper concludes
with a summary of the paper and a discussion of fu-
ture work in Section 8.
2 BACKGROUND
2.1 Value-driven Data Governance
As the volume of data continues to rise, and en-
terprises/organisations rely more and more on their
data, this latter is being duplicated, transformed, frag-
mented, and isolated into silos (El Abed, 2009). The
sheer volume of data also affects data quality, since
data standards cannot be enforced so easily. Such
data may lead to additional risks, increased costs, in-
efficient processes, and therefore potential business
losses (Brous et al., 2016). Although there is a gen-
eral understanding that high quality data leads to more
benefits when the data is exploited, there is a lack of
maturity of data management processes, as well as
the resulting business impact of using it. These is-
sues already show a clear need to manage data assets.
Since data governance, management efforts, and in-
vestments are on the rise, it is becoming increasingly
relevant to identify the economic value of data and
its return on investment (Laney, 2017). Note that the
value of the data can also be determined by how data
is used -for example for control and coercion (Barn
and Barn, 2018). In this paper we focus on the the
monetary value of data. Data value has been used as a
basis for organisational decision making for quality
management (Even and Shankaranarayanan, 2005),
but also as a part of automated control systems for
data lifecycles (Chen, 2005). Failing to assign value
to data will result in a number of consequences such
as retaining information that has little to no value, re-
ducing data usage, and leaving data investments vul-
nerable to budget cuts (Maina, 2003). Hence, the data
value is an aspect that plays a very important role in
ICEIS 2020 - 22nd International Conference on Enterprise Information Systems
834

data governance. The issue is that although data is
gaining recognition as a valuable asset, it has as yet
resisted reliable quantitative measurement.
2.2 Data Value Dimensions
Dimensions are the set of measurable features that
characterise data value, similar to data quality di-
mensions (International, 2017). A dimension is a
category typically designed while considering user-
oriented views towards data value. Data value as-
sessment should aim to be holistic in measuring the
dimensions of data value for an organisation (Bren-
nan et al., 2019). For example, one of the dimen-
sions which are mentioned in the literature is “Vol-
ume” (Laney, 2017). The volume dimension reifies
concepts such as “more data more value” and leads to
metrics such as counting joins in queries and an indi-
cator of value whereby if these two things are satisfied
by a database table then its value is high compared to
other tables (Attard and Brennan, 2018).
3 LITERATURE REVIEW
Trends such as Big Data have popularised the need
for enterprises to become more data-driven and in-
creased the need for a better understanding of what
that means (Economist, 2017). However, deciding
which data is valuable is a difficult task. The infor-
mation has a notional value only. People think it is
valuable but they can not quantify its value (Moody
and Walsh, 1999).
(Moody and Walsh, 1999) identify “Laws of in-
formation” to understand data value. However, the
authors proposed a manual survey approach towards
data valuation and did not provide any concrete met-
rics to quantify the data value for a specific data asset.
The book “Infonomics: How to Monetize, Man-
age, and Measure Information as an Asset for Com-
petitive Advantage” by (Laney, 2017), discusses the
different quantitative data value approaches. How-
ever, the book looked at the metrics from a business
point of view. Besides, the survey is shallow and
unsatisfying in terms of pointing out operational ap-
proaches to quantitative data value methods and tools
when compared with equivalent work on data quality
metrics.
The main method to assess data value is through
finding dimensions of information value (Brennan
et al., 2018). A couple of works have been done
with this regards in different application domains. For
example, (Sajko et al., 2006) provides an idea of di-
mensions and their corresponding metrics to be used
for value assessment. The main dimension discussed
by (Sajko et al., 2006) are Rebuilding, Legislative,
Time, and Market value. However, these metrics can
vary according to the use case at hand. (Wijnhoven
et al., 2014) used mainly the dimension Volume for
assessing the data value in the area of file-storage
management. Assessing the data value in the infor-
mation management lifecycle was done by (Chen,
2005). The author looked specifically at Usage as a
data value dimension. (Rao and Ng, 2016) looked
at the value assessment in information pricing. Data
governance (Stander, 2015), and data quality man-
agement (Even et al., 2010) are two other areas that
looked at value assessment. A recent paper by (Bren-
nan et al., 2018) includes a Capability Maturity Model
(CMM) that tries to identify specific metrics and uses
open data to analyse it.
In this paper we use the metrics defined by the
CMM model defined by (Brennan et al., 2018) and
test them on a relational database environment. We
propose an automated metric-based system that quan-
tifies the business value of an RDB and compare its
results to the baseline survey-based approach.
4 AN EXTENDED
SURVEY-BASED APPROACH
Manual data value assessment techniques based on
surveys are an important tool in the absence of
automated techniques. In fact, in the book Info-
nomics (Laney, 2017) several aspects of data value
are identified as best quantified through surveys, for
example data usability, given their complex relation
to business processes. Here we present an extended
survey technique that addresses more dimensions of
data value.
One structured data value survey method that
has already been deployed on many industrial use
cases (Brennan et al., 2019) is the security risk as-
sessment survey of Sadjko et al. (Sajko et al., 2006).
This simple five question survey is structured around
the five data value dimensions of utility, replacement
cost, competitive advantage, regulatory risk and time-
liness. It is important to note that each question and
set of five possible answers is phrased in ways that are
approachable to business domain experts rather than
data governance personnel. The specific data value
dimensions are never named. For example for the
regulatory risk dimension: “Is there any obligation to
keep this data and any consequences for the organisa-
tion if it loses it?” with possible answers “(a) There
are none. (b) It is necessary to keep the data for a brief
period. (c) The organisations should keep the data but
Towards an Automatic Data Value Analysis Method for Relational Databases
835
without consequences. (d) Keeping the data is obliga-
tory and the company can suffer sanctions. (e) Keep-
ing the data is obligatory and the sanctions are strict.”
A Likert-type scoring scale is also provided for the
questionnaire results by Sajko et al. to convert the
survey results into numerical scores for each dataset.
The structured questionnaire is used to drive a stake-
holder assessment of the importance (value) of organ-
isational data assets as part of a workshop to deter-
mine which assets should receive the most attention
in the creation of a data security solution.
However there are limitations to this survey
method. The set of dimensions selected seems arbi-
trary given recent research on data value dimensions
(Viscusi and Batini, 2014). For example it is a major
limitation to not assess the usage dimension, which is
identified in both old (Moody and Walsh, 1999) and
new works (International, 2017) as a key dimension
of data value. In addition, the contribution of data
quality to value is not assessed. This is an impor-
tant omission because data quality metrics are ma-
ture and available for reuse, and crop up frequently
in surveys of the dimensions of data value (Viscusi
and Batini, 2014). One of the key dimensions of data
value identified for Big Data, but more widely appli-
cable, is the volume of data (one of the three V’s of
Big Data) (Laney, 2017). Finally we add the dimen-
sion of security as data which is protected by security
measures in an organisation is more likely to have
been assessed as valuable or important. For each of
these dimensions a new, business user-friendly, sur-
vey question was developed (see Table 1). All of these
dimensions of data value were identified as relevant to
our case study.
Having a wider variety of data value dimensions
addressed by the survey allows for more discrimina-
tory power but it also enables us to tailor the ques-
tionnaire to a specific use case. All of the questions
developed here are widely applicable to practical data
value assessments for many types of dataset and do-
main. Although manual data value assessment survey
methods rely heavily on human expertise, their sim-
plicity and engaging nature is very attractive for de-
ploying a first-level data assessment method in an or-
ganisation to (i) establish baselines for the evaluation
of automated methods, (ii) act as a first assessment of
data value from local domain experts that are aware of
the business use of data assets but who may struggle
with linking value either to more abstract data value
dimensions or choosing appropriate data value met-
rics, and (iii) to stimulate organisational awareness of
data value. Although (Sajko et al., 2006) report that
the method has been applied many times, their work
provides no example data on responses.
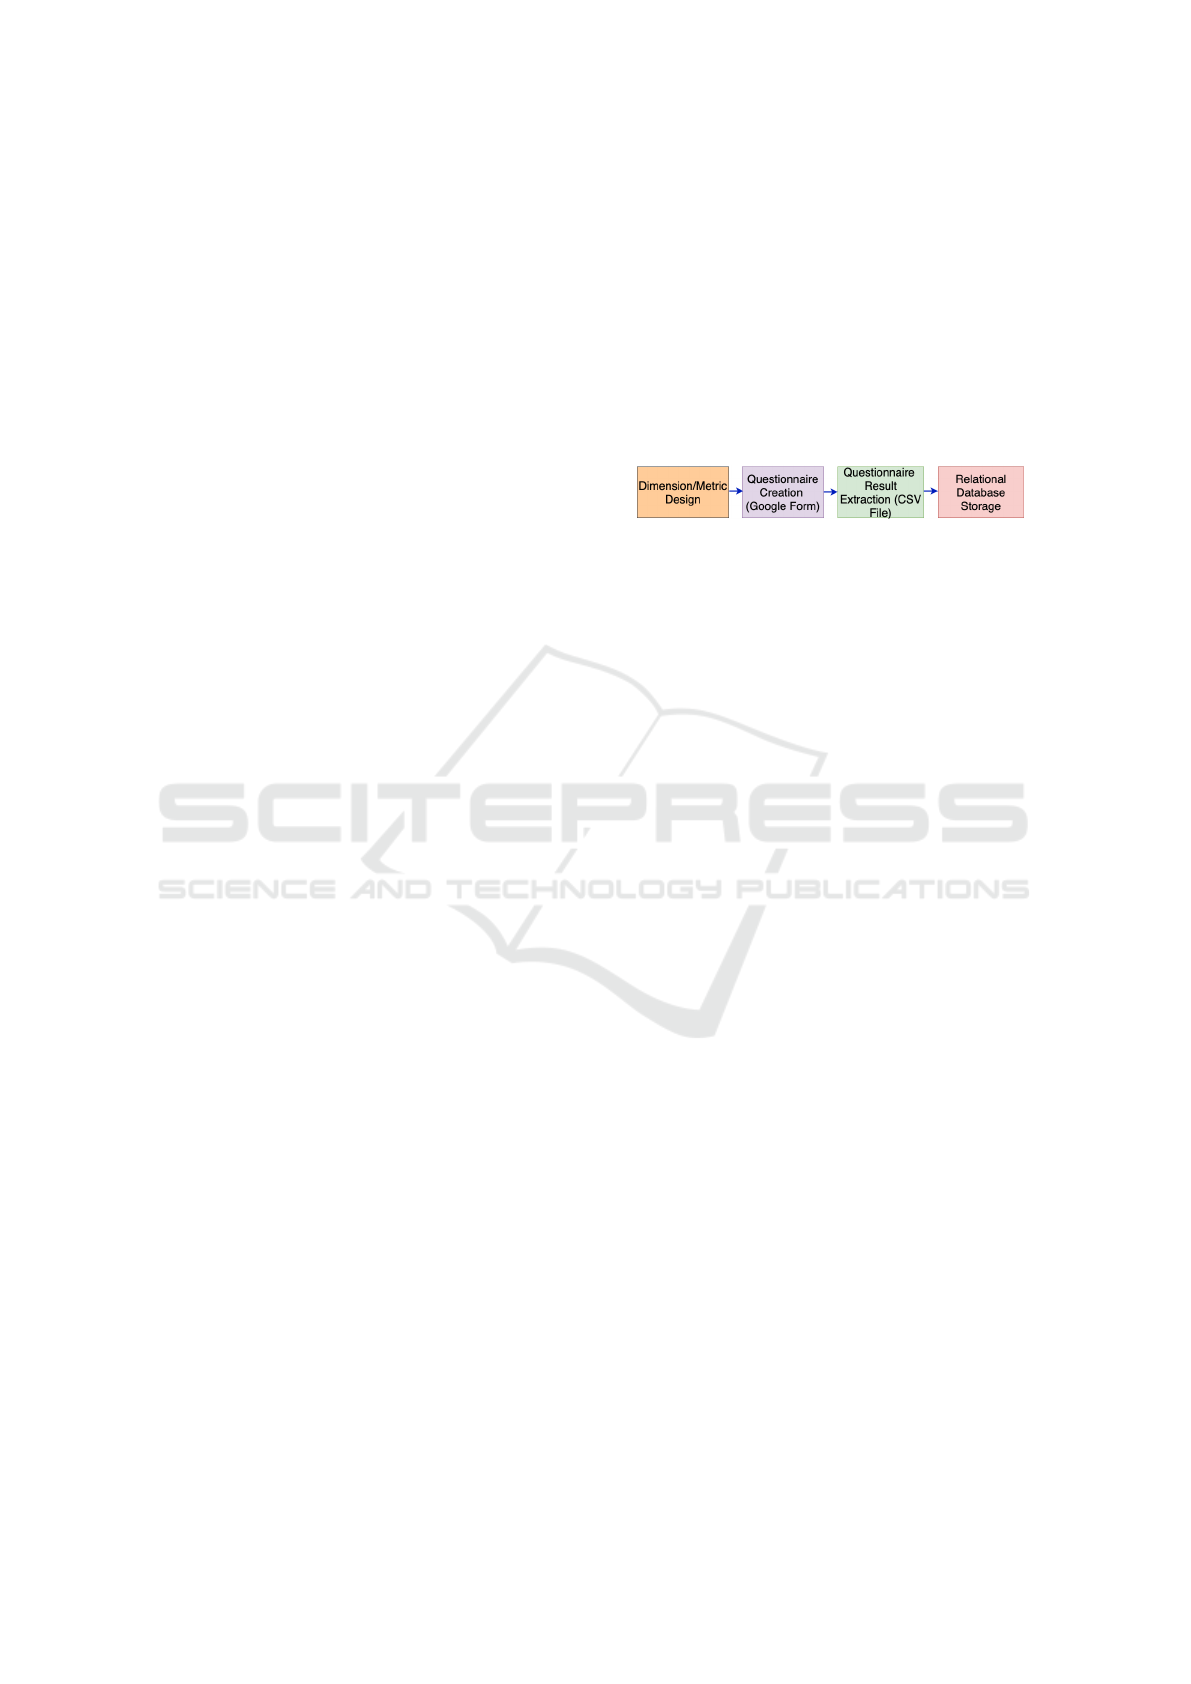
Figure 1 provides an overview of our extended
manual data value assessment survey method. In or-
der to save the answers for the set of questions, a
questionnaire form was created using Google form.
The Google form link is shared with domain experts
in the organisation (company). These questions were
mapped to a set of dimensions and metrics in the data.
Replies to the Google form are saved as a CSV file to
be used later as a baseline for comparing results of
our proposed automatic metric-based data value ap-
proach.
Figure 1: An Overview of the Survey-based Approach.
5 AN AUTOMATIC DATA VALUE
METRIC-BASED ANALYSIS
APPROACH
The goal of the proposed automatic metric-based al-
gorithm is to propose an automatic way of assessing
and quantifying the business value on any RDB. A
query-based technique is proposed to find the busi-
ness value of each table in an RDB. These values will
be compared to the values returned by the baseline
(survey-based) technique. Afterwards, a scoring sys-
tem is proposed to assign a value score for each table
in the RDB. Finally, a visualisation dashboard is pro-
posed to display the final results.
The first step in developing the automated method
was to establish a set of metrics that could be used to
generate indicators for each data value dimension to
be assessed in the RDB (see Table 2). Then a set of
competency questions were developed for each met-
ric to identify the RDB system attributes that would
need to be exposed by queries of the database, logs
or metadata. Once these were established, a further
level of specific query development can be carried out
to develop queries for the specific RDB SQL queries
(see Table 3).
The proposed automated evaluation process has a
set of steps starting from data gathering and cleaning
until data value scoring visualisation:
1. Data Cleaning. The data used is cleaned using
an open-source data cleaning tool called OpenRe-
fine to remove any inconsistency (unknown char-
acters, distorted values).
2. Data Storing. An RDB is created to store the
datasets that we want to assess its business value.
The CSV file that contains the survey questions
ICEIS 2020 - 22nd International Conference on Enterprise Information Systems
836
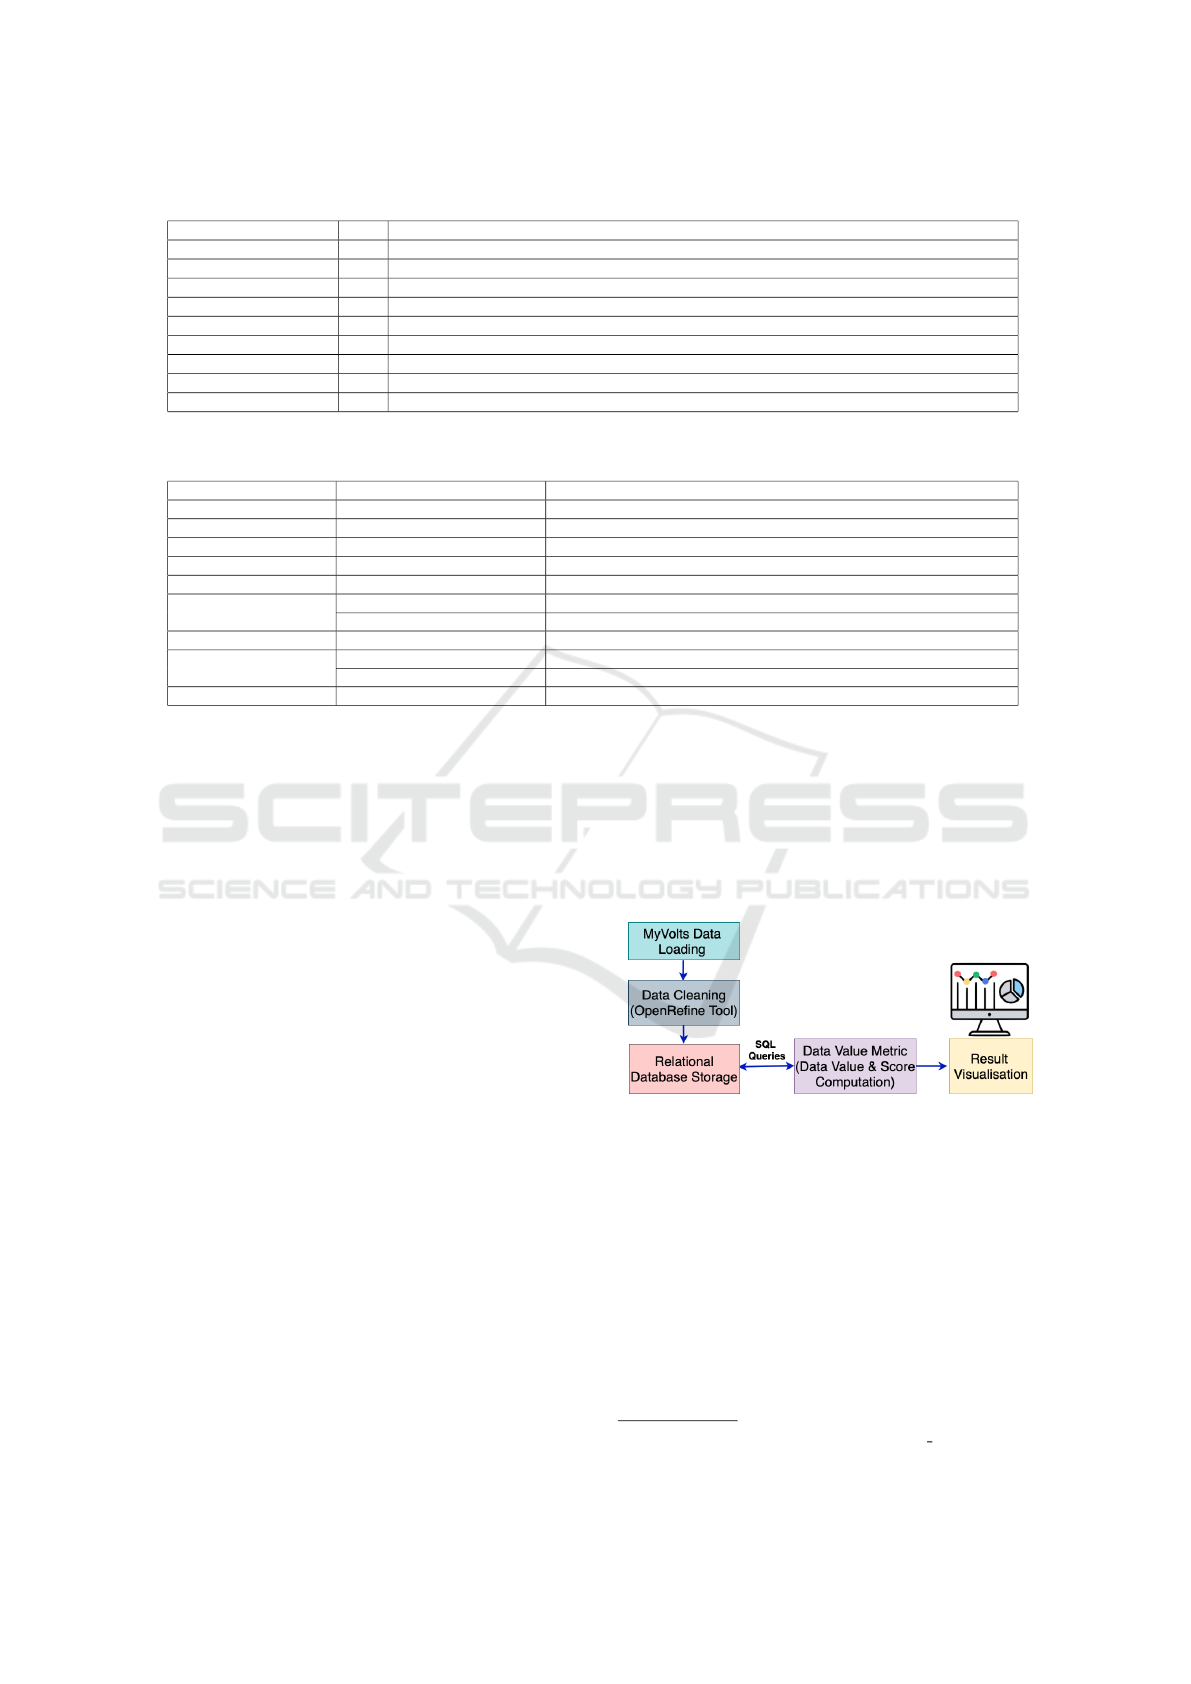
Table 1: Extended Survey-based Questions.
Dimension New Question
Utility No What happens if you do not have this data anymore?
Replacement Cost No What is the cost of replacing this data or producing new equivalent data?
Legislative Risk No Is there any obligation to keep this data and any consequences for the organisation if it loses it?
Timeliness No Does the data value fall in the course of time?
Competitive Advantage No What happens if your competitor has the same data?
Quality Yes What happens if this data is incomplete, inconsistent, inaccurate or invalid?
Usage Yes How frequently is this data accessed?
Volume Yes How big is this data?
Security Yes What security measures are deployed for this data?
Table 2: Proposed Relational Database Metrics for Each Data Value Dimension.
Dimension Metric Competency Question
Utility Number of business processes Which table has the most different systems querying it?
Replacement Cost Reproduction Which table has a capacity of new data to produce new data?
Legislative Risk Confidential Data Which data loss will create legal consequences if organisation losses it?
Timeliness Shelf Life Reduces Which database table information value falls in course of time?
Competitive Advantage Unique Data what database is unique for the organisation?
Quality
Duplicate Records Which table has the least duplicates?
Null Records Which database table has least null values?
Usage Number of writes in a day Which database table is used more frequently in a day?
Volume
High Record Count Which database table stores the highest records?
Interconnection Which database table can join with most of the other data?
Security Encryption Which database table contains encrypted values?
and answers created in the survey-based approach
is also loaded into the database.
3. Data Value and Scoring.
-A Query System: once the data is stored,
the algorithm starts querying the RDB. It fires
SQL queries specifically designed in line with
survey questions to get results. The query re-
sults will be compared to the survey results for
accuracy (matching). E.g. Survey Question:
Which database stores the highest records? Sur-
vey Answers - Answer Table 1. SQL query:
Query COUNT to get the highest record count of
database table - Answer Table 1. Similarly, other
queries are designed for each metric/question.
The results will be compared to the result of a
survey-based approach.
-A Scoring System: the algorithm uses a scoring
system, where it assigns a single point for each
successful output. In other words, If both Survey
answers and query result matches then the algo-
rithm adds a point to the table that scores best on
each question. (See Table1). E.g. The survey an-
swer, as well as query answer, says that Table 1
has the highest record count. Hence, Table 1 will
score 1 point. If a table satisfies more metrics,
more points are added against it. Finally, the table
with the highest points is returned to be the most
valued one.
4. Data Visualisation. The algorithm connects the
database tables and the data value scoring system
to a visualisation dashboard to display the ranking
of each database table along with its value. The
visualisation tool used is Tableau and it displays
the results in the form of graphs that simplify re-
sults’ understanding.
Figure 2: An Overview of the Automatic Metric-based Ap-
proach.
6 USE CASE: MyVolts
To show the results of our automatic metric-based as-
sessment technique, we consider a real use case of
an RDB used by MyVolts.com (MyVolts). The My-
Volts
1
is an online retail a Small Medium Enterprise
(SME) based in Dublin. MyVolts focuses on provid-
ing modern and innovative power solutions for home,
mobile and professional devices – mainly for musi-
1
http://myvolts.com/article.php/8/about myvolts
Towards an Automatic Data Value Analysis Method for Relational Databases
837

cians and other mobile creatives. The company fo-
cuses on both customer engagement and product ex-
pertise. They aim to provide well-designed and flexi-
ble power delivery solutions to exactly meet the needs
of many customers who pass through their checkouts
annually. the company has served over 1 million cus-
tomers to date.
MyVolts produces and processes a huge amount
of data. The company requires multiple databases to
store their data. MyVolts has two main data resources;
1) the main database (main DB) hosted locally by My-
Volts which contains several tables, and 2) an Amazon
seller database (Amazon DB) which is hosted in the
cloud.
The RDBs in MyVolts contains multiple tables.
In this paper, we only consider the relevant tables to
our case study which are; Price and Sales along with
Amazon DB. Each table in MyVolts database contains
thousands of records.
• Amazon Database. It contains a table named
amazonuk listings which stores the electric items
sold by MyVolts.com on the Amazon website.
The table includes; the item price, the number of
items, the last updated price for an item, etc. We
will refer to this table with the name Amazan DB.
• Pricing Database. Contains a table that stores the
pricing of items available at MyVolts. The com-
pany has a strategy of lowering the item’s price if
it is not sold for a long duration. So it contains
price data along with the discount percentage to
get a new price. We will refer to this table with
the name Price DB.
• Sales Database. This database contains a table
that stores the personal details of customers that
buy the MyVolts products online. We will refer to
this table with the name Sale DB.
Storing a huge amount of records (data) can be prob-
lematic for MyVols. Therefore, this work offers the
company a new and automatic approach to assessing
the business value of their data stored in their RDBs.
This will help the company understand their data and
help them manage their resources.
7 EXPERIMENTAL RESULTS
In this section, we will show the experimental results
of both extended survey-based and automatic metric-
based approaches for data value assessment. The pro-
posed approaches were tested on data provided by
MyVolts. The goals are (1) to compare the survey-
based and the automatic metric-based approaches and
show that the automatic approach succeeds to match
the results of the manual survey-based approach, (2)
to show that the proposed automatic metric-based ap-
proach not only returns good results but it also returns
a scoring system that enables us to rank the database
tables and return the most valuable amongst them to
the organisation, in our case MyVolts company.
7.1 Survey-based vs Metric-based Data
Value Results
The algorithm starts by querying the MyVolts
database tables according to dimensions and metrics
already defined in section 1. The algorithm fires some
SQL queries specifically designed in line with sur-
vey questions to get results. E.g. Query COUNT to
get the highest record count of database table. Like-
wise, multiple queries are designed according to met-
rics and dimensions. Table 3 summarises the set of the
used SQL queries to answer to the questions defined
in Table 1.
The results of the comparison between the man-
ual survey-based approach and the automatic metric-
based approach are shown in Table 4.
As it can be seen from Table 4, the automatic
metric-based approach results match those of the
manual survey-based approach across most of the
dimension in an RDB data source. The automatic
metric-based approach succeeded to assess the data
value of dimensions like Rebuilding, Security, Vol-
ume, Usage, Quality, and Legislative. However, met-
rics of dimensions like Time and Market value could
not be measured by the proposed automatic approach.
This is because the dimension “Market value” needs
contextual information and the dimension “Time”
could not be measured without extra data (i.e. meta-
data). Therefore, more information or metadata be-
sides the RDB need to be taken into account to cover
all the defined metric dimensions.
Figure 3 shows the value of each of the MyVolts
database tables. As we can see, the Price DB clearly
has more value points comparing to the other two
databases. Hence we can conclude that the Price DB
is more valuable for the MyVolts company than the
two other database tables.
Figure 3: The Automatic Data Value Assessment Results.
ICEIS 2020 - 22nd International Conference on Enterprise Information Systems
838
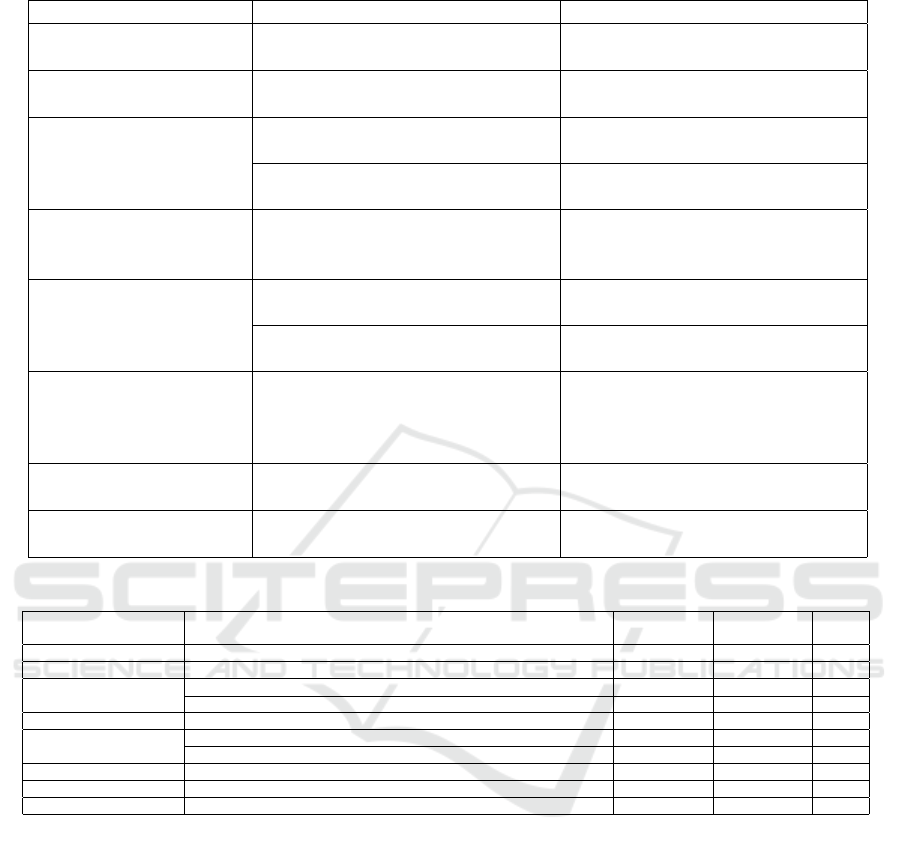
Table 3: Description of used SQL queries.
Dimension Possible Questions Generated Description of Used SQL Queries
Replacement Cost Which table has a capacity to pro-
duce new data?
Table with the largest average new
data per day
Security Which database table contains en-
crypted values?
Table with the largest number of en-
crypted values
Volume
which database table stores the
highest records?
Table with the largest number of
values
Which database table can join with
most of the other data?
Table with the largest number of
join
Usage Which database table is used more
frequently in a day?
Table with the largest number of
access queries per day (could be
stored in a table or in a server log)
Quality
Which table has the least dupli-
cates?
Table with the lowest number of du-
plicate values
Which database table has the least
null values?
Table with the lowest number of
null values
Legislative Risk Which data loss will create legal
consequences if organisation losses
it?
Table containing the largest num-
ber of attributes from specified
list (Name, Bank Details, Address,
etc.)
Time Which database table information
value falls in course of times?
NA
Competitive Advantage What database table is unique for
the organisation?
NA
Table 4: Survey-based Vs Metric-based Data Value Results.
Dimension Possible Questions Generated
Survey-based
Answers
Metric-based
Answers
Match
Replacement Cost Which table has a capacity to produce new data? Pricing DB Pricing DB Yes
Security Which database table contains encrypted values? Sales DB Sales DB Yes
Volume
which database table stores the highest records? Amazon DB Amazon DB Yes
Which database table can join with most of the other data? Pricing DB Pricing DB Yes
Usage Which database table is used more frequently in a day? Amazon DB Amazon DB Yes
Quality
Which table has the least duplicates? Pricing DB Pricing DB Yes
Which database table has the least null values? Pricing DB Pricing DB Yes
Legislative Which data loss will create legal consequences if organisation losses it? Sales DB Sales DB Yes
Timeliness Which database table information value falls in course of times? Amazon DV NA NA
Competitive Advantage What database table is unique for the organisation? Pricing DB NA NA
8 CONCLUSION AND FUTURE
WORK
State-of-the-art works on data value assessment anal-
ysis are very limited. The few existing works are fo-
cused on manual survey-based approaches. Although
the survey-based approaches proved their efficiency,
they lack in terms of quantifying the business value
of data for an organisation. In this paper, we pro-
posed an automatic metric-based approach that can
quantify the business value of a given RDB source
for an organisation. An extended version of a manual
survey-based approach was also proposed and used
as a baseline to compare the results of our automatic
based approach. The results satisfy the first research
question as “To what extent can the data value of
an RDB data source of an organisation be accurately
measured using a metrics-based approach?”. Our ex-
perimental results showed that nearly 70% of met-
rics used to measure data value give positive results.
Metrics of dimensions like Rebuilding, Security, Vol-
ume, Usage, Quality, and Legislative are successful
for measuring data value. However metrics of dimen-
sions like Time, Market value failed to measure data
value for an RDB data source because Market value
and Time need more specifics and contextual informa-
tion. Furthermore, the results also answered the sec-
ond research question “Which predefined data value
metrics are most effective at predicting a value for
the MyVolts online retailer use case?”. Eight dimen-
Towards an Automatic Data Value Analysis Method for Relational Databases
839

sion were used in this paper among which five (Re-
building, Usage, Legislative, Market value, and Time)
are the predefined ones taken from the state-of-the-art
metrics and three are the extra tailored dimension -
Volume, Security, and Quality, designed specifically
for MyVolts use case. The algorithm returned a per-
fect match compared to the manual survey-based ap-
proach results and it succeeded to accurately measure
the value of an RDB data source for a given use case
of MyVolts with predefined dimensions/metrics like
Rebuilding, Legislative and Usage and with tailored
dimensions like Security, Volume and Quality.
As future work, we plan to validate the proposed
approach with other real world use cases. We also
plan to study the type of metadata that need to be
joined to the RDB data and means to combined them
to enable measuring of the Market-value and Time di-
mensions. Furthermore, we also plan to propose an-
other multi-criteria decision analysis approach for as-
sessing more accurately the business value of data for
an organisation.
ACKNOWLEDGEMENTS
The ADAPT Centre is funded under the SFI Research
Centres Programme (Grant 13/RC/2106) and is co-
funded under the European Regional Development
Fund.
REFERENCES
Attard, J. and Brennan, R. (2018). Challenges in value-
driven data governance. In OTM Confederated Inter-
national Conferences” On the Move to Meaningful In-
ternet Systems”, pages 546–554. Springer.
Barn, B. and Barn, R. (2018). Towards a unified concep-
tual model for surveillance theories:” we shall meet
in the place where there is no darkness”-1984, george
orwell. In 2018 IEEE/ACM 40th International Con-
ference on Software Engineering, pages 71–80. IEEE.
Bendechache, M., Tari, A.-K., and Kechadi, M.-T. (2019).
Parallel and distributed clustering framework for big
spatial data mining. International Journal of Parallel,
Emergent and Distributed Systems, 34(6):671–689.
Brennan, R., Attard, J., and Helfert, M. (2018). Manage-
ment of data value chains, a value monitoring capabil-
ity maturity model. In ICEIS, pages 573–584.
Brennan, R., Attard, J., Petkov, P., Nagle, T., and Helfert,
M. (2019). Exploring data value assessment: a sur-
vey method and investigation of the perceived relative
importance of data value dimensions. In ICEIS 2019-
21st International Conference on Enterprise Informa-
tion Systems, pages 200–207. SciTePress.
Brous, P., Janssen, M., and Vilminko-Heikkinen, R. (2016).
Coordinating decision-making in data management
activities: a systematic review of data governance
principles. In International Conference on Electronic
Government, pages 115–125. Springer.
Chen, Y. (2005). Information valuation for information
lifecycle management. In Second International Con-
ference on Autonomic Computing (ICAC’05), pages
135–146. IEEE.
Economist, T. (2017). The world’s most valuable resource
is no longer oil, but data. The Economist: New York,
NY, USA.
El Abed, W. (2009). Data governance: a business value-
driven approach. In white paper.
Even, A. and Shankaranarayanan, G. (2005). Value-driven
data quality assessment. In ICIQ.
Even, A., Shankaranarayanan, G., and Berger, P. D. (2010).
Evaluating a model for cost-effective data quality
management in a real-world crm setting. Decision
Support Systems, 50(1):152–163.
International, D. (2017). DAMA-DMBOK: Data Manage-
ment Body of Knowledge. Technics Publications.
Khatri, V. and Brown, C. V. (2010). Designing data gover-
nance. Communications of the ACM, 53(1):148–152.
Laney, D. B. (2017). Infonomics: How to Monetize, Man-
age, and Measure information as an Asset for compet-
itive advantage. Taylor & Francis.
Maina, C. (2003). Valuing information in an information
age: The price model and the emerging information
divide among individuals, societies, and nations. In
Proceedings of the Annual Conference of CAIS/Actes
du congr
`
es annuel de l’ACSI.
Moody, D. L. and Walsh, P. (1999). Measuring the value
of information-an asset valuation approach. In ECIS,
pages 496–512.
Rao, D. and Ng, W. K. (2016). Information pricing:
a utility based pricing mechanism. In 2016 IEEE
14th Intl Conf on Dependable, Autonomic and Secure
Computing-(DASC), pages 754–760. IEEE.
Sajko, M., Rabuzin, K., and Ba
ˇ
ca, M. (2006). How to cal-
culate information value for effective security risk as-
sessment. Journal of Information and Organizational
Sciences, 30(2):263–278.
Stander, J. B. (2015). The modern asset: big data and in-
formation valuation. PhD thesis, Stellenbosch: Stel-
lenbosch University.
Tallon, P. P. (2013). Corporate governance of big data:
Perspectives on value, risk, and cost. Computer,
46(6):32–38.
Viscusi, G. and Batini, C. (2014). Digital information asset
evaluation: Characteristics and dimensions. In Capo-
rarello, L., Di Martino, B., and Martinez, M., editors,
Smart Organizations and Smart Artifacts, pages 77–
86. Springer International Publishing.
Wijnhoven, F., Amrit, C., and Dietz, P. (2014). Value-based
file retention: File attributes as file value and informa-
tion waste indicators. Journal of Data and Informa-
tion Quality (JDIQ), 4(4):1–17.
Zaveri, A., Rula, A., Maurino, A., Pietrobon, R., Lehmann,
J., and Auer, S. (2016). Quality assessment for linked
data: A survey. Semantic Web, 7(1):63–93.
ICEIS 2020 - 22nd International Conference on Enterprise Information Systems
840
