
Temporal Motifs in Smart Grid
Rucha Bhalchandra Joshi
1,2 a
, Annada Prasad Behera
1,2 b
and Subhankar Mishra
1,2 c
1
Machine Learning And Building (MLAB), School of Computer Sciences,
National Institute of Science Education and Research, Bhubaneswar - 752050, India
2
Homi Bhabha National Institute, Anushaktinagar, Mumbai - 400094, India
Keywords:
Smart Grid, Temporal Motifs, Complex Systems, Cyber-physical Systems.
Abstract:
A complex network can be characterized by patterns. Such frequently occurring significant patterns are called
motifs and in a time dependent network, they are called temporal motifs. One of the temporal networks where
temporal motifs are observed and play a major role; is the Smart Grid. The energy consumption pattern across
the appliances, houses, communities and entire cities help energy utility companies and consumers plan their
electricity generation and consumption. The temporal motifs for the smart grid constitutes of the consumers
and producers and the edge or connection represents energy flow between two participants of the network,
these connections last till the power is being consumed/generated. This paper formally defines the temporal
motifs for smart grid network and proposes a way to create such temporal motifs in the network. We also
discuss how the temporal motifs fit into the hierarchical structure of power distribution system of Smart Grid.
1 INTRODUCTION
Many complex systems can be abstracted with the
help of networks. The entities participating in the sys-
tems are modeled as nodes and the relations by which
they are linked to each other are modeled as the edges
of a network graph. Abstractions help us study the
complex system such as food chain, citation network.
Time dependent systems can be abstracted as tem-
poral networks. Some notable examples of temporal
network are Facebook, Email as well as recent net-
works such as Bitcoin. Structure of the temporal net-
work changes with time. Since the edges in temporal
graphs depend on time, their presence is determined
only at a given time. To understand the behaviour of
the temporal network, it is essential to consider the
time of occurrence of temporal edges.
One such system is smart grid network. A smart
grid has various entities, such as producers, con-
sumers, transmitters of power, participating in the net-
work. The hierarchical structure of the smart grid
has been discussed by (Aggarwal et al., 2010; Mishra
et al., 2016) where the power distribution in the grid is
according to the voltage. (Rech and Harth, 2012) dis-
cussed the existence of the consumption sector of the
a
https://orcid.org/0000-0003-1214-7985
b
https://orcid.org/0000-0003-2377-8993
c
https://orcid.org/0000-0002-9910-7291
hierarchy wherein the lowermost layer consists of the
last links of distribution grid connecting consumers
to the main grid. A transformer supplies the power to
the consumers that are connected to it. So, the second
layer from the bottom consists of transformers. The
third layer is of substations that supply power to the
transformers in second layer. This hierarchy goes up
along with all the participating entities in the grid net-
work. Pattern of distribution of power consumption
over the period of time form motifs. These motifs de-
picts the behaviour of the participating entities.
In a smart grid, the meters can get the data pertain-
ing to each of the appliances used in the house that
consumes amount of electricity. Smart meter keeps
track of the consumption of each of the rooms or any
other infrastructure that consumes electricity. Hence,
at household level, the electricity consumption and
distribution is known with the help of smart meters.
The inferences about the usage of electricity at the
lowermost layer in a smart grid can be drawn by tak-
ing this consumption data into consideration.
Our contributions are as follows:
• We formally define temporal motifs that occur in
smart grid network.
• We show a method for constructing such Tempo-
ral Motifs in Smart Grid network.
• We discuss Temporal Motifs in Smart Grid with
overlapping window and fitting the temporal mo-
122
Joshi, R., Behera, A. and Mishra, S.
Temporal Motifs in Smart Grid.
DOI: 10.5220/0009575301220127
In Proceedings of the 9th International Conference on Smart Cities and Green ICT Systems (SMARTGREENS 2020), pages 122-127
ISBN: 978-989-758-418-3
Copyright
c
2020 by SCITEPRESS – Science and Technology Publications, Lda. All rights reserved

tifs in the hierarchical structure of the smart grid.
The remainder of the paper is organized as follows:
Section 2 discusses the related work. We discuss the
background work in Section 3. Section 4 gives the de-
tailed explanation of our proposed model. We present
a case study and discussion of Temporal Motifs in
Smart Grid network are in Section 3 and 4 respec-
tively. We present the conclusions in Section 6.
2 RELATED WORK
Motifs (Milo et al., 2002) are the basic building
blocks of a complex network. They are recurring,
significant patterns of interconnections. The network
motifs are defined to study the structural design prin-
ciples of complex networks in various fields such as
biochemistry, neurobiology, ecology, engineering and
so on.
Motifs, defined as the frequently occurring and
significant patterns in time, can be used to character-
ize the time series data (Lin et al., 2003). Motifs in
temporal networks have been defined in order to un-
derstand their role in the temporal networks such as
the network of emails, phone calls, social media etc.
(Paranjape et al., 2017). However, they only consider
the occurrence of the edges one at a time without any
duration attached to the existence of the edges.
Motif based pattern detection technique was pro-
posed to discover regular behaviour of smart meter
users (Funde et al., 2018). The model proposed by
(Funde et al., 2018) considers one appliance at a time
and detects the motifs formed by it. They develop
temporal association rule mining to find the relation
between usage of energy by various appliances in a
particular time period. However, considering only
one appliance at a time does not tell a complete story
about the consumption pattern of the members of the
house.
3 BACKGROUND WORK
3.1 Temporal Graph and Motif
In a temporal graph G = (V, E) where V is set of ver-
tices and E is set of edges, the temporal edges are
represented as (u, v,t) where u, v ∈ V and a timestamp
t is associated with the edge. Temporal motif is a col-
lection of edges in a particular sequence that form a
particular structure in a given time window δ. Since
the timestamps are attached with each of the edges in
temporal network, the motif is the structure occurring
within time δ from the occurrence time of first edge.
This time window of size δ is slid over the time as we
consider the next motif. When we consider the tem-
poral edges in smart grid, the edges occur at different
times but they last for a duration of time. Smart grid is
a specific application of temporal network where the
edges have a time of occurrence and it remains in the
network till the appliance that caused it to occur was
switched off or no longer draws any energy from the
meter. This differentiates our work from the previous
work as edges stay alive for a certain duration. We
say that an edge occurs at a given time when the appli-
ance corresponding to the node connecting the edge is
turned on. The smart meter captures the energy at par-
ticular time interval in a sequence, hence we have to
assign a window time to it rather than the actual start
time of the consumption. The energy consumption by
same appliance may vary at different times.
3.2 Topology of Smart Grid
Figure 1: Topology of Power Grid.
The power distribution grid is arranged according to
the voltage (Aggarwal et al., 2010). The various levels
of the hierarchy are connected using the voltage net-
works, here power plants are connected via high volt-
age networks and the level of household appliances is
connected using a voltage network. The smart grid
is defined to consist of nodes N and interconnected
edges E; where nodes represent the actors and are
connected to #b other nodes (b is branching factor).
The levels of this hierarchy is denoted by L (Rech and
Harth, 2012).
4 SMART GRID TEMPORAL
MOTIFS
We propose a model (Figure 2) for creation of tem-
poral star motifs with associated symbol correspond-
ing to the energy consumption. We also show how
these motifs help to draw inferences from the hierar-
chy of the participants of a smart grid network. In
our proposed model the edges of the motifs have been
tagged with symbols associated with corresponding
energy consumption levels and time window. These
Temporal Motifs in Smart Grid
123
timestamps are indicatives of window frame num-
bers. They imply the order of occurrences of the motif
structures.
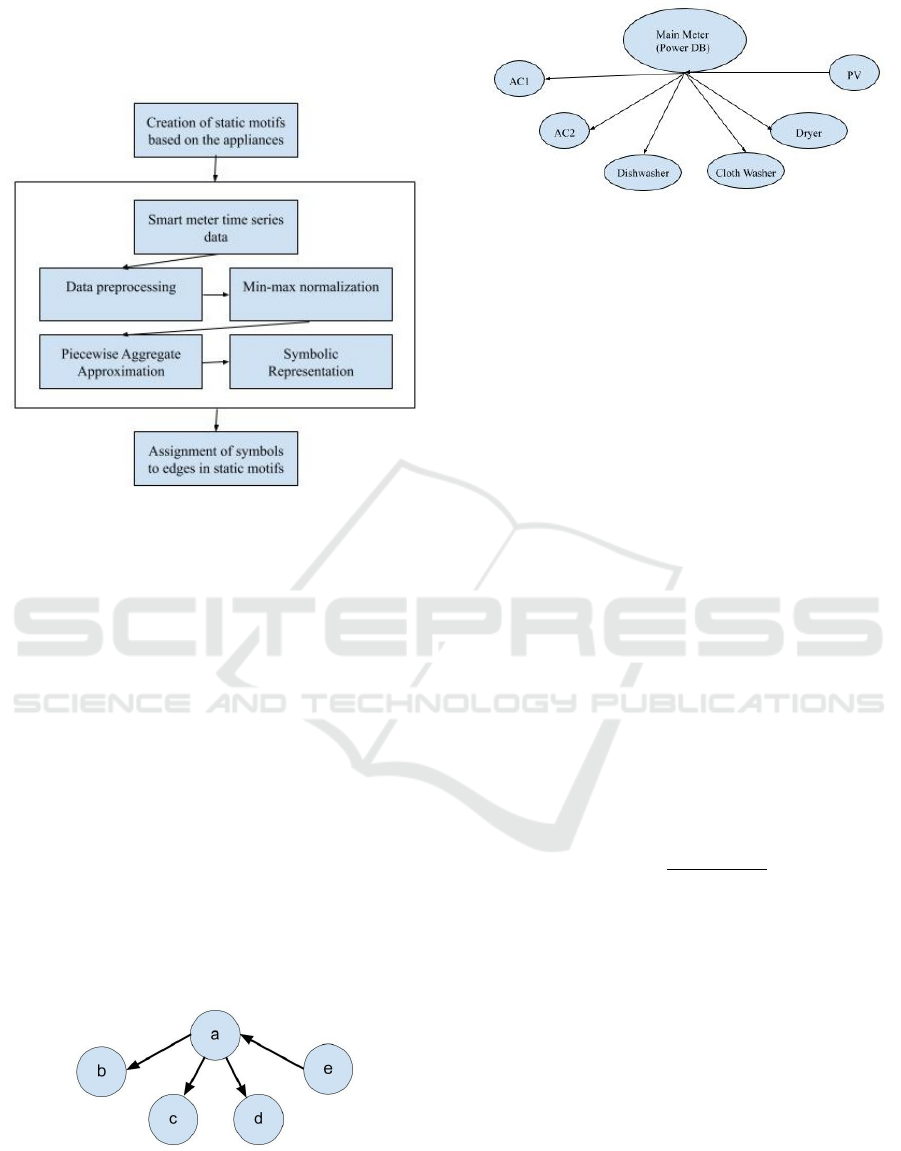
Figure 2: Overview of motif creation process for smart
grids.
Consider m
i
to be meter reading (total) at a given time
i. We consider a time series T = m
1
, m
2
, ..., m
t
. Each
m
i
consists of the values corresponding to internal dis-
tribution of energy among all the appliances utilizing
the energy at a given time i. Let A be the set of ap-
pliances. Let c
j
i
be the energy consumed by the j
th
appliance at time i. Therefore,
m
i
=
∑
j∈A
c
j
i
4.1 Motif Creation
A star motif is defined as a graph of k nodes in to-
tal, out which one node (the center node) has k − 1
neighbors, which is the center node while all the other
nodes have only one neighbor each. An example of
star motif is shown in Fig. 3.
Figure 3: Example of a star motif. There are 5 nodes in
total. One center node and four neighbors to the center
node. The direction of the edges between the center node
and the neighboring nodes depends on the relationship be-
tween them.
Figure 4: Example of a static star motif in a house.
We consider a particular consumer where there are
various appliances in a house that contribute to over-
all consumption of energy in the house. All of which
are essentially connected to the main smart meter. We
create a star motif of these appliances along with the
smart meter. Fig 4 shows a star motif within a house
where we consider the smart meter in the house to be
the center node and all the appliances to be the rest
of the nodes which are only connected to the center
node. The nodes for the appliances that draw energy
from the meter are represented using an edge from
meter (center node) to the appliance (corresponding
neighboring node). For any other equipment that gen-
erates energy (e.g. solar panel), the edge goes from
the equipment to the center node.
4.2 Symbolic Representation
1. Data Preprocessing and Min-max Normaliza-
tion. Time series data preprocessing is done to
normalize the data. We consider smart meter data
which keeps track of consumption of each of the
appliance. We perform min-max normalization so
that the values after normalization lies between
[0, 1]. The normalized value y, of a data point x, is
given by
y =
(x − min)
(max − min)
where min is the minimum and max is the maxi-
mum data value in the dataset.
2. Piecewise Aggregate Approximation. On the
normalized data, we apply Piecewise Aggregate
Approximation (PAA) to discretize the data. By
selecting the right parameters in PAA, it can be
altered to suit the needs of the application at hand.
The normalized time series data is divided into w
windows. The average of values in every window
is calculated.
3. Matching Symbols to Energy Levels. After
PAA, we represent the energy consumption of
each of the appliance with a symbol. Number
of energy levels and their corresponding symbols
is another parameter that can be set according to
SMARTGREENS 2020 - 9th International Conference on Smart Cities and Green ICT Systems
124
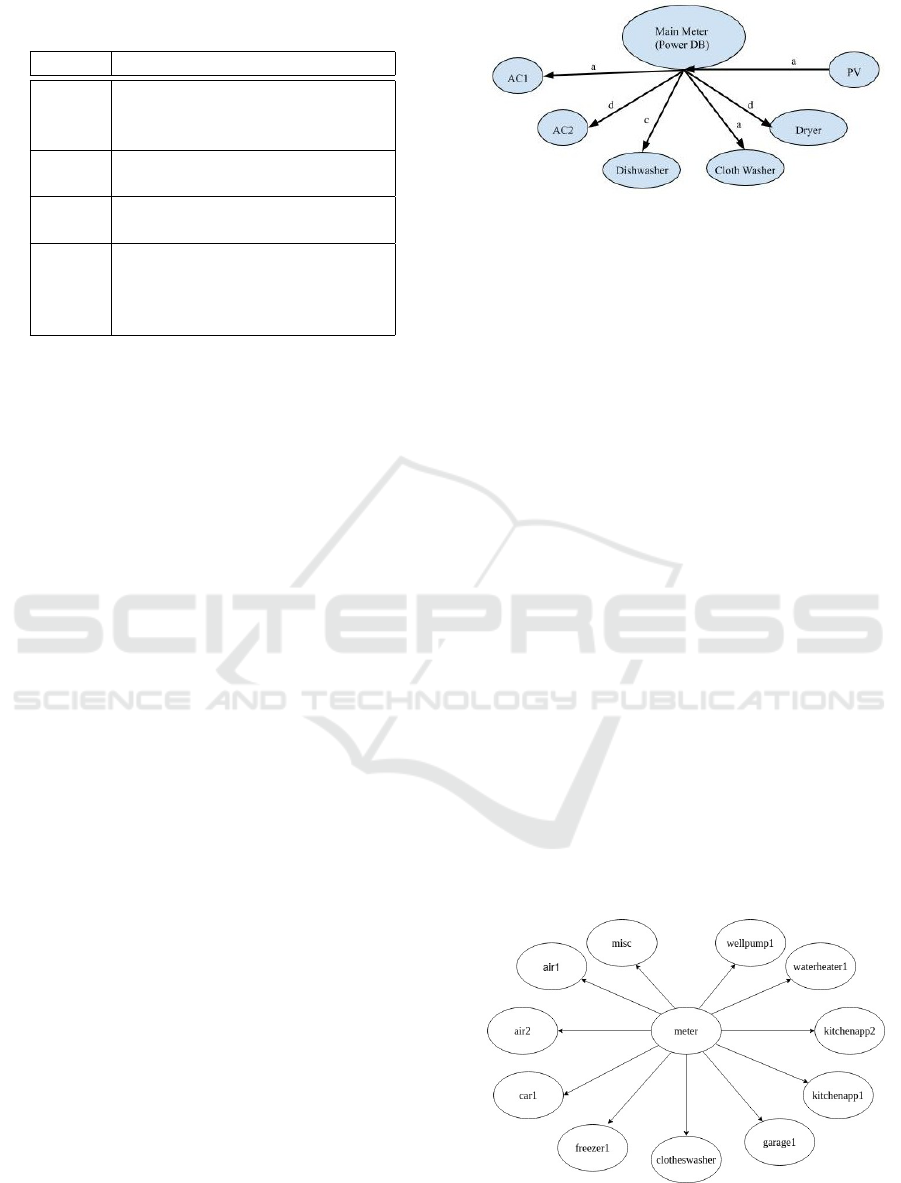
Table 1: Description of variables associated with a temporal
edge in smart grid.
Variable Description
u
Supplier of power (any appli-
ance that produces or supplies
power)
v
Consumer of power (any appli-
ance that consumes power)
t
w
Timestamp of the time window
corresponding to the edge
x
Symbol corresponding to the
level of energy consumption as-
signed to the edge n the given
window
use case. The symbol values represent the lev-
els of energy consumption over normalized data.
The data values range between 0 and 1, so we de-
cide on number of symbol to be used and range
of each of energy consumption corresponding to
each symbol. The number of energy levels vary
application to application.
4.3 Symbol Assignments to Edges of a
Motif
The edges in static motif that we created in first step,
for a house is assigned timestamps associated with the
time window in which we are determining the associ-
ated symbol. In the static motifs, edges are between
the main line and an appliance. The temporal edge
occurs in smart grid in the window in which an appli-
ance is turned on.
We define the temporal edge for grid network
as quadruple represented as (u, v, t
w
, x). Table 1 de-
scribes each component of the quadruple. We perform
the operations described in the previous steps on the
data, to get the symbols associated for each of the ap-
pliance in the same set of time windows. Then, for a
particular window, consider all the appliances along
with meter as nodes, while the energy production and
consumption among appliances determine the direc-
tions between the edges and the level of energy con-
sumption is given by the symbol associated with the
edge. The time window is in which we are determin-
ing the consumption level is given by the timestamp
corresponding to the time window.
The complete data of consumption in a grid can
be represented as the collection of the temporal edges
we defined earlier.
Figure 5: Example of star motif in a house.
4.4 Temporal Motifs for Electric Grid
Network
As shown in Fig. 5, along with assignments of sym-
bols to the edges in static motif, note that this motif
structure occurs in a particular time duration, since
each of the symbols assigned to the edges represent
the level of consumption in a particular time period.
The motif helps us to look at the consumption and dis-
tribution of energy among all appliances in a time slot
in a house. The collection of such motifs over a time
windows of size δ is defined to be a temporal motif
for energy consumption data.
5 CASE STUDY
We take an example to demonstrate the steps to cre-
ate Temporal Motifs in Smart Grid network. We take
a part of Pecan Street Dataport (Dataport, ) from 15
minute dataset. We consider a house with data-id 27,
which is located at New York. For this house, we
consider the consumption values for the time period
04:00:00 to 07.00.00 on 2019-05-01.
5.1 Motif Creation
Figure 6: Static Motif for house ID 27.
The underlying star motif for this house ID is shown
Temporal Motifs in Smart Grid
125
in Fig.6. This is derived based on the appliances used
in the house.
5.2 Symbolic Representation
1. Data Preprocesssing and Min-max Normaliza-
tion. Preprocessing and min-max normalization
of data is done according to formulas mentioned
in Section 1 to get the normalized data.
2. Piecewise Aggregate Approximation. Since the
data has a duration of 3 hours, with windows size
of 1 hour, the number of windows w = 3. For any
given time window there is a value attached to it
which is average of the values corresponding to
the timestamps in the window.
3. Matching Symbols to Energy Levels. We con-
sider 4 symbols a, b, c and d, they correspond to
four consumption levels. Very low consumption
is represented by a symbol a, b represents aver-
age energy consumption, c represents more than
average consumption of energy while very high
energy consumption is represented by symbol d.
We define the range for each of the symbols as
shown in Table.2.
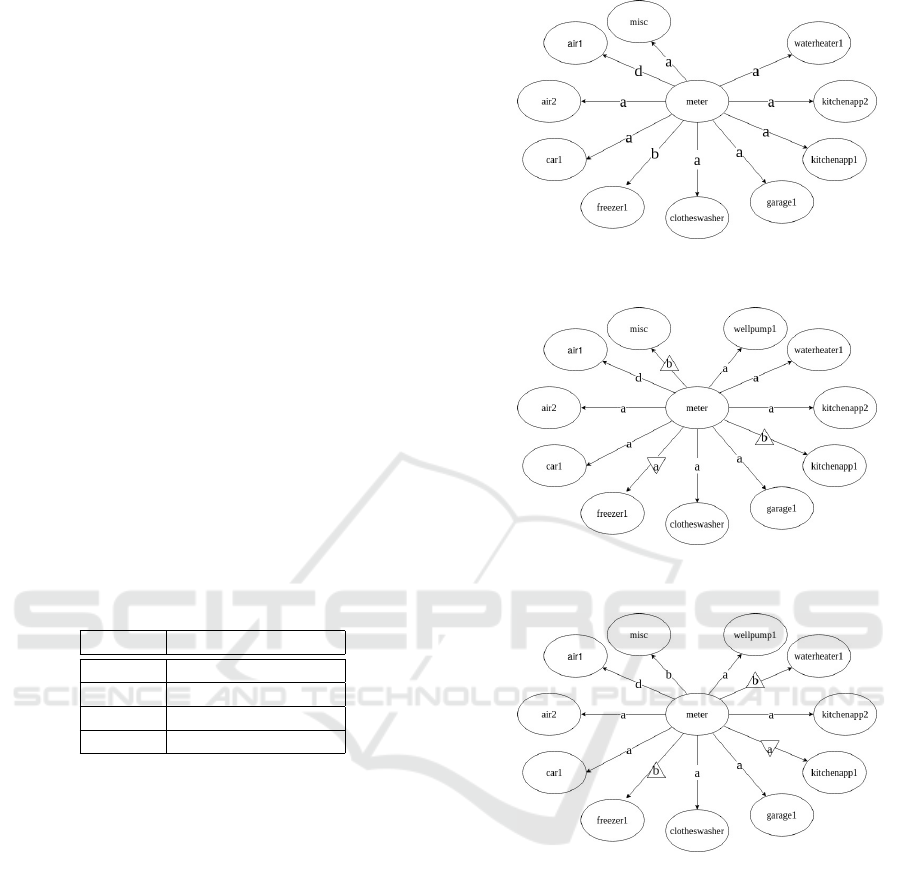
Table 2: Range for each of the symbols.
Symbol Range
a 0 ≤ value < 0.25
b 0.25 ≤ value < 0.5
c 0.5 ≤ value < 0.75
d 0.75 ≤ value ≤ 1
5.3 Symbol Assignments to Edges of a
Motif
Each edge in the static motif created in Section 5.1
has a symbol that corresponds to the average of the
values of consumption on each edge in a window. The
symbols are assigned to the edges. An example of a
motif in House ID 27 for time window labelled t
1
for
duration on 1 hour is shown in Fig.7a.
5.4 Temporal Motifs for Electric Grid
Network
A sequence of motifs created in Section 5.3 may have
different symbols associated with their edges in dif-
ferent time windows, since the energy consumption
varies over time. Such a sequence is the temporal mo-
tif in a smart grid network. The final temporal motif
with 3 time windows is shown in Fig.7. Increase in
(a) Motif at time t
1
.
(b) Motif at time t
2
.
(c) Motif at time t
3
.
Figure 7: Temporal Motifs in Smart Grid network.
consumption level is indicated by symbols inside up-
ward pointing triangles, whereas the decrease in con-
sumption is indicated by symbols inside triangles fac-
ing downward in the temporal motifs.
6 DISCUSSION
Overlapping Temporal Motifs
While we only consider the window for finding the
symbols associated with edges to be non-overlapping,
other possibilities to be considered are overlapping
window and the absolute consumption values. Con-
SMARTGREENS 2020 - 9th International Conference on Smart Cities and Green ICT Systems
126

sidering absolute values is too specific because the
consumption of energy on one day may not be exactly
the same as that on the next day. Hence assigning
symbols based on absolute values at a given time may
not help infer anything useful about the data. In a time
period, if the average data consumption is considered
then it gives the approximate consumption level of the
appliance.
Overlapping window can be considered if it is
needed for the application under consideration. We
slide the window over the time duration with some
predetermined time overlapping in two consecutive
windows. This would help in maintaining the infor-
mation related to continuity of the data to some extent
depending on how much the overlap is.
Fitting Temporal Motifs Into Smart Grid
Hierarchy
We propose this model for residential type of local-
ity. This is easily scalable to other types of localities
as well, such as industrial, commercial etc and can be
extended to fit other hierarchical levels in the smart
grid as well as other complex networks. To study the
role that these motifs play in smart grid network, it
is essential that we consider the hierarchy of the par-
ticipants of the network. The hierarchy described in
(Rech and Harth, 2012) is discussed below to suit for
the requirement of our model.
• The very basic level in the hierarchy consists of
the appliances in a household. As discussed ear-
lier the motifs which are formed at this layer are
based on electricity consumption of each of the
appliances at various times.
• The layer above the layer of appliances is of
houses in a locality or a community residing at a
particular location. The motifs would consist of
the houses in the locality and the point of sup-
ply of electricity to all these houses as nodes.
The consumption of each of the houses at various
times would determine the edges and the direction
of the edges. These motifs can be defined in sim-
ilar fashion as we did earlier by determining the
suitable parameter values.
• Similarly, the next layer consists of communities
which together form a city.
• More layers can be thought of and considered on
top of the previously mentioned layers so as to
build the model of motifs that will help enable us
to study and determine various aspects of a smart
grid network.
7 CONCLUSION
Temporal motifs play an important role in characteriz-
ing networks. The change in usage of power over time
helps to study the behaviour of the consumers. We
have formally defined the Temporal Motifs in Smart
Grid network. We have also described the construc-
tion of such Temporal Motifs in Smart Grid network,
without overlapping windows, how to fit them in the
hierarchical structure of the network. In future we
will use motifs to draw inferences about participants
of the grid network. We will also look at impact of
this model on the energy distribution policies.
ACKNOWLEDGEMENTS
This research was partially supported by
NRDMS/UG/S.Mishra/Odisha/E-01/2018
REFERENCES
Aggarwal, A., Kunta, S., and Verma, P. K. (2010). A
proposed communications infrastructure for the smart
grid. In 2010 Innovative Smart Grid Technologies
(ISGT), pages 1–5, Gaithersburg, MD, USA. IEEE.
Dataport. https://dataport.pecanstreet.org/. Pecan Street
Inc. Dataport, accessed on 24 January 2020.
Funde, N., Dhabu, M., and Balande, U. (2018). Motif-
Based Pattern Detection Method for Smart Energy
Meter Data. In 2018 3rd International Conference for
Convergence in Technology (I2CT), pages 1–5, Pune.
IEEE.
Lin, J., Keogh, E., Lonardi, S., and Chiu, B. (2003). A sym-
bolic representation of time series, with implications
for streaming algorithms. In Proceedings of the 8th
ACM SIGMOD Workshop on Research Issues in Data
Mining and Knowledge Discovery, DMKD ’03, page
2–11, New York, NY, USA. Association for Comput-
ing Machinery.
Milo, R., Shen-Orr, S., Itzkovitz, S., Kashtan, N.,
Chklovskii, D., and Alon, U. (2002). Network Mo-
tifs: Simple Building Blocks of Complex Networks.
Science, 298(5594):824–827.
Mishra, S., Li, X., Pan, T., Kuhnle, A., Thai, M. T., and Seo,
J. (2016). Price modification attack and protection
scheme in smart grid. IEEE Transactions on Smart
Grid, 8(4):1864–1875.
Paranjape, A., Benson, A. R., and Leskovec, J. (2017). Mo-
tifs in temporal networks. Proceedings of the Tenth
ACM International Conference on Web Search and
Data Mining - WSDM ’17.
Rech, D. and Harth, A. (2012). Towards a decentralised hi-
erarchical architecture for smart grids. In Proceedings
of the 2012 Joint EDBT/ICDT Workshops on - EDBT-
ICDT ’12, page 111, Berlin, Germany. ACM Press.
Temporal Motifs in Smart Grid
127
