
Early Dyslexia Evidences using Speech Features
Fernanda M. Ribeiro
1 a
, Alvaro R. Pereira Jr.
1 b
, D
´
ebora M. Barroso Paiva
2 c
,
Luciana M. Alves
3 d
and Andrea G. Campos Bianchi
1 e
1
Computing Department, Federal University of Ouro Preto, Ouro Preto, Brazil
2
School of Computing, Federal University of Mato do Grosso do Sul, Campo Grande, Brazil
3
Fonoaudiology Department, Federal University of Minas Gerais, Belo Horizonte, Brazil
Keywords:
Signal Processing, Features, Mel Cepstral Frequencies, Supervised Learning, Decision Making System.
Abstract:
The pathologies of the language are alterations in the reading of a text caused by traumatisms. Many people
go untreated due to the lack of specific tools and the high cost of using proprietary software, however, new
audio signal processing technologies can aid in the process of identifying genetic pathologies. In the past, a
methodology was developed by medical specialists, which extracts characteristics from the reading of a text
aloud and returns evidence of dyslexia. In this work, a new computational approach is described in order to
automate serving as a tool for dyslexia indication efficiently. The analysis is done in recordings of the reading
of pre-defined texts with school-age children, being extracted characteristics using specific methodologies.
The indication of the probability of dyslexia is performed using a machine learning algorithm. The tests
were performed comparing with the classification performed by the specialist, obtaining high accuracy on the
evidence of dyslexia. The difference between the values of the automatically collected characteristics and the
manually assigned was below 20% for most of the characteristics. Finally, the results show a very promising
area for audio signal processing with respect to the aid to specialists in the decision making related to language
pathologies.
1 INTRODUCTION
One of the pathologies of the language rarely ad-
dressed in underdeveloped countries by professionals
is dyslexia, mainly due to the high time required for
its evaluation. It requires a lot of research involving
several professionals and, mostly, because the diagno-
sis is only a probability analysis, as described in the
approach developed by Alves (Alves, 2007).
Dyslexia is a disease caused by malformation or
interruption of the brain connectors that connect the
anterior and posterior areas of the brain (Deuschle and
Cechella, 2009; Leon et al., 2012). In dyslexia, the
person feels learning and reading difficulties, which
is quite evident in the oral reading of a text, i.e., the
person feels difficulty in understanding and emitting
the various sounds of a word (Shaywitz, 2006) (but
a
https://orcid.org/0000-0002-7524-2835
b
https://orcid.org/0000-0003-3371-9997
c
https://orcid.org/0000-0002-1152-6062
d
https://orcid.org/0000-0002-6403-4117
e
https://orcid.org/0000-0001-7949-1188
has no physical anomaly), influencing strongly in the
learning process of a child in training.
During the identification of the pathology, it is
necessary to interact not only with the speech ther-
apist but also with the psychology and the neurologist
professionals. Each specialist has its analysis method-
ology, but the diagnosis is only concluded after con-
firmation by all specialists.
The rapid identification of this pathology provides
the child with a better quality of school life and, pos-
sibly, improvement in his evolution as a whole. Thus,
many specialists are looking for methods that accel-
erate and/or facilitate the identification of this pathol-
ogy.
There are several studies on the processing of au-
dio signals for different applications but mainly for
the indication of physical pathologies (Drigas and
Politi-Georgousi, 2019; Marinus et al., 2009; Santos,
2013; Zavaleta et al., 2012). Regarding digital signal
processing, most methods use methodologies related
to signal winding and the extraction of characteristics
in the domain of time and frequency, for example, the
Hidden Markov Models (HMM) (Leon et al., 2012)
640
Ribeiro, F., Pereira Jr., A., Paiva, D., Alves, L. and Bianchi, A.
Early Dyslexia Evidences using Speech Features.
DOI: 10.5220/0009574906400647
In Proceedings of the 22nd International Conference on Enterprise Information Systems (ICEIS 2020) - Volume 1, pages 640-647
ISBN: 978-989-758-423-7
Copyright
c
2020 by SCITEPRESS – Science and Technology Publications, Lda. All rights reserved

and the Virtebi algorithm (Cano et al., 1999).
Although audio processing is applied in several ar-
eas, there are few works in detecting pathologies of
language and voice. Marinus et al. (Marinus et al.,
2009) use methods of analysis of voice pathologies
based on the Mel frequency cepstral coefficients to
represent the signals of voice audios and Multilayer
Neural Networks for the classification between nor-
mal voice, voice affected by edema and voice affected
by other pathologies.
Considering the articulatory disorder, we can cite
the research developed by Santos (Santos, 2013),
which proposed a mobile application that analyzes the
patient with Dyslalia and presents its evolution over
time, helping the professional and offering measures
of the pathology level.
On the other hand, linguistic pathologies affect the
reading and writing of a text and cause difficulties in
interpreting and representing the syntactic and mor-
phological part of a readable text. About dyslexia, we
can cite the work of Zavaleta et al. (Zavaleta et al.,
2012) that proposes a technological tool to support the
diagnosis of dyslexia. The authors collect response
data on a specific questionnaire, related to factors in-
dicative of the pathology, with questions about how
are the reading, diseases, and pathological problems
that exist in the family. In the audio responses, a neu-
ral network is applied and, through decision-making
metrics, a classification is performed considering two
groups, with or without dyslexia. The results were
not completely accurate because four patients with
dyslexia were diagnosed without dyslexia.
There are also numerous computational propos-
als for early detection of dyslexia (Drigas and Politi-
Georgousi, 2019; Al-Barhamtoshy and Motaweh,
2017; Prabha and Bhargavi, 2019), including games
(Van den Audenaeren et al., 2013) and mobile apps
(Abu Zarim, 2016; Geurts et al., 2015); and there
are also systems that support the treatment and evo-
lution of the disease (Alghabban et al., 2017; Sidhu
and Manzura, 2011; Rahman et al., 2018).
This article proposes the use of audio signal digi-
tal processing and machine learning techniques to de-
limit and model characteristics present in the reading
audio of dyslexic individuals, proposing a solution to
automate the identification and indication of dyslexia
based on audios of readings aloud. The measures ob-
tained from the audio processing make it possible to
indicate this pathology so that the proposal aims to
support and make the preliminary evidence of patients
with dyslexia more reliable. Then, the patient can go
to other professionals and be appropriately treated.
Although Zavaleta et al. (Zavaleta et al., 2012) per-
form the identification of dyslexia using measures re-
lated to audio, our proposal is more generic and inde-
pendent of questionnaires.
This paper is organized as follows: in Section 2
we present the background; in Section 3 we present
our computational methodology; in Section 4 we de-
scribe the experiments; in Section 5 we discuss the
experimental results and in Section 6 we present the
final remarks.
2 MEDICAL APPROACH TO
DYSLEXIA IDENTIFICATION
The voice is defined as the sound signal emitted by the
vocal folds and the movement of the larynx (Behlau,
2001). Speech, in turn, is the articulatory sound pro-
duced by several vocal muscles. Language is the pro-
duction of sound emitted based on the understanding
of what was read, seeking to represent a thought or
an idea, as stated by Prates and Martins (Prates and
Martins, 2011).
When there is a dysfunction in the emission of
voice, language and/or speech, the patient has some
pathology, which may have physical causes (Gusso
and Lopes, 2012) or neurological causes such as
dyslexia and stuttering. Linguistic pathologies affect
the reading and writing of a text, leading to difficul-
ties in interpreting and representing the syntactic and
morphological part of a reading text.
Alves (Alves, 2007) believes the previous discov-
ery of dyslexia through phonetic characteristics ex-
tracted from reading aloud. In his work, a collec-
tion of audios of readings aloud of a specific text is
made with children from the clinical (with dyslexia)
and non-clinical (without dyslexia) group, and such
phonetic measures allowed the creation of a model for
identifying the evidence for dyslexia. The methodol-
ogy used is based on manual analysis of characteris-
tics extracted from the audio, to classify individuals
with or without the pathology.
It was also noticed that the group of young peo-
ple who had speech therapy treatment presented better
temporal and prosodic characteristics than the group
without treatment, but still out of expectations when
compared to the subjects in the control group (without
language and learning changes). The prosodic char-
acteristics refer to the intonation, the formants, and
the frequencies of the audio signal, while the tem-
poral characteristics refer to the audio reproduction
time, such as the total audio duration and the articu-
lated audio time directly without pauses. The acoustic
characteristics extracted manually from the audio are
the number of syllables (QS), the number of pauses
(QP), and the total time of pauses (T T P).
Early Dyslexia Evidences using Speech Features
641

After these measures, it was calculated the speech
(T T E) and articulation (T TA) times, and the speech
(T E) and articulation (TA) rates. The speaking time
(T T E) is the total time spent (in seconds) by the
reader to read the text aloud. The articulation time
(T TA) is the total time of the spoken audio signal
without pauses, also in seconds. The speech rates
(T E) and articulation (TA) are related to the num-
ber of syllables emitted per second, according to the
speech and articulation times, respectively.
According to Alves (Alves, 2007) and Brezntiz
and Leikin (Breznitz and Leikin, 2001) these mea-
sures indicate the level of difficulty of prosodic in-
terpretation in reading a text, and patients with a high
probability of dyslexia, in general present higher val-
ues (QP, QS, T T E, T TA, T T P) or lower (TA, T E,
Tess) than is expected according to the read text, ob-
served from the non-clinical group. For example,
in their work, the clinical group (with dyslexia) pre-
sented QP and T T P with high values, which demon-
strate a longer time for interpretation and textual se-
quence. The higher value of QS is due to the tendency
to keep repeating the previous syllable while trying to
read the next syllable, demonstrating the difficulty of
visualization and interpretation as a whole.
Alves (Alves, 2007) analyzes all the data and stan-
dardizes the values through the verification carried
out concerning a control group, without a systematic
methodology of the final analysis. It was checked
which data is above or below the expected value,
seeking to characterize the dyslexia pathology on an
aspect not yet described in the literature.
3 COMPUTATIONAL
METHODOLOGY
Section 2 presented a proposal for the identification
of patients with dyslexia based on the audio analy-
sis of texts read aloud. However, the most signifi-
cant difficulty was the time to analyze each patient
and the researcher’s tiredness to collect and measure
the characteristics, which were done manually. Figure
1 shows the flowchart of the automatic methodology
proposed in this article for solving the problem using
signal analysis for the extraction of characteristics and
machine learning for the classification of evidence of
dyslexia.
Figure 1: Audio signal processing methodology.
The audio of texts read aloud for each child is used
as the input signal. We perform a pre-processing,
and from this result, the characteristics (QP, QS,
T T E, T TA, T T P, TA, T E) are extracted, obtained
directly from the audio signal. These characteristics
are grouped using a classification method and an indi-
cation of the evidence of dyslexia. The analyses used
in each of the stages of the proposed methodology are
described in detail in the next sub-sections.
3.1 Pre-processing of Audio Files
For the audios in the database, noise filtering is nec-
essary due to the environment in which they were
recorded. Two types of filters on the database were
applied, high pass and low pass. The input signal is
transformed into the frequency space using the FFT
(Fast Fourier Transform). After this calculation, low-
pass and high-pass filters are applied, filters that elim-
inate high and low-frequency noise.
The Inverse Fourier Transform (IFFT) is applied
to this result, which returns the filtered signal to the
time domain.
3.2 Feature Extraction
Once the audio signal has pre-processing to eliminate
noise, the next step is to extract the characteristics of
the signal by identifying and segmenting pauses and
syllables, i.e., identifying voice and non-voice along
with the audio.
3.2.1 Pause Segmentation
Firstly, it was established to measure in the audio the
number of pauses (QP) and the total time of these
pauses (T T P), without considering the pause at the
beginning and end of the audio signal. Figure 2
presents a flowchart of the algorithm used, which is
based on the work of Barbedo et al. (Barbedo and
Lopes, 2007).
Once the audio signal was pre-processed, the sig-
nal winding is made using Hamming windowing of
size w
s
. Two characteristics are extracted from each
window: Power Spectrum E and Spectral Centroid C,
both measured from the frequency domain, which is
obtained using the Discrete Fourier Transform (DFT)
of the signal. The Spectral Centroid is a central av-
erage about the frequencies of the audio signal in
each Hamming window, performing the location of
the maximum and minimum frequencies peaks. The
power spectrum of the signal is an average of the sig-
nal amplitude.
ICEIS 2020 - 22nd International Conference on Enterprise Information Systems
642
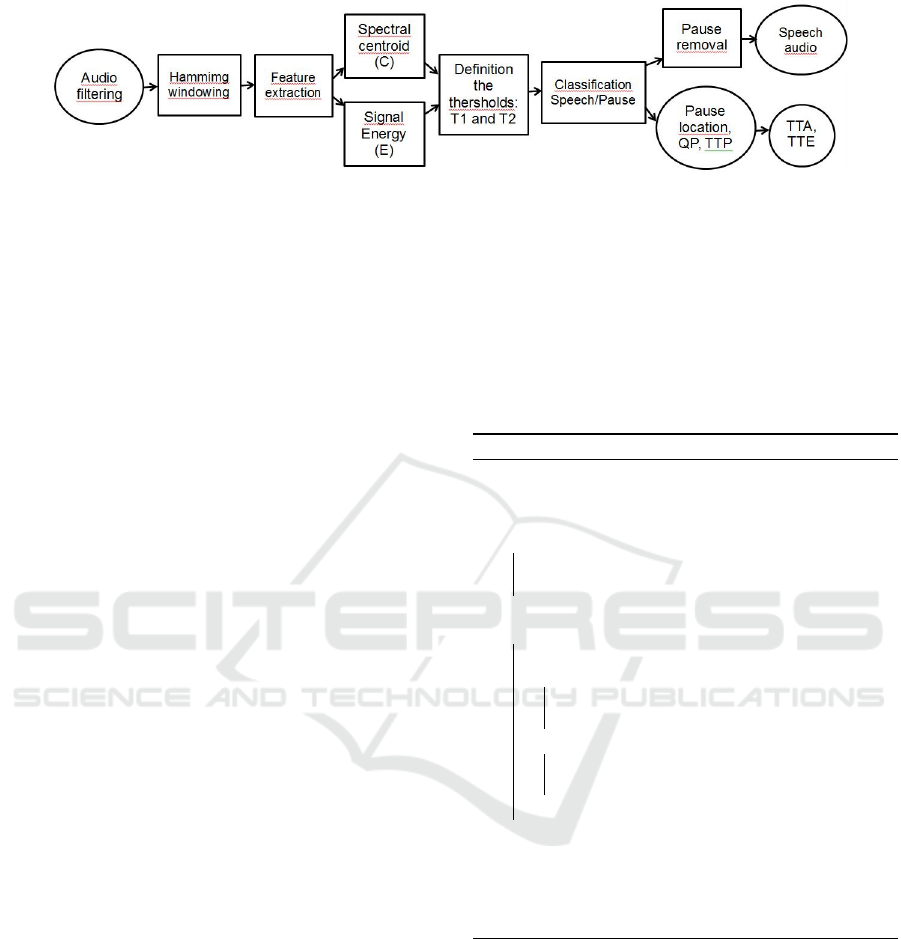
Figure 2: Flowchart of the extraction process of direct characteristics.
From the data obtained in each window, a his-
togram is generated for the two characteristics, En-
ergy and Spectral centroid, extracting respectively
their local maximum (T p1 and T p2) to be used as
thresholds in the Hamming window. The cut-off
thresholds for pause and voice are defined from these
values, respectively.
After defining the thresholds considering the en-
tire audio, an analysis is performed on signal seg-
ments to identify the pauses. From a fixed size win-
dow (w
s
) with jumps (sp) the audio signal is traversed,
and the characteristics mentioned above are extracted.
Each value found per window is compared with the
values of defined thresholds T p1 and T p2, signs with
speech reach values above the cut threshold T p2, be-
ing classified as 1 and pauses the values below the cut
threshold T p1, classified as 0.
The result of the pauses identification allows to
return the number of pauses (QP) by counting the ze-
ros obtained, the total time of the pauses (T T P) by
the sum of the duration of each identified pause, the
total articulation time (T TA) and the total speaking
time (T T E). These values will be used later as input
into the syllabic separation methodology. More de-
tails can be obtained at Barbedo et al. (Barbedo and
Lopes, 2007).
3.2.2 Syllabic Segmentation
Once the uninterrupted audio signal was obtained in
Section 3.2.1, segmentation into syllables is repre-
sented not only by grammatical separation but also by
the emission of phonemes. Based on existing works
(Silva and Oliveira, 2012) we can measure the num-
ber of syllables (QS). The original methodology was
adapted so that it was possible to obtain a syntac-
tic separator and the measure of (QS) on a text and
not just on words, as suggested by Silva and Oliveira
(Silva and Oliveira, 2012).
The audio without pauses is transformed through
the half wave signal rectification function, which con-
verts the audio signal into a positive signal, as ex-
emplified in Silva and Oliveira (Silva and Oliveira,
2012), making the audio continuous and based on the
positive frequencies of the signal.
In Algorithm 1 we present the main structure of
the code, where the audio signal is segmented into N
windows of Hamming with size (w
s
). In each window,
it is extracted the Mel frequency cepstral coefficient
(MFCC) - frequency and amplitude (Brognaux and
Drugman, 2016), and for each segment, the cut-off
threshold is obtained by the average of the variation
of the characteristics extracted from each window.
Algorithm 1: Syllabic Segmentation.
Input: audio, TTE, TTA
w
i
← SignalFrames(hamming);
n ← 0;
for i ← 1 to w do
ENV
i
← Features w
i
(MFCC)
T s
i
← AverageVariation(ENV
i
)
end
while n <= N do
n ← n + 1;
if T s
i
> Env
i
then
Syllable;
V B(N) ← 1;
else
Not syllable
V B(N) ← 0;
end
end
QS ← CalculateQS(V B)
T E ← T T E/QS
TA ← T TA/QS
return QS,T E, TA
In Algorithm 1, we can see the final classification
within the condition “while”, where the audio signal
is traversed, comparing each window value (ENV )
that represents the characteristics by segment. If any
value is found below the cut-off threshold, it is clas-
sified as one and zero, otherwise, forming a binary
vector of data, 1 symbolizing syllables and 0 not syl-
lables. Then the final count of the syllable is carried
out through a grouping on values equal to 1, which
symbolize a part of a syllable, where every 0 is con-
sidered the end of a syllable unit. From this grouping,
a vector is returned with its position and the number
Early Dyslexia Evidences using Speech Features
643

of samples, which contains each syllable, thus count-
ing the number of syllables (QS).
Considering these data, the metrics of TA and T E
are calculated. The values of these variables are used
to define the probability of dyslexia. These rates sug-
gest domain over language and general diction, so
minimal small values indicate a higher likelihood of
dyslexia.
4 COMPUTATIONAL
EXPERIMENTS
The database used is the same as Alves (Alves et al.,
2009) obtained through the base text O Tatu Encab-
ulado, in Portuguese. The experiments were assem-
bled from recordings of the reading audio aloud of
school children. Of the total of 40 records, 10 (ten) are
from children diagnosed with dyslexia, called clin-
ical group (CG) and 30 (thirty) without dyslexia or
language changes, called non-clinical group (NCG),
varying between school grades, 3rd to 6th year, be-
tween 9 and 14 years old, male and female.
As the pause and syllable algorithm depends on
some parameters, validation was performed using
four audio signals, so that the database was divided
between training and testing (90%) and validation
(10%), ensuring GC and NCG in all samples. Thus,
the values of the parameters should maximize the
agreement between the results obtained automatically
for the proposed methodology, and those derived from
the manual annotation in the validation base, done by
specialists.
The validation step consists of a set of experi-
ments to obtain the optimal values of the T p1, T p2,
and w
s
parameters. They are varied, and the proposed
methodology is used to calculate values for QP, T T P,
and QS variables. The parameters are chosen when
the variables are closest to the specialist results.
After validation, the testing phase uses the param-
eters to obtain results of QP, T T P, QS, T T E, T TA,
TA, and T E using testing audios. The results were
compared with the manual annotation made by spe-
cialists. The comparison metric is the absolute differ-
ence between the automatic value found by the pro-
posed methodology and the manual annotation — the
smaller the difference, the better the similarity be-
tween the data.
Since the data are similar, the automatic values
will be used as features for classification algorithms
based on supervised learning. The classification al-
lows identifying which category the data belongs
based on a training set. There are a large number of al-
gorithms for classification, and the one that returned
higher predicted class was Support Vector Machine
using a Gaussian kernel.
The entire methodology was developed using
Matlab
2
, a mathematical analysis and programming
tool, using predefined signal processing functions of
audio.
5 RESULTS
One of the essential steps related to the results is the
adjustment of the parameters, T p1, and T p2 for pause
segmentation and w
s
for syllable segmentation, called
validation. As mentioned before, it was made empir-
ically with the variation of the parameter values and
the calculation of T T P, QP, and QS variables. For
each one, the absolute difference between the values
automatically calculated with the one provided man-
ually by the specialist is calculated and used for com-
parison.
It is important to notice that we have a problem of
minimizing multiple variables, which is challenging
to solve and which solutions allow different heuris-
tics. The proposed solution is to vary the set of pa-
rameters and find the values that minimize the differ-
ence between real and automatic values for the vari-
ables QP, T T P, and QS. Differences closer to zero
represent more similar results.
5.1 Parameter Estimation
As mentioned, the identification of pauses is based
on the Hamming window, which was fixed w
s
equal
to 0.13ms and jump size sp of 0.04ms. These values
were obtained after a sequence of tests that resulted in
less loss of information about each fragment. Table 1
presents the results of the absolute difference between
the automatic values of T T P found by the proposed
methodology and the manual annotation for variation
of parameters T p1 and T p2. The best results for T p1
are between 0.11 and 0.15ms, and for T p2 between
0.02 and 0.1ms. The results were separated into clin-
ical (CG) and non-clinical groups (NCG).
Table 2 presents the results of the absolute differ-
ence between the automatic values of QP found by
the proposed methodology and the manual annotation
for variation of parameters T p1 and T p2.
After delimiting the parameters of the segmenta-
tion of pauses, we continue to determine QP through
the segmentation of syllables. Considering the vari-
ation of parameters delimited above, we used the 1
algorithm and obtained the values of QS for different
2
http://www.mathworks.com/products/matlab/
ICEIS 2020 - 22nd International Conference on Enterprise Information Systems
644
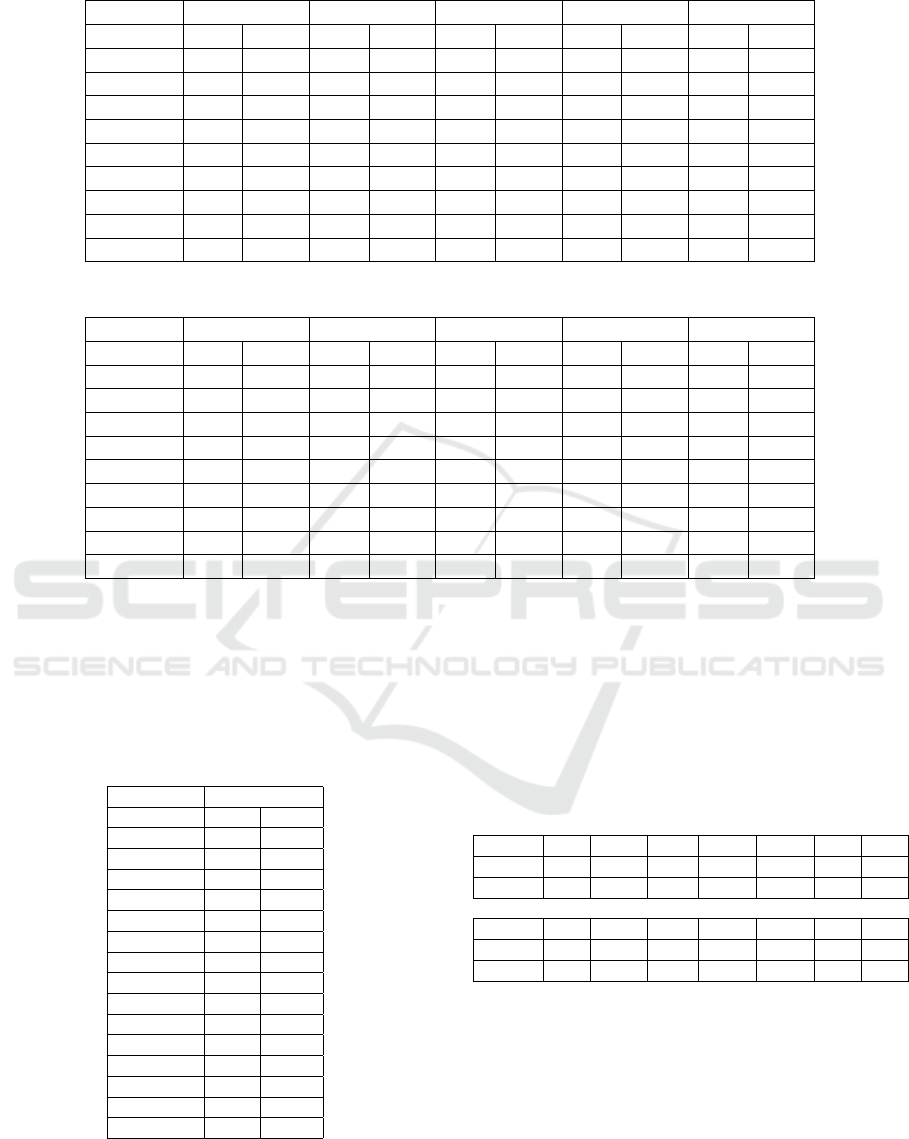
Table 1: Absolute difference for manual and automatic T T P values.
T p1(ms) 0.11 0.12 0.13 0.14 0.15
T p2(ms) GC NCG GC NCG GC NCG GC NCG GC NCG
0.02 12.7 2.2 4.2 2.3 13.2 2.5 9.9 2.4 19.0 1.5
0.03 20.6 5.0 8.6 9.6 29.8 12.1 9.8 9.1 21.2 11.4
0.04 17.0 2.0 13.1 2.3 14.2 1.8 11.8 2.0 14.0 3.1
0.05 11.7 1.5 12.7 1.4 13.7 1.7 14.0 1.9 13.8 3.3
0.06 12.3 2.3 13.3 1.6 12.2 1.8 14.1 3.7 13.7 3.8
0.07 13.3 1.8 13.8 1.5 17.1 2.8 16.4 2.3 14.0 2.3
0.08 12.9 1.2 13.5 1.6 15.3 2.1 12.0 2.9 10.6 4.8
0.09 9.5 3.3 9.5 3.3 9.5 3.3 26.9 2.0 26.9 2.0
0.1 15.3 2.5 15.3 2.5 15.3 2.5 4.2 2.3 4.2 2.3
Table 2: Absolute difference for manual and automatic QP values.
T p1(ms) 0.11 0.12 0.13 0.14 0.15
T p2(ms) GC NCG GC NCG GC NCG GC NCG GC NCG
0.02 36.0 8.5 33.5 9.5 21.5 1.5 37.0 7.0 46.0 34.5
0.03 96.5 12.0 74.5 15.0 97.0 15.0 76.5 14.5 98.5 15.0
0.04 10.0 0.5 10.0 1.5 9.0 1.5 5.5 1.5 7.0 2.5
0.05 2.0 2.0 3.0 2.0 1.0 3.0 3.0 3.0 3.0 3.5
0.06 1.0 5.0 3.0 4.0 4.5 4.0 5.5 7.5 5.5 7.5
0.07 7.5 5.5 6.0 5.0 6.5 5.0 8.5 5.0 6.0 6.0
0.08 11.0 5.5 10.0 6.0 12.0 7.0 11.0 9.0 11.0 9,0
0.09 19.0 10.0 19.0 10.0 19.0 10.0 38.0 8.5 38.0 8.5
0.1 32.0 10.0 32.0 10.0 32.0 10.0 33.5 9.5 33.5 9.5
values of w
s
. In this experiment the size of the w
s
win-
dow was varied from 16 ms to 30 ms. Table 3 presents
the results of the absolute difference between the val-
ues of QS manual and automatic for the variation of
the parameter T s.
Table 3: Absolute difference for manual and automatic QS
values.
Parameter Mean value
w
s
(ms) GC NCG
16 24.0 26.5
17 25.0 24.0
18 25.0 24.0
19 28.5 22.0
20 29.5 20.5
21 30.5 17.5
22 31.0 15.5
23 34.5 14.5
24 33.5 15.0
25 35.5 15.0
26 39.0 12.0
27 39.0 11.5
28 42.0 11.5
29 45.0 11.5
30 46.0 12.0
From the parameter variations, optimal values
were chosen for T p1 = 0.13, T p2 = 0.04 and w
s
=
20ms. Tables 4 show the results obtained for QP,
QS, T T P, T T E, T TA, TA and T E, on the audios that
were used in the validation process. Table presents
the manual value obtained by the specialist cite
Alves2007 and the result of the automatic proposed
methodology.
Table 4: Comparison for manual and automatic values of
features.
Values by manual annotation for (Alves et al., 2009)
Audio QP TTP QS TTE TTA TE TA
1 28 13.2 145 53.6 40.5 2.7 3.6
2 40 17.9 173 73.6 55.8 2.3 3.1
Values obtained using automatic proposed methodology
Audio QP TTP QS TTE TTA TE TA
1 27 15.6 169 52.3 36.7 3.2 4.6
2 39 19.5 165 72.8 53.3 2.3 3.1
5.2 Testing Phase
After setting parameters, tests were performed with
the rest of the audios. Figures 3 and 4 present a graph
with the mean values and standard deviation of the
absolute differences over all variables. The variables
results variables showed to be close to the values ob-
tained in the research of (Alves, 2007). However, the
results of QP and QS, Figure 4, have higher mean
Early Dyslexia Evidences using Speech Features
645
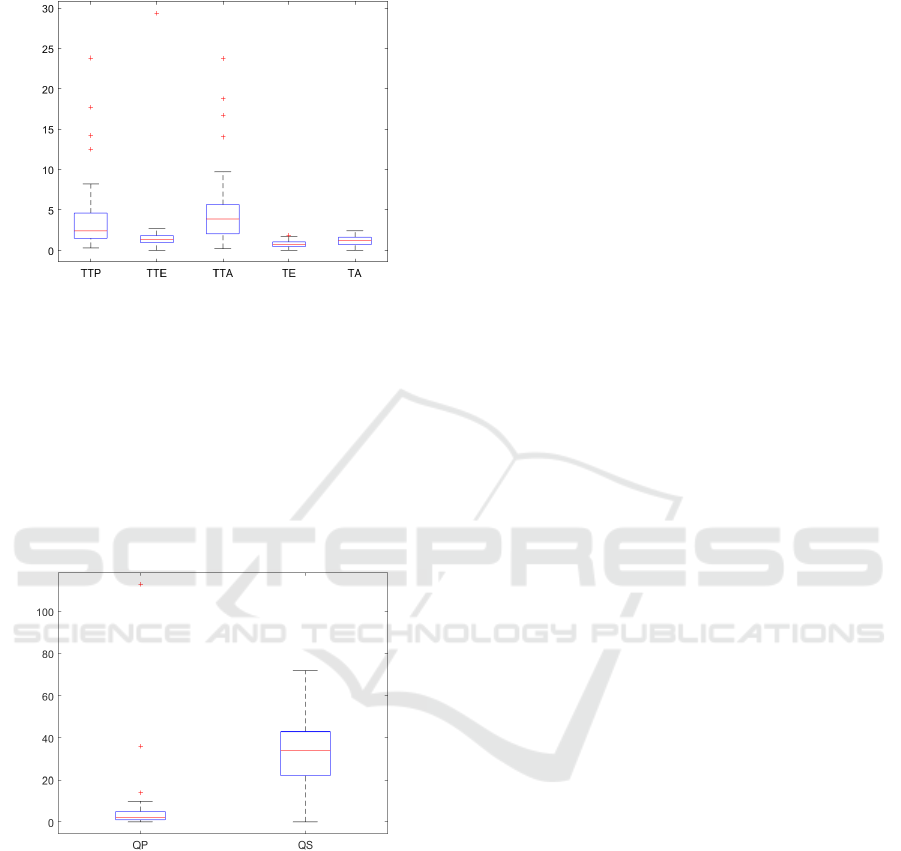
values of absolute difference, indicating that the pro-
posed methodology can still be improved.
Figure 3: Mean and standard deviation for difference be-
tween manual and automatic values of variables using all
database.
The features generated automatically from the au-
dio signals were used as parameters for a clustering
proposal regarding the probability of dyslexia. Each
individual being leveled in the high probability or low
probability of being dyslexic, a two-class problem.
Supervised classification methods were used to build
a model of how the characteristics can be used to iden-
tify a patient with a probability of dyslexia.
Figure 4: Mean and standard deviation for difference be-
tween manual and automatic values of variables using all
database.
Among the classification methods tested, the Sup-
port Vector Machine (SVM) using a Gaussian kernel
obtained the best result, the experiments took place
with k-fold cross-validation using the 36 audios, re-
sulting 94.4% of accuracy, 80% of precision, 100%
of recall and F1-score equal 0.88. Precision is related
to the number of patients incorrectly classified as non-
dyslexic, while the high recall value means high sen-
sitivity; all dyslexic patients were correctly identified.
From these data, there is a good agreement for the
probability of dyslexia, raising promising results, for
other improvements, including methodologies from
different areas and expansion of research for other
pathologies.
6 CONCLUSION
Although there are some computational audio signal
processing tools to identify pathologies, they do not
meet all the needs of specialists. Thus the analysis of
the pathology and classification is still done manually.
This work proposed an automatic methodology
for the extraction of audio characteristics from read-
ing aloud and its use as variables in an intelligent
model for the identification of young people with
dyslexia. Among the main contributions can be high-
lighted the automation of the process of extracting
features from the audio signal and its modeling using
machine learning techniques.
The automatic TT P and TT P characteristics
reached very close values when compared to manual
measurements, while the number of QS syllables had
a higher difference in the comparison. Even though
the set of features contributed to the implementation
of a classification model between indicative or not of
dyslexia with an accuracy around 94%.
Although the results presented are satisfactory, it
is believed that the methodology can be improved if
we carry out audio alignment training, signal seg-
ments are aligned before the feature extraction. A
database with a more significant number of recording
samples and a diversity of audience also may result in
better training and testing of machine learning algo-
rithms.
Finally, even though the results presented in the
article relate to a text read in Portuguese, the proposed
methodology also allows its use in other languages
since the leading hypothesis for detecting dyslexia is
related to the speed and the way words are spoken and
not about the content itself.
During the development of this research, ideas re-
lated to applications emerged, such as the construc-
tion of learning games for people with dyslexia. The
proposal focuses on exercises that allow benefits in
development and help to identify factors in which the
patient has less control, related to improvements in
quality of life.
ACKNOWLEDGEMENTS
This study was financed by Fundac¸
˜
ao de Amparo
`
a
Pesquisa do Estado de Minas Gerais (FAPEMIG) and
Universidade Federal de Ouro Preto (UFOP).
ICEIS 2020 - 22nd International Conference on Enterprise Information Systems
646

REFERENCES
Abu Zarim, N. A. (2016). Android Based Dyslexia Early
Screening Test. PhD thesis, UTeM.
Al-Barhamtoshy, H. M. and Motaweh, D. M. (2017). Di-
agnosis of dyslexia using computation analysis. In
2017 International Conference on Informatics, Health
& Technology (ICIHT), pages 1–7. IEEE.
Alghabban, W. G., Salama, R. M., and Altalhi, A. H.
(2017). Mobile cloud computing: An effective multi-
modal interface tool for students with dyslexia. Com-
puters in Human Behavior, 75:160–166.
Alves, L. M. (2007). A pros
´
odia na leitura da crianc¸a
disl
´
exica. phdthesis, Universidade Federal de Minas
Gerais - Faculdade de Letras, Belo Horizonte.
Alves, L. M., da Conceic¸
˜
ao Reis, C. A.,
ˆ
Angela Maria
Vieira Pinheiro, and Capellini, S. A. (2009). Aspec-
tos pros
´
odicos temporais da leitura de escolares com
dislexia do desenvolvimento. Revista da Sociedade
Brasileira de Fonoaudiologia, 14(2):197–204.
Barbedo, J. G. A. and Lopes, A. (2007). Discrimi-
nador voz/m
´
usica baseado na estimac¸
˜
ao de m
´
ultiplas
frequ
ˆ
encias fundamentais. IEEE LATIN AMERICA
TRANSACTIONS, 5(5):294–300.
Behlau, M. P. (2001). Voz: o livro do especialista, volume 1.
Revinter.
Breznitz, Z. and Leikin, M. (2001). Effects of accelerated
reading rate on processing words’ syntactic functions
by normal and dyslexic readers: Event related poten-
tials evidence. The Journal of genetic psychology,
162:276–96.
Brognaux, S. and Drugman, T. (2016). Hmm-based speech
segmentation: Improvements of fully automatic ap-
proaches. IEEE/ACM Transactions on Audio, Speech,
and Language Processing, 24(1):5–15.
Cano, P., Loscos, A., and Bonada, J. (1999). Score perfor-
mance matching using hmms. In Proceedings of the
International Computer Music Conference, pages 441
– 444, San Francisco.
Deuschle, V. P. and Cechella, C. (2009). O d
´
eficit em con-
sci
ˆ
encia fonol
´
ogica e sua relac¸
˜
ao com a dislexia: di-
agn
´
ostico e intervenc¸
˜
ao. Rev CEFAC, 11(Supl 2):194
– 200.
Drigas, A. S. and Politi-Georgousi, S. (2019). Icts as a
distinct detection approach for dyslexia screening: A
contemporary view. International Journal of Online
and Biomedical Engineering (iJOE), 15(13):46–60.
Geurts, L., Vanden Abeele, V., Celis, V., Husson, J.,
Van den Audenaeren, L., Loyez, L., Goeleven, A.,
Wouters, J., and Ghesqui
`
ere, P. (2015). DIESEL-
X: A Game-Based Tool for Early Risk Detection of
Dyslexia in Preschoolers, pages 93–114. Springer In-
ternational Publishing, Cham.
Gusso, G. and Lopes, J. M. C. (2012). Tratado de Medicina
de Fam
´
ılia e Comunidade: Princ
´
ıpios, Formac¸
˜
ao e
Pr
´
atica, volume 2. Artmed.
Leon, P., Pucher, M., Yamagishi, J., Hernaez, I., and Saratx-
aga, I. (2012). Evaluation of speaker verification se-
curity and detection of hmm-based synthetic speech.
IEEE Transactions on Audio, Speech, and Language
Processing, 20(8):2280–2290.
Marinus, J. V. M. L., Ara
´
ujo, J. M. F. R., Gomes, H. M.,
and Costa, S. C. (2009). On the use of cepstral co-
efficients and multilayer perceptron networks for vo-
cal fold edema diagnosis. Information Technology and
Applications in Biomedicine, 2009. ITAB 2009. 9th In-
ternational Conference on, pages 1 – 4.
Prabha, A. J. and Bhargavi, R. (2019). Prediction of
dyslexia using machine learning—a research travel-
ogue. In Proceedings of the Third International Con-
ference on Microelectronics, Computing and Commu-
nication Systems, pages 23–34. Springer.
Prates, L. P. C. S. and Martins, V. O. (2011). Dist
´
urbios da
fala e da linguagem na inf
ˆ
ancia. Revista de Medicina
de Minas Gerais, 21(4):54 – 60.
Rahman, M. A., Hassanain, E., Rashid, M. M., Barnes, S. J.,
and Hossain, M. S. (2018). Spatial blockchain-based
secure mass screening framework for children with
dyslexia. IEEE Access, 6:61876–61885.
Santos, M. C. S. (2013). Disvoice: Aplicativo de apoio
`
a fonoaudiologia para dispositivos m
´
oveis. mathe-
sis, Fundac¸
˜
ao de Ensino Eur
´
ıpides Soares da Rocha
- UNIVEM.
Shaywitz, S. (2006). Entendendo a dislexia : um novo e
completo programa para todos os n
´
ıveis de problemas
de leitura. Artmed, Porto Alegre, 1 edition. Trad. sob
a direc¸
˜
ao de Vinicius Figueira.
Sidhu, M. S. and Manzura, E. (2011). An effective con-
ceptual multisensory multimedia model to support
dyslexic children in learning. International Journal
of Information and Communication Technology Edu-
cation (IJICTE), 7(3):34–50.
Silva, E. L. F. and Oliveira, H. M. (2012). Implementac¸
˜
ao
de um algoritmo de divis
˜
ao sil
´
abica autom
´
atica para
arquivos de fala na l
´
ıngua portuguesa. Anais do
XIX Congresso Brasileiro de Autom
´
atica, CBA 2012.,
pages 4161 – 4166.
Van den Audenaeren, L., Celis, V., Vanden Abeele, V.,
Geurts, L., Husson, J., Ghesqui
`
ere, P., Wouters, J.,
Loyez, L., and Goeleven, A. (2013). Dysl-x: De-
sign of a tablet game for early risk detection of
dyslexia in preschoolers. In Schouten, B., Fedtke,
S., Bekker, T., Schijven, M., and Gekker, A., edi-
tors, Games for Health, pages 257–266, Wiesbaden.
Springer Fachmedien Wiesbaden.
Zavaleta, J., Costa, R. J. M., da Cruz, S. M. S.,
Manh
˜
aes, M., Alfredo, L., and Mousinho, R.
(2012). Dysdtool: Uma ferramenta inteligente para
a avaliac¸
˜
ao e intervenc¸
˜
ao no apoio ao diagn
´
ostico da
dislexia. CSBC (2012) XXXII Congresso da Sociedade
Brasileira de Computacao: XII WorKshop de Infor-
matica Medica (WIM 2012).
Early Dyslexia Evidences using Speech Features
647
