
An Experience in Collecting Requirements for Mobile, Energy Efficient
Applications from End Customers in the Bank Sector
Vladimir Ivanov
1
, Pavel Kolychev
2
, Sergey Masyagin
1
, Giancarlo Succi
1
, Rafael Valeev
2
and Vasilii Zorin
3
1
Innopolis University, Russia
2
Ak Bars Digital Technologies, Russia
3
Schaffhausen Institute of Technology, Switzerland
Keywords:
Empirical Methods, Software Experimentation.
Abstract:
Several development processes recommend strongly user participation and involvement in requirement acqui-
sition. However, there are very few studies detailing the empirical results of direct user involvement in large
industrial software development products. In this paper we report the outcomes of a novel approach taken
by the Software House of one of major Russian banks (Ak Bars Bank) on how to improve the development
process by directly involving end customers in the requirement elicitation phase of mobile, energy efficient ap-
plications. We observe that such involvement in a form of a workshop has led to improvement of requirements
collection and higher levels of user satisfaction.
1 INTRODUCTION
One of the tenets of agile methods is to directly in-
volve the users in the development of the product and,
in converse, one of the alleged difficulties in agile
methods is to involve customers in the development
of products.
User participation and involvement (UPI) is a
well-known and widely studied concept in software
engineering. Despite the presence of several studies
that claim the benefits of UPI, it is a challenge to un-
derstand quantitatively the profits arising from user
involvement into development. The specificity of the
domain, the software development process, and other
covariates may affect the results dramatically.
In the present paper we report results of applica-
tion of an original tools and methods applied in mo-
bile banking domain and discuss the lessons learned.
Moreover, we use a formal methods to measure the re-
sults and show the significance of the effects of UPI.
In this paper we discuss a novel approach taken
by the Software House of a Russian Bank, Ak Bars
Digital Technologies (ABDT), to increase its product
quality and the associated preliminary results. ABDT
holds at every sprint requirement focused elicitation
workshops with end users that have been recruited
using social media tools. The application domain is
mobile banking with specific attention for energy ef-
ficiency a primary concern for its users.
Ak Bars Digital Technologies employees about
300 people, organized in 40 agile teams managing
about 300 interconnected IT systems. The approach
is centered in an adaptation of Scrum to take into ac-
count the multiplicity of the desires of the end cus-
tomers, which are in high number.
In the discussion we provide (links to) the con-
crete tools and methods used during the experiment.
Moreover, we supply also the screenshots of the ads
used to recruit end users and of the various alterna-
tive product design – they are in Russian and the most
essential features are translated in the caption, but we
hope in this way to supply the reader the most realistic
description of work, to facilitate is replica in other set-
tings, and, if needed, its generalization in other con-
texts.
The results of the application of the approach have
been quite positive, since it has been evidenced that
such workshops appear to predict reliably the desires
of the end users, that results in products with higher
ratings in the app store, and, somehow, make the de-
velopment teams more effective in managing and ex-
ecuting tasks.
The think that the value of this work lies on the
relevance of the subject by itself and of its application
domain, of the size of the experimentation and on the
quality of the analysis of the data, on the results that
522
Ivanov, V., Kolychev, P., Masyagin, S., Succi, G., Valeev, R. and Zorin, V.
An Experience in Collecting Requirements for Mobile, Energy Efficient Applications from End Customers in the Bank Sector.
DOI: 10.5220/0009574805220530
In Proceedings of the 15th International Conference on Evaluation of Novel Approaches to Software Engineering (ENASE 2020), pages 522-530
ISBN: 978-989-758-421-3
Copyright
c
2020 by SCITEPRESS – Science and Technology Publications, Lda. All rights reserved

have been achieved, and on the plenitudes of details
that have been provided that should facilitate replicas
and extensions.
This paper is organized as follows. Section 2 pro-
vides a background to the problem. Section 3 details
the overall experimental setting of the study. Section
4 describes the results that have been obtained and
Section 5 analyses them. Finally, Section 6 draws
some conclusions and outlines the direction of the fu-
ture research.
2 BACKGROUND ON THE
PROBLEM
2.1 Collecting Requirements from Users
Development of information system usually involves
user to for improve system quality and to ensure suc-
cessful system implementation. The importance of
user-centered design was recognized in 1980s with
works of E. Mumford (Mumford, 1983) where he
distinguishes direct and indirect user participation;
and D. Norman’s seminal book (Norman and Draper,
1986) in which he urged designers to take users’
needs and interests into account. It is obvious that
user involvement in system development and design
is one of the easiest ways to achieve product use-
fulness and usability. First empirical studies related
to the topic in software engineering appeared around
that years. In (Baroudi et al., 1986) a survey of 200
production managers was performed. Their results
demonstrate that user involvement in the development
of information systems may enhance both system us-
age and the user’s satisfaction with the system. Also,
the study has provided an evidence that high sys-
tem usage is the result of user’s satisfaction with the
system. In (Damodaran, 1996), L. Darmodan has
explored the types of user involvement in the sys-
tems design processes as well as the roles of users
in such processes. She claimed that knowledge and
experience of end users are required at different steps
throughout the software development process. In later
works (Simonsen and Robertson, 2012; Kanstrup and
Bertelsen, 2011) the research focus has moved from
user-centered design to the concept of so-called user
driven innovation.
Nowadays, involvement of users in software engi-
neering becomes a common practice intended to in-
crease the usage of software systems. It is true, es-
pecially, in those applications domains where users
of software are main consumers of the correspond-
ing services provided by business or government.
It is typical in health-care domain (Marcilly et al.,
2016; Kushniruk and Nøhr, 2016), where there is
a lack of user satisfaction with health-care informa-
tion systems became a serious issue. In (Kushniruk
and Nøhr, 2016) discussed several methods to include
users in development and evaluation of software prod-
ucts. They describe challenges in IT evaluation dur-
ing participatory using several case studies. Thus, in
modern software engineering, there is no doubt that
user should be involved in development processes,
however questions “How?” and “When?” are emerg-
ing and demand a scientific exploration. This drives
the need of additional case studies in specific domains
related to services such as heath-care, financial do-
main and e-government.
2.2 Requirements for Development of
Energy-efficient Mobile
Applications
In this section we review approaches to formulation
of requirements for energy-efficient mobile applica-
tions. Development of energy-efficient applications
needs measuring of energy consumption related to an
application. Therefore, a prerequisite for any energy-
efficient approach to development is establishing a
way to measure the overall power consumption of
a mobile device: using either some external instru-
ments or by means of self-metering. The collected
data form parts of the input for training power con-
sumption models and hence can be used for energy-
efficient development (Hoque et al., 2016).
The first category includes external instruments,
external power monitors and provides the ground
truth for mobile device power analysis due to their
high precision and accuracy. However, their usage is
limited by a laboratory; it is not feasible for large-
scale testing and development.
The second category, self-metering, assumes that
a device has its own capabilities to measure the
system-level power consumption without the help of
external instruments. This category of measurement
methods can be divided into three types: (i) Battery
models, voltage, and state of charge; (ii) State of
charge estimation (Hoque and Tarkoma, 2016); (iii)
Fuel gauge and battery APIs
1
. From the point of view
of an energy profiling application, the self-metered
data is provided through the device’s battery API. The
API exposes to OS information about the battery sta-
tus (e.g. the Android’s BatteryManager). So, the data
1
For instance, Andriod’s Battery His-
torian: https://developer.android.com/
about/versions/android-5.0.html. Android Power Pro-
files: https://source.android.com/ devices/tech/power.html
An Experience in Collecting Requirements for Mobile, Energy Efficient Applications from End Customers in the Bank Sector
523

can be used during application development. The API
updates status periodically and whenever there is a
change in the charge and/or the temperature of a bat-
tery or not (typical frequency of the updates ranges
between 0.25Hz to 4Hz (Zhang et al., 2010)).
Hence, the measurement type and the data coming
via API about energy consumption require from mo-
bile application developers to follow one of the fol-
lowing three major approaches: utilization-based en-
ergy requirements (Zhang et al., 2010), event-based
energy requirements (Pathak et al., 2011), and the
ones based on code analysis. The first and the sec-
ond approaches to requirement specification needs a
real device to run an application. Thus, for our study
the third approach is more relevant. This approach
relies on the analysis of the program code to be exe-
cuted. The approach is exemplified, for instance, as
an instruction-level model, which works by relating
the power consumption of a piece of code with each
instruction executed. This requires the evaluation of
power consumption for each of the instructions of the
software considered. Clearly, this can be applied at a
level of functions, procedures, or subroutines.
Selecting a proper energy profiler forms another
requirement for mobile development. The models and
approaches described above have been implemented
in the on-device profilers such as Sesame(Dong and
Zhong, 2011), PowerBooter(Zhang et al., 2010), V-
Edge(Xu et al., 2013) etc. The choice of a profiler
for a typical developer is not straightforward. Along
with their accuracy, other requirements are important,
including availability, hardware support, ease of use
and installation, and expertise of the developer.
Additionally, there are requirements related to the
privacy issues. As it is discussed in (Diamond et al.,
2018) collecting data about energy consumption (ei-
ther of the device as a whole or in an application)
can clearly cause privacy concerns. Thus, a devel-
oper of the mobile energy-efficient application should
consider such requirements as transparency, appropri-
ation and security in the usage of the energy consump-
tion data.
3 DESCRIPTION OF THE
EXPERIMENTAL SETTING
3.1 Situation That Induced the Change
During several years traditional Banking sector in
Russia has been suffering from aggressive com-
petition with FinTech companies providing game-
changing easy-to-use financial products to customers.
Ak Bars Digital Technologies (ABDT) was founded
in October 2016 in response to this process.
First product teams were created as soon as the
company was established. The development process
in the teams was based on Scrum framework de-
scribed in Scrum Guide
2
. All teams in the company
incorporates all mandatory events and artifacts pre-
scribed by Scrum.
There were several reasons to use Scrum as a pro-
cess framework. Firstly, developing digital product is
a complex task due to high level of uncertainty and
a lot of dependencies between systems and compo-
nents (20 main systems and 2 mission-critical devel-
oped in parallel by different teams inside and out-
side the organization). Secondly, there are no stable
requirements: they constantly change in response to
new requests from customers, implementation of new
features by competitors and claims of government in-
stitutions. Finally, the product should be developed in
a competitive environment, thus fast delivery of new
versions of a product and adaptability are extremely
important. Taking into account these issues choosing
Scrum is looking quite reasonable: Scrum is based on
the empirical process, which allows to identify and
tackle emerging problems in a rapid pace. It creates
framework, inside which teams could establish their
own process that satisfies their needs.
In this article we analyze the process in one prod-
uct group that develops Ak Bars Online system which
provides banking and financial services for customers
among various digital platforms. The whole product
group consists of 8 cross-functional agile teams and
Product management team. Two of these agile teams
includes vendor developers who works by out-staffing
agreement. Agile teams use Scrum framework and in-
clude from 5 to 10 developers. By “developers” we
mean all people who analyze, design, implement and
test the system. In total the product team includes 65
people, among them: 11 back-end developers, 5 iOS
developers, 5 Android developers, 3 web developers,
12 QA-engineers, 4 user interface designers, 2 sys-
tem analysts, 2 site reliability engineers, a system ar-
chitect, a data scientist, an UX expert, an application
security expert, 5 outstaffing specialists and product
management. The product management includes a fi-
nancial expert, a web analyst, marketing and content
experts. Also we have 5 Product Owners and three
Scrum Masters. Due to lack of Some Scrum Masters
and Product Owners work with several agile teams
due to lack of the competences on the market.
The product group develops Android, iOS, web
applications and back-end using SOA (service-
2
https://www.scrumguides.org/docs/scrumguide/v2017/
2017-Scrum-Guide-US.pdf
ENASE 2020 - 15th International Conference on Evaluation of Novel Approaches to Software Engineering
524

oriented architecture), adapters and interfaces to com-
municate with other bank’s middleware and adjacent
systems. All front-end applications are deployed on
production environment and available for end-users.
Android and iOS applications are published at Play-
Market and AppleStore accordingly. For iOS devel-
opment the team used Objective C and Swift. To de-
velop Android application the team used Java, Kotlin,
RxJava2. Ak Bars Online platform is developed by
using C#, .Net Framework, and .Net Core. The team
also includes 4 outstaffing developers who makes nec-
essary implementation on CRM that based on Ora-
cle Siebel by using eScript programming language.
One developer implements procedures and scripts in
processing system. Autotests are developed by using
Python. While the detailed breakdown is confidential,
we can say that overall the codebase for the project
spanned several hundreds of thousands of lines of
code.
As it has been stated before, all teams use Scrum
framework as it is described in Scrum Guide. The
core idea of the framework is to constantly inspect and
adapt. It incorporates several feedback loops, and the
most important one is a review of product increment
at the end of every iteration. Sprint review is a multi-
component event, where development team, product
owner and stakeholders observe implemented prod-
uct increment, the market, product aims and discuss
which features should be done next.
For the first year of working, teams invited to
the event in-house stakeholders and did not take into
consideration direct feedback from users. However,
at some time, during one of Sprint Retrospectives,
teams understood that except in-house stakeholders it
is necessary to ask other type of stakeholders, end-
customers. Yes, product owner could represent users
being a voice of customers, but this usually leads to a
longer distance between product teams and real cus-
tomers and raises several issues including:
• people describe the world based on their own per-
suasions and views, thus this business analysts
or product owner always (unconsciously) trans-
form real requirements into somehow other re-
quirements,
• developers often do not see how end-customers
work with the products and do not understand
their real pains.
However, the competition is very stiff and the key
stakeholders have been putting always higher goals
for the ABDT, so a radical change has been imple-
mented to attempt to target such issues.
Figure 1: Customers trying the products and team members
observing without speaking.
3.2 Implemented Change
Substantially, the change was to involve directly end
customers in requirement elicitation; if not enough
customers were available, direct proxies, were used:
the business employees of the bank that operate on a
daily basis with customers using such products.
Specifically, volunteers users were recruited via
the social network channels of the bank:
• on Vkontakte at https://vk.com/akbars ru
• on Facebook: https://www.facebook.com/
akbarsbank/
The product owner also tried to define properly the
target group of customers invited at each session at-
tempting to balance among ages, gender, background.
1. From 1 to 10 estimate, how easily was for
you to completed the task. Comment on what
was the most confusing part.
2. From 1 to 10 estimate how much time it took
you to complete the task. In particular, com-
ment on which actions took the most time
3. Which functionality did you miss in the app?
4. Do you understand all instructions and com-
ments? If not, please comment the ones that
are not clear for you
5. Are all the developed functionality really
needed? What could be removed?
Figure 2: Structured questionnaire administered to the cus-
tomers during the second phase of the workshop.
Each interaction with the customers was orga-
nized in the format of a workshop lasting approxi-
mately one hour and it occurred at every sprint, that
An Experience in Collecting Requirements for Mobile, Energy Efficient Applications from End Customers in the Bank Sector
525

is, every two weeks. Such workshop was organized in
two phases:
• in the first phase, the customers were presented
the applications and asked to perform some use
cases with them. The members of the develop-
ment team did not speak, comment, or communi-
cate in any way with the customers: they just ob-
served the interaction process, as shown in Figure
1;
• in the second phase, the team members sat with
the customers and asked them questions about
their experience with the applications; after the
first informal and unstructured comments from
the customers, a very simple structured question-
naire was employed (Figure 2). All the discussion
was recorded in written format.
The simple structured questionnaire was devel-
oped by the product group and structured as follows.
Please note that while this questionnaire is quite prim-
itive and could be improved according to the best
practices in the field, the teams have always resisted
any such suggestion and kept it as is because they are
accustomed to it, know it by heart, so it is very simple
for them to administer it. Anyway, it is not the pur-
pose of this study to determine how to do better the
questionnaire, but to describe in details the approach
and its effects.
All the comments coming from the customers
were then elaborated by the teams and user stories
were created based on such feedback. Such user sto-
ries were clustered in three classes:
• “quick win:” simple modifications or bug fixes
that required an effort that could be condensed in
a sprint;
• “major rework:” major required changes in the
apps spanning multiple iterations;
• “to ignore:” comments not required at the current
stage.
The comments were then passed to the prod-
uct owner, with the understanding that quick wins
should be executed as early as possible, major re-
works should be planned within a timeframe of 6
months, and items to ignore were simply removed,
rather than kept in the backlog, with the idea that
they would have never be targeted anyway, and if
the represented some important feature that got miss-
classified, they would have emerged again in a fol-
lowing customer workshop.
4 EMPIRICAL RESULTS
Overall, we are considering 21 “frequent” releases of
the software to the customer, which spanned from the
beginning of March 2018 to the end of March 2019.
In total there were 22 releases, 8 with the “traditional”
approach of AkBars (named T1 . . . T8 in the follow-
ing) and 14 following the new approach (named N1
. . . N14 in the following).
4.1 Evaluation of the Effects of the
Changes
To evaluate the results of the new approach we have
selected the following criteria:
• Ability of user sessions to predict preferences of
end users
• Customer satisfaction measured in ratings in the
appstore
• Ability to predict the amount of work to complete
The first criteria relates to the practical usefulness of
the data collected by customers selected as per the
process, and on how representative such customers
are with respect to the overall populations of cus-
tomers of the bank. The second criteria is a quite ob-
vious choice, since it measures the satisfaction of the
customers as a whole. The third criteria that we used
were the ability of the team to predict the amount of
work to complete, measured as a percentage between
the planned and the accomplished tasks, and it is con-
nected to the cohesiveness of the work done, which
should reflect in more effective work.
Needless to say, the reader may imagine several
other metrics and criteria that could have been col-
lected during the development process or on the final
product and then used in our analysis. Being this a
study on a real company with real datasets, we are
indeed constrained with the information that is con-
cretely available to us. Nonetheless, we think that the
size of the experiment in terms of both time duration
and people involved, the metrics collected, and the
importance for Ak Bars of the product being devel-
oped make this study a very valuable, original, and
unique contribution to the research in this area.
4.2 Prediction of Preferences of the End
Users
At the beginning of the application of the methodol-
ogy the company has performed a preliminary assess-
ment on the effectiveness of the sessions with cus-
tomers to predict the preferences of the end users. To
ENASE 2020 - 15th International Conference on Evaluation of Novel Approaches to Software Engineering
526

this end a formal experiment was run using a post-test
only control group design with randomisation (Camp-
bell and Stanley, 1963).
To this end, two experiments were conducted. In
the first, a problematic feature was identified in the
app related to the discussion with customers and a
variation of such feature was discussed during the ses-
sions with customers. Specifically, the desire of the
bank was to have users interact one another via the
app. Originally such feature was called “friends” and
after the discussion was called “chat”.
After the discussion, two concurrent versions of
the app were deployed, one with the old label (about
50.4% of the all deployments) and one with the new
(about 49.6% of the all deployments) – the concrete
numbers are of the order of the tens of thousands,
but are omitted for confidentiality. About 3.8% of the
users of the app with the old label used the feature vs.
about 4.5% of the users of the app with the new label
(an increase of about 18.6%). To determine the signif-
icance of the variation we have used the chi-squared
test, which provides an excellent approximation of
the real value, given the large sample size, since the
size of such sample makes impossible to adoption
of the Fisher’s exact test (Fisher, 1922; Wasserman,
2006). The result identifies a statistically significant
improvement with α = 0.05 (p is 5.8 × 10
−5
, giving
a very high confidence in the robustness of the im-
provement against possible statistical fluctuations).
The second experiment aimed at determining the
best way to promote new products of the bank to the
users of the app. The original version was not result-
ing in users exploring such opportunities, a proposal
was made in the focus group.
In this case, three concurrent versions of the app
were deployed, one with the old label (about 33.2% of
the all deployments), one with the large button (about
33.5% of the all deployments), one with the opportu-
nity added to the list of features (about 33.3% of the
all deployments) – the concrete numbers are of the
order of the hundred of thousands, but are omitted for
confidentiality. About 16.6% of the users of the orig-
inal app explored the new products of the bank vs.
about 27.1% of the users of the first alternative design
(an increase of 63.1%) and 24.1% of the users with
the alternative design (an increase of 44.6%).
Also in this case, to determine the significance of
the variation we have used the chi-squared test (again
the size of such sample has not allowed the use of
the Fisher’s exact test). The result identifies a statis-
tically significant improvement with α = 0.05 (p is
5.9 × 10
−94
, giving a very high confidence in the ro-
bustness of the improvement against possible statisti-
cal fluctuations).
The two experiments have been conducted using
a quite standard experimental design of treatment, us-
ing a post-test only control group design with ran-
domisation (Campbell and Stanley, 1963). In both
cases we have achieve a statistically significant effect,
which, in the second case, is also quite remarkable in
terms of size. Altogether, It appears that the new ap-
proach appears quite effective in predicting the pref-
erences of the end users. Indeed, in all these situa-
tions there could be several confounding factors, even
if in this case we follow a such a solid experimen-
tal design and we obtain very comfortable statistical
evaluations.
4.3 Ratings of Users in the Appstore
As mentioned, we consider the ratings in the Appstore
one of the criteria that we use to evaluate the results of
the introduction of the new approach to elicit require-
ments. We concentrate our attention to the Google
Play Store, because we did not have easy access to
the ratings in the Apple App Store.
Figure 3: Overall results of the application of the new ap-
proach.
4.3.1 Overall Analysis
The first analysis we have made concerns whether
the introduction of the new approach has resulted in
higher ratings. To gather an overall intuitive under-
standing of the situation we have constructed cumu-
lative beanplots of the ratings before and after such
introduction (Kampstra, 2008) (Figure 3). The thin
(black) bars represent the discrete values of the stars,
the thicker (blue) bar the mean, and the (red) plus sign
the median. It is clear that the introduction of the
new approach has significantly improved the ratings
by the end users. The mean rating has moved from
3,29 to 4.60 – statistically significant at α = 0.05 as
evaluated using the non parametric Mann-Whitney U
test (Mann and Whitney, 1947). The median has been
bumped from 4 to 5 – statistically significant at α =
An Experience in Collecting Requirements for Mobile, Energy Efficient Applications from End Customers in the Bank Sector
527
0.05 as evaluated using the non parametric Kruskal-
Wallis test (Kruskal and Wallis, 1952). We have
then analysed the data with the Kolmogorov-Smirnov
statistics (Kolmogorov, 1933), which assumes a value
of 0.37 (rounded to the second decimal), statistically
significant at the 0.05 level (actually, with a p value
less than 10
70
). It is important to mention that the
Mann-Whitney U test, the Kruskal-Wallis test, and
Kolmogorov-Smirnov statistics are a very conserva-
tive non parametric tests, which make no assumption
on the data, simply considering them on an ordinal
scale (Wasserman, 2006; Wasserman, 2010).
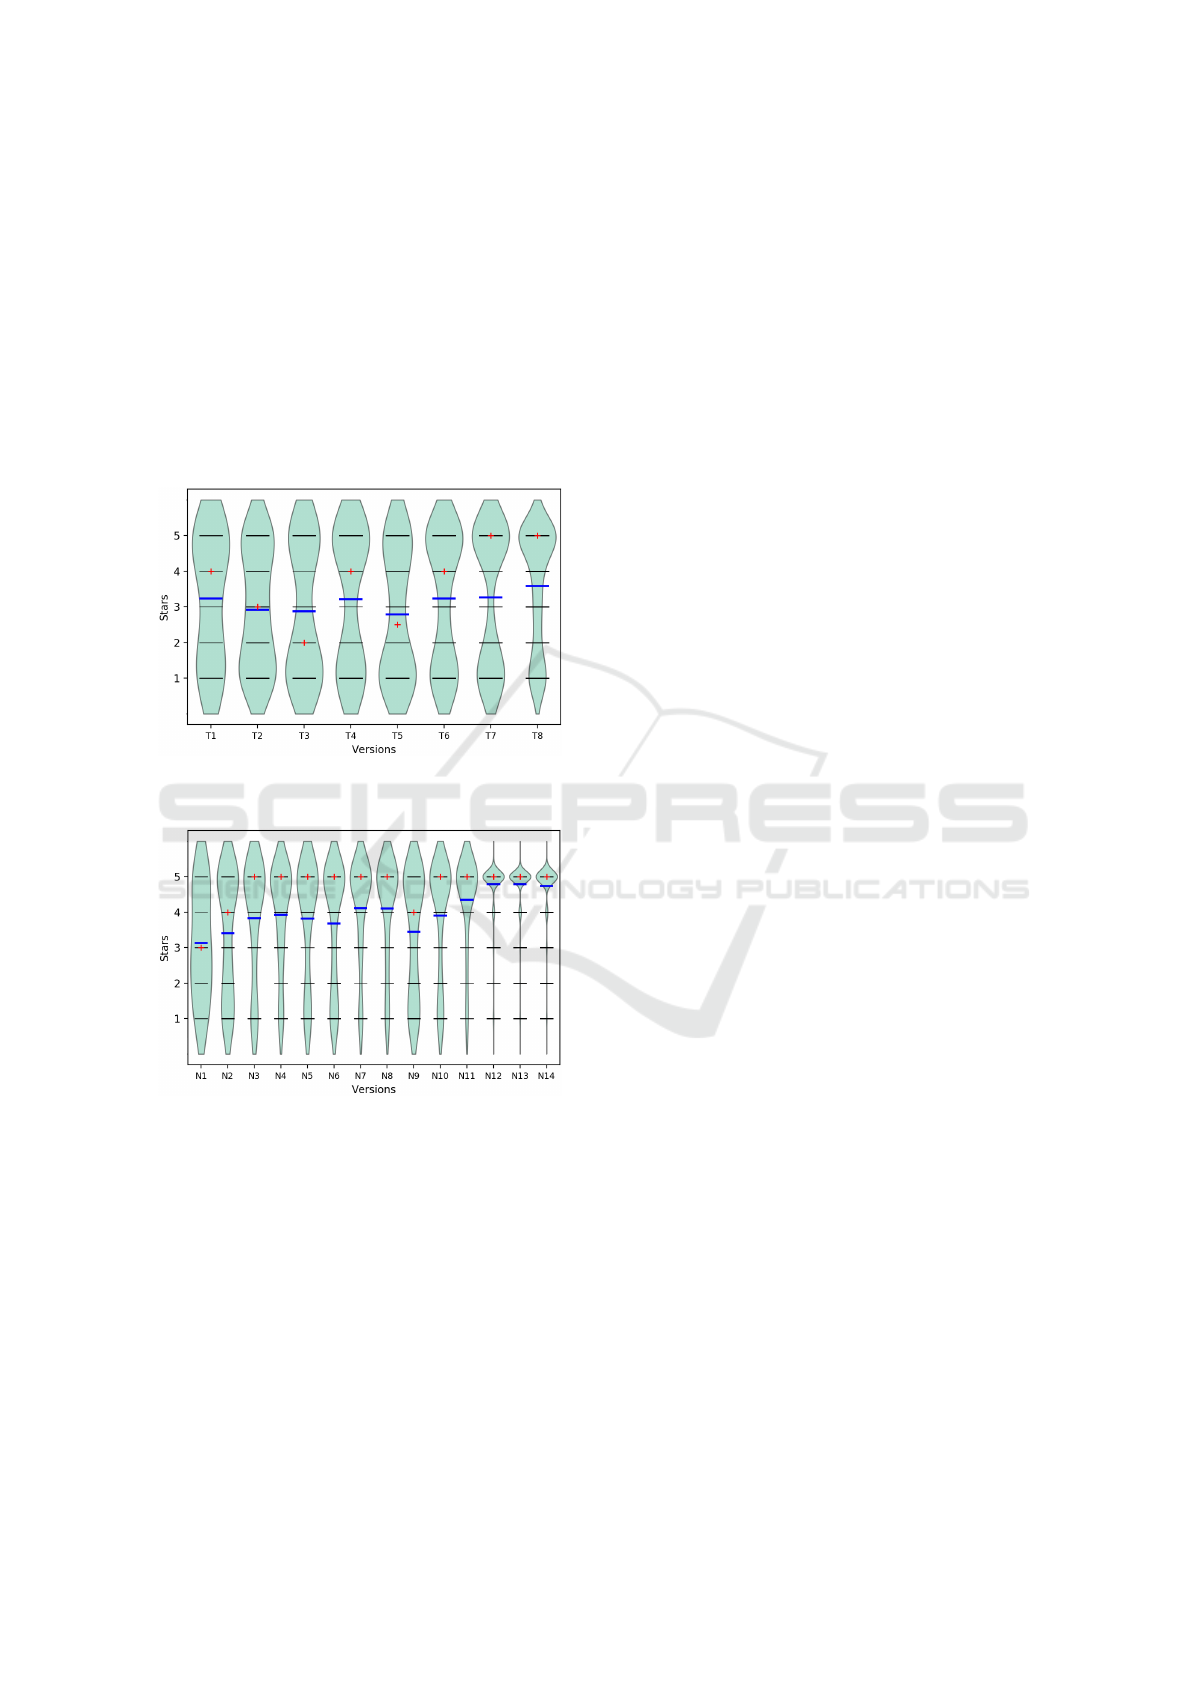
Figure 4: Situation before the application of the new ap-
proach.
Figure 5: Evolution of the improvement after the applica-
tion of the new approach.
4.3.2 Detailed Analysis of the Evolution of the
Versions
To gather a further understanding of the introduction
of the new approach in terms of customer complaints
we have first analysed version by version the situation
before and after the introduction of the new approach
in terms of analysis of beanplots (Figure 4 represents
the versions before the introduction of the new ap-
proach and Figure 5 after).
It is evident that before the introduction of the new
approach the situation was quite stable, with no real
variation of the means or the medians of the customer
evaluations (Figure 4); to gather an understanding of
the trend, we have run a non parametric correlation on
the values of the means (the Spearman’s rank corre-
lation), obtaining a positive correlation (0.60) that is
not statistically significant at the 0.05 level (p=0.12),
meaning that such positive variation may just come
from some random fluctuation.
4.3.3 Discussion of the Results of the Customer
Evaluations
Considering the data that we have analyse we can hy-
pothesize that the introduction of the new approach to
collect requirements has resulted in:
• a statistically significantly higher level of cus-
tomer ratings overall after the introduction of the
new approach than with the traditional approach
• a statistically significantly improvement pattern in
customer ratings after the introduction of the new
approach, while before the situation was stagnant.
We can therefore hypothesize that the new ap-
proach has improved the quality of the requirement
collection process as measured by customer ratings
and that such approach is still in its learning phase,
so we could expect further improvements. We would
like to mention that this also includes fully the en-
ergy concerns. However, we need to mention that the
sensitivity of this metrics to further improvement is
limited, since we are approaching the end of the scale
in the customer ratings, so further increases could re-
main below the level of statistical significance.
We would like to emphasize again that we have
obtained all these results using very robust non para-
metric techniques, which do not make any assump-
tion on the structure of data - the Mann-Whitney U
test (Mann and Whitney, 1947), the Kruskal-Wallis
test (Kruskal and Wallis, 1952), the Kolmogorov-
Smirnov test (Kolmogorov, 1933) and the Spearman’s
rank correlation coefficient (Myers et al., 2010). This
makes us confident that the effects that we have no-
tices are not simple random perturbation of data due
to noise.
4.4 Percentage of Tasks Completed in
Each Iteration
We have then turned our attention to the tasks that
have been completed in each iteration as per plan by
each team. We have considered 5 out of the 8 teams
working on the project and a total of 23 iterations, 10
performed with the traditional approach and 13 with
the new approach. 3 teams could not be inserted in
ENASE 2020 - 15th International Conference on Evaluation of Novel Approaches to Software Engineering
528
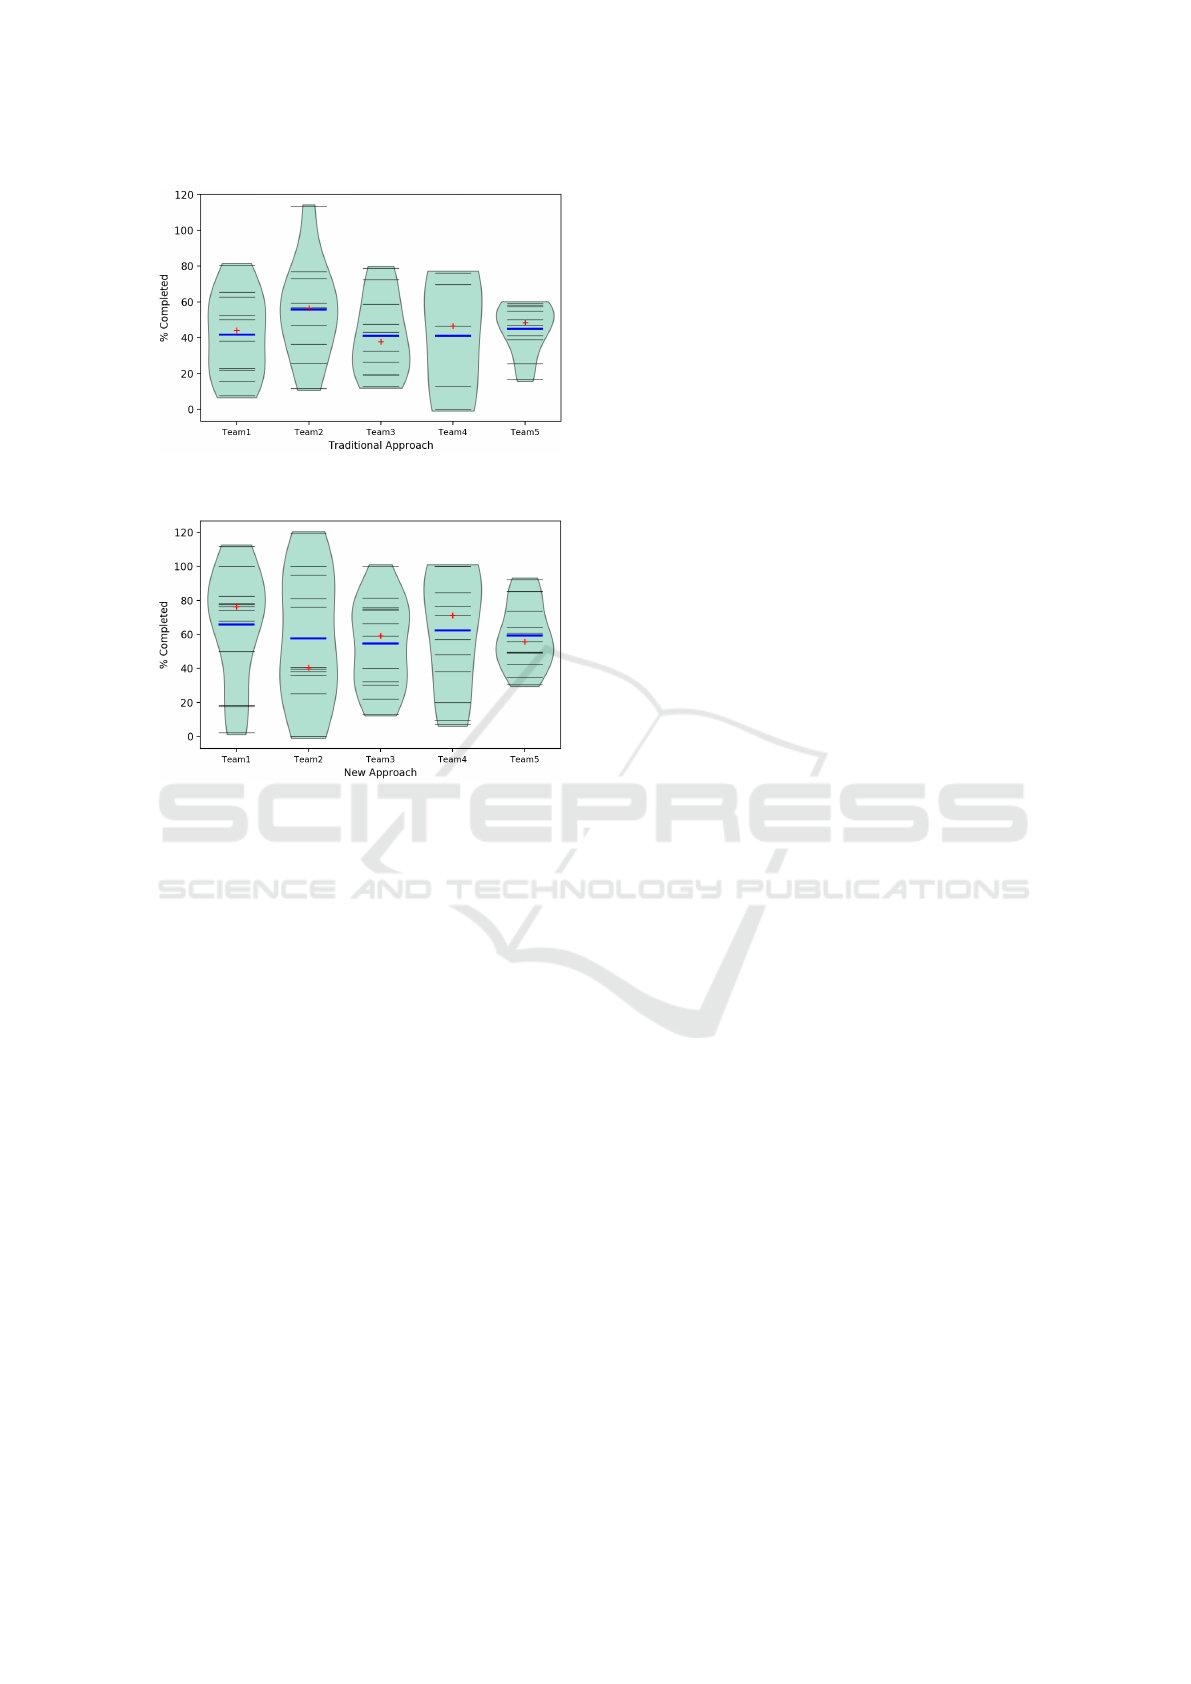
Figure 6: Completion rate of tasks during sprints using the
traditional approach.
Figure 7: Completion rate of tasks during sprints using the
new approach.
this analysis, since their data was considered confi-
dential at all levels.
While the specific number of tasks is obviously
confidential, the beanplots of percentage of comple-
tion are presented in Figure 6 (before the introduction
of the new approach) and in Figure 7 (after).
We have finally analysed the results as a whole
taking a meta analytical approach (Cook, 1994) and
performing a paired value sign test on the direction
of the variation of the means. In this case we have
obtained a result that is statistically significant, as we
could expect given that in 5 cases out of 5 the mean
percentage of accomplished tasks have improved.
5 DISCUSSION
In this work we have evidenced three major outcomes
of the proposed approach to involve customers in mo-
bile, energy efficient applications using directly end
customer workshops:
• such workshops predict fairly well the desires of
the overall population of end users, an evidence
that thus it also targets the energy concerns
• the resulting app appears to have significantly
higher customer ratings, evidencing that also the
energy concerns have been resolved
• the overall process appears somehow better man-
aged, even if such improvement is not easily no-
ticeable.
We think that such findings are generalizable to
larger settings, since:
• the size of the study is quite large and represents a
problem that is quite typical in the banking sector,
• the structure of the development process and of
the teams is quite typical for the Russian industry
and also for the banking industry worldwide,
• the number of evaluations that we have collected
for customer ratings is large, the effect size is re-
markable, and the p-value is very low.
As already mentioned, additional studies are
needed to confirm and extend these results. To this
end, a plenitude of information has been provided to
facilitate such followups.
6 CONCLUSIONS
In this paper we evaluate a novel approach taken by
the IT department of a Russian Bank, Ak Bars Digi-
tal Technologies. The approach is centered on tech-
niques and tools for taking into account effectively
the multiplicity of the desires of the end customers.
The results have been a higher predictability of the
desires of the customers, significantly higher ratings
of the app in the appstore, and somehow better man-
aged product.
The contribution of the work is concrete results of
application of an original tools and methods applied
in mobile development for banking domain.
Indeed, replicas of this study are advocated, and,
to this end, the work has been discussed quite in de-
tails. Moreover, future works will be connected to ap-
plication of the proposed approach in other software
products for the bank sector.
ACKNOWLEDGMENTS
The work presented in this paper was supported by the
grant of Russian Science Foundation # 19-19-00623.
REFERENCES
Baroudi, J. J., Olson, M. H., and Ives, B. (1986). An empiri-
cal study of the impact of user involvement on system
An Experience in Collecting Requirements for Mobile, Energy Efficient Applications from End Customers in the Bank Sector
529

usage and information satisfaction. Commun. ACM,
29(3):232–238.
Campbell, D. T. and Stanley, J. C. (1963). Experimental and
quasi-experimental designs for research. Houghton,
Mifflin and Company.
Cook, T. (1994). Meta-analysis for explanation : a case-
book. Russell Sage Foundation, New York.
Damodaran, L. (1996). User involvement in the systems
design process-a practical guide for users. Behaviour
& information technology, 15(6):363–377.
Diamond, L., Schrammel, J., Fr
¨
ohlich, P., Regal, G., and
Tscheligi, M. (2018). Privacy in the smart grid: end-
user concerns and requirements. In Proceedings of the
20th International Conference on Human-Computer
Interaction with Mobile Devices and Services Adjunct,
pages 189–196. ACM.
Dong, M. and Zhong, L. (2011). Self-constructive high-rate
system energy modeling for battery-powered mobile
systems. In Proceedings of the 9th international con-
ference on Mobile systems, applications, and services,
pages 335–348. ACM.
Fisher, R. A. (1922). On the interpretation of χ 2 from con-
tingency tables, and the calculation of p. Journal of
the Royal Statistical Society, 85(1):87.
Hoque, M. A., Siekkinen, M., Khan, K. N., Xiao, Y., and
Tarkoma, S. (2016). Modeling, profiling, and debug-
ging the energy consumption of mobile devices. ACM
Computing Surveys (CSUR), 48(3):39.
Hoque, M. A. and Tarkoma, S. (2016). Sudden drop in
the battery level?: understanding smartphone state of
charge anomaly. ACM SIGOPS Operating Systems
Review, 49(2):70–74.
Kampstra, P. (2008). Beanplot: A boxplot alternative for vi-
sual comparison of distributions. Journal of Statistical
Software, Code Snippets, 28(1):1–9.
Kanstrup, A. M. and Bertelsen, P. (2011). User innovation
management: A handbook. Aalborg Universitetsfor-
lag.
Kolmogorov, A. N. (1933). Sulla determinazione empirica
di una legge di distribuzione. Giornale dell’Istituto
Italiano degli Attuari, 4:83–91.
Kruskal, W. H. and Wallis, W. A. (1952). Use of ranks in
one-criterion variance analysis. Journal of the Ameri-
can Statistical Association, 47(260):583–621.
Kushniruk, A. and Nøhr, C. (2016). Participatory design,
user involvement and health it evaluation. Stud Health
Technol Inform, 222:139–151.
Mann, H. B. and Whitney, D. R. (1947). On a test of
whether one of two random variables is stochastically
larger than the other. The Annals of Mathematical
Statistics, 18(1):50–60.
Marcilly, R., Peute, L., and Beuscart-Zephir, M.-C. (2016).
From usability engineering to evidence-based usabil-
ity in health it. Stud Health Technol Inform, 222:126–
38.
Mumford, E. (1983). Designing human systems for new
technology: the ETHICS method. Manchester Busi-
ness School.
Myers, J., Well, A., and Lorch, R. (2010). Research Design
and Statistical Analysis. Research Design and Statis-
tical Analysis. Routledge.
Norman, D. A. and Draper, S. W. (1986). User centered
system design: New perspectives on human-computer
interaction. CRC Press.
Pathak, A., Hu, Y. C., and Zhang, M. (2011). Bootstrap-
ping energy debugging on smartphones: a first look
at energy bugs in mobile devices. In Proceedings of
the 10th ACM Workshop on Hot Topics in Networks,
page 5. ACM.
Simonsen, J. and Robertson, T. (2012). Routledge interna-
tional handbook of participatory design. Routledge.
Wasserman, L. (2006). All of Nonparametric Statistics
(Springer Texts in Statistics). Springer-Verlag, Berlin,
Heidelberg.
Wasserman, L. (2010). All of Statistics: A Concise Course
in Statistical Inference. Springer Publishing Com-
pany, Incorporated.
Xu, F., Liu, Y., Li, Q., and Zhang, Y. (2013). V-edge:
Fast self-constructive power modeling of smartphones
based on battery voltage dynamics. In Presented
as part of the 10th {USENIX} Symposium on Net-
worked Systems Design and Implementation ({NSDI}
13), pages 43–55.
Zhang, L., Tiwana, B., Qian, Z., Wang, Z., Dick, R. P., Mao,
Z. M., and Yang, L. (2010). Accurate online power es-
timation and automatic battery behavior based power
model generation for smartphones. In Proceedings of
the eighth IEEE/ACM/IFIP international conference
on Hardware/software codesign and system synthesis,
pages 105–114. ACM.
ENASE 2020 - 15th International Conference on Evaluation of Novel Approaches to Software Engineering
530
