
An Assessment of Statistical Classification for Socially Oriented
Learning Methodologies
O. Ferreira-Pires, M. E. Sousa-Vieira, J. C. L´opez-Ardao and M. Fern´andez-Veiga
Department of Telematics Engineering, University of Vigo, Spain
Keywords:
Online Social Learning Environments, Forums, Social Networks Analysis, Learning Analytics,
Success/Failure Prediction.
Abstract:
Social networks based on mutual interest, affinity or leadership are spontaneously generated when the training
activities are carried out through online learning systems wherein collaboration and interaction among partic-
ipants is encouraged. The structure of those interactions, reflected in a network graph, is known to contain
relevant statistical information about the dynamics of the learning process within the group, thus it should be
possible to extract such knowledge and exploit it either for improving the quality of the learning outcomes or
for driving the educational process toward the desired goals. In this work we focus on forums engagement,
modeling forums’ interactions as social graphs and studying the power of some of the graphs properties for
success/failure learning prediction. Our data source is a complete record of the activity of students in forums,
collected over two consecutive academic years of a computer networks course at the undergraduate level. The
results show that some of the measures under study are very good predictors of the students’ performance.
1 INTRODUCTION
During the recent years, the structure of a myriad of
natural and artificial complex systems has been ana-
lyzed, and as a result many of the structural proper-
ties of these objects have been discovered (Barab´asi,
2016). The examples are pervasive, from biological
networks to online social networks, or from the Inter-
net AS topology to the Bitcoin transactions.
In the field of education, online social networks
(OSNs) arise quite naturally when information tech-
nology is used in the classroom as an inherent part of
the learning activities. The network is just a depiction
of the existence and strength of interaction among the
students, or among the students with the instructors.
It has long been recognized that the structure of such
interactions is key to a deep comprehension of the in-
formation flow within the students’ group, and that in
the end it can be used to measure the quality of the
learning process and to infer students’ performance
directly from their pattern of interactions.
In this paper, we report on a dataset collected with
a software platform especially built for supporting on-
line participation of the students to design, carry out
and evaluate a set of online learning tasks and games.
After logging the activity during two full years, we
have performed a thorough network analysis with the
aim to understand the information flow within this
controlled group of students. We focus especially
on the participation in forums, modeling the relation-
ships taking place as social graphs. We found evi-
dence on the existence of statistically measurable cor-
relations between the learning activities and the struc-
ture of the network, on one side, and also between
the network structure alone and the academic achieve-
ments. On these premises, in this paper we systemat-
ically analyze the power of some of the graph prop-
erties and different statistical learning classifiers for
success/failure learning prediction.
The rest of the paper is organized as follows. Sec-
tion 2 summarizes some recent related work. The
methodology employed in the course under study is
reported in Section 3. Section 4 contains the main
results of the social networks analysis (SNA) applied
to the datasets. The proposed learning success/failure
prediction methodology is explained in Section 5. Fi-
nally, some concluding remarks are included in Sec-
tion 6.
2 RELATED WORK
Learning analytics (LA) is nowadays a vast field with
rich literature. Some good general references of the
field of LA can be found in (Ferguson, 2012; Greller
and Drachsler, 2012; Siemens, 2013), which exam-
ine the technological, educational, and political fac-
tors that drove the development of LA, review de-
Ferreira-Pires, O., Sousa-Vieira, M., López-Ardao, J. and Fernández-Veiga, M.
An Assessment of Statistical Classification for Socially Oriented Learning Methodologies.
DOI: 10.5220/0009570701470156
In Proceedings of the 12th International Conference on Computer Supported Education (CSEDU 2020) - Volume 2, pages 147-156
ISBN: 978-989-758-417-6
Copyright
c
2020 by SCITEPRESS – Science and Technology Publications, Lda. All rights reserved
147

veloping areas of LA research, and identify a series
of challenges. Complementary surveys can be read
in (Larusson and White, 2014; Jayaprakash et al.,
2014), surveying theories, strategies and tools, as well
as design and examples of implementation; and (Law-
son et al., 2016), for the ethical implications of LA.
A recent, valuable compilation of the state of the art
is (Viberg et al., 2018). The rest of this Section will
give an account of the use of LA for understanding
the effectiveness of learning techniques.
Starting with (Hommes et al., 2012), the influence
of social networks, motivation, social integration and
prior performance on learning is studied, and degree
centrality is proposed as a key predictor for students
learning. A good example of the application of game
theory for incentivizing participation in online educa-
tion is the work addressed in (Ghosh and Kleinberg,
2013), where authors investigate the optimal use of
a forum for single-answer and discussion-style ques-
tions, which lead to different levels of rewards that
can be meaningfully offered. (Agudo et al., 2014)
defines three system-independent classifications of
interactions in learning environments (agent, mode
and frequency) and evaluates the relationship of their
components with academic performance in informa-
tion and communication technologies or business ad-
ministration subjects and across two differentlearning
modalities, virtual learning environments supported
face-to-face and online learning, finding that it is only
significant for the second one.
Within the scope of the massive open online
courses (MOOCs), in (Brinton and Chiang, 2015) the
data are used to predict early dropout via analysis of
clickstream of video watching. A theoretical model
is developed in (Chung and Paredes, 2015) to inves-
tigate the association between social network proper-
ties, content richness in academic learning discourse
and performance, concluding that these factors can-
not be discounted in the learning process and must be
accounted for in the learning design. In (Fulantelli
et al., 2015) authors present a task-interaction frame-
work to support educational decision-making in mo-
bile learning, based on different types of interactions
and the tasks which are pedagogically relevant for the
learning activity. The framework helps to highlight
the most relevant indicators for specific learning sce-
narios of courses of art and tourism. (G´omez et al.,
2015) focuses on factors influencing academic per-
formance related to the interaction between the stu-
dent and the system, such as number of resources vis-
ited in the learning platform, number of forum posts
and views, etc. On top of that, a visualization tool
was designed and implemented to allow for further
investigation of the relevance of the study’s variables.
According to the results, there is a recurrent pattern
in the frequency of behaviors and performance across
different courses. In (Tabuenca et al., 2015) the pur-
pose is to explore the effect of tracking and monitor-
ing time devoted to learn psychology and geograph-
ical information systems topics with a mobile tool
on self-regulated learning. Variations in the chan-
nel, content and timing of the mobile notifications
to foster reflective practice are investigated and time-
logging patterns are described. The work addressed
in (Tempelaar et al., 2015) investigates the predic-
tive power of learning dispositions, outcomes of con-
tinuous formative assessment and other system gen-
erated data in modeling students’ performance and
their potential to generate informative feedback in a
course on mathematics and statistics methods. The
computer-assisted formative assessment seems to be
the best predictor for detecting underperforming stu-
dents. In (Brinton et al., 2016) the users’ benefit is
modeled with general utility functions. Authors eval-
uate the efficiency of the discussion forums in four
MOOC courses, in which they see the potential gains
that can be obtained through optimization, proposing
for further work to design mechanisms to enforce the
optimized networks in practice. In the study (Eid and
Al-Jabri, 2016) authors empirically examine the im-
pact of different ways of using social networking sites
and knowledge sharing and learning among tertiary
students, namely chatting and online discussion, cre-
ating knowledge and information content, file shar-
ing and enjoyment and entertainment. It turns out
that there are significant positive correlations between
both chatting and online discussion and file sharing
with knowledge sharing, and entertainment and en-
joyment with students’ learning. In contrast, (Mah,
2016) proposes a model that synthesizes generic skills
such as academic competencies, digital badges and
learning analytics. The main idea is that generic skills
can be represented as digital badges, which can be
used for LA algorithms to predict student success, and
to provide students with personalized feedback for
improvement. In (Putnik et al., 2016) authors present
a new model for students’ evaluation based on their
behavior during a course, and its validation through
an analysis of the correlation between social network
measures and the grades obtained by the students.
Recently, the experiment described in (Casey,
2017) presents a classification system for early detec-
tion of poor performers in a programming language
course, based on student effort data, such as the com-
plexity of the programs they write, and show how it
can be improved by the use of low-level keystroke an-
alytics. In (Hart et al., 2017) authors explore students’
achievement, combining various measures related to
CSEDU 2020 - 12th International Conference on Computer Supported Education
148

attitudes, cognitive skills as well as engagement with
the online system, to predict final grades in a calculus
course. (Liu et al., 2017) investigates what behavior
patterns learners with different characteristics of the
first year of the pharmacy degree demonstrate when
they interact with an adaptive learning environment.
Using both statistical analysis and data visualization
techniques, this study found that apart from learn-
ers’ cognitive ability, it is important to consider affec-
tive factors such as motivation in adaptive learning,
that lack of alignment among various components in
an adaptive system can impact how learners accessed
the system and that their performance and visualiza-
tions can revealfindings that can be missed otherwise.
In (Schumacher and Ifenthaler, 2018) authors inves-
tigate the expectations of undergraduate and master
level students in economic and business education to-
wards features of LA systems and their willingness
to use them. The findings show that students expect
features to support their planning and organization
of learning processes, provide self-assessments, de-
liver adaptive recommendations and produce person-
alized studies of their learning activities. The influ-
ence of learning design and tutor interventions on the
formation and evolution of communities of learning
is investigated in (Jan and Viachopoulos, 2018), em-
ploying SNA to study three differently designed dis-
cussion forums. The work addressed in (Galikyan
and Admiraal, 2019) explores the complex dynam-
ics of knowledge construction in two master level
courses on teacher education, through examining stu-
dents’ cognitive presence in online discussion forums
and their academic performance. The experiment de-
scribed in (Hern´andez et al., 2019) applies LA and
data mining techniques to explore the online discus-
sion forums of business students who participated
in simulation games, at the undergraduate and mas-
ter levels. The contents with predictive power over
learning results were related to uncertainty, time, in-
teraction, communication and collaboration. Finally,
in (Saqr and Alamro, 2019) authors study how SNA
can be used to investigateonline problem-basedlearn-
ing in a medical course, in particular if students’ po-
sition and interaction parameters are associated with
better performance.
Related to our prior work in this area, (Sousa et al.,
2017) focused on the quantitative characterization of
non-formal learning methodologies. To this end, we
used one custom software platform for discovering
what factors or variables have statistically signifi-
cant correlation with the students’ academic achieve-
ments in the course. The dataset was first collected
along several consecutive editions of an undergradu-
ate course. Next, we also measured the extent and
strength of social relations in an online social network
used among students of a master level course (Sousa
et al., 2018a). The dataset comprised again a period of
several academic years. Next, in (Sousa et al., 2018b)
we compare and combine the power of different clas-
sifiers for success/failure learning prediction, using
as inputs some of the features discovered in previous
works that have measurable correlation with the stu-
dents’ performance. Finally, in (Ferreira et al., 2019;
Ferreira et al., 2020) we focused on the analysis of
forums engagement through social networks analysis,
modeling forums’ interactions as social graphs. It is
the first time that we encourage and reward quality
participation in this activity in the undergraduate and
master level courses under study. In this work we ex-
tend this analysis and we show the power of some of
the graphs properties for success/failure learning pre-
diction.
3 EDUCATIONAL CONTEXT &
DATASET
We have taken as our educational environments the
2017/2018 and 2018/2019 editions of a course on
Computer Networks directed to undergraduatesof the
second year of the Telecommunications Technologies
Engineering degree. This course has a weekly sched-
ule that spans 14 weeks. The classroom activities are
organized as follows:
• Lectures, that blend the presentation of concepts,
techniques and algorithms with the practice of
problem-solving skills and discussion of theoreti-
cal questions.
• Laboratory sessions, where the students design
and analyze different network scenarios and with
different protocols, using real or simulated net-
working equipment. Moreover, in some of these
sessions students make a small programming as-
signment.
In both editions the activities are supported by a tai-
lored Moodle site to which the students and teachers
belong, and wherein general communication about
the topics covered takes place. To encourage net-
worked learning and collaborative work, different ac-
tivities are planned and carried out in the platform.
The students may gain different points by completing
or participating in these activities, and the resulting
rankings are eventually made public to the group. In
the editions analyzed in this work, these online activ-
ities were proposed:
1. Homework tasks, to be worked out previously to
the in-class or the laboratory sessions. With this
An Assessment of Statistical Classification for Socially Oriented Learning Methodologies
149

activityteachers encourage the students to prepare
some of the material in advance.
2. Quizzes, proposed before the midterm exams for
self-training.
3. Collaborative participation in forums. Several fo-
rums were created in Moodle to allow the students
to post questions, doubts or puzzles related to the
organization of the course, the content of the in-
class lectures or the laboratory sessions and the
programming assignments.
4. Optional activities, such as games, peer assess-
ment of tasks, etc.
The maximum score of tasks and quizzes is measured
in so-called merit points, and represents the total score
gained from engagement in online activities in the
continuous assessment. It is possible to obtain ex-
tra merit points by doing the optional activities in or-
der to compensate for low scores or late submissions
of some of the tasks or quizzes. Participation in fo-
rums, solving doubts or sharing resources, is also val-
ued with points or votes granted by the teachers or
the classmates. As new points or votes are obtained,
the so-called karma level of each student increases,
depending on different factors that take into account
the quality of the student’s actions and the compar-
ison with that of his classmates. Finally, the use of
the virtual classroom is also rewarded by the auto-
matic scoring of different actions carried out in the
platform related to the normal activity unfolded along
the term, like viewing resources, posting new threads,
replying to posts, etc. The so-called experience points
are awarded in a controlled environment with maxi-
mum values and their frequency set by the teachers.
The accomplishment of some tasks, the karma lev-
els and the experience points are ultimately converted
into certain benefits helpful to pass the subject: bonus
points, extra time or notes for the final exam, etc.
Students may pass the course after a single fi-
nal examination covering all the material (provided
the programming assignment meets the minimum re-
quirements), but they are encouraged to adhere to the
continuous assessment modality. In continuous as-
sessment, we weigh 50% the final exam, but the rest is
split as follows: 20% from the midterm exams, 20%
from the programming assignment and 10% coming
out from the merit points obtained by accomplish-
ing the online activities described previously, devised
as a tool to increase the level of participation. Stu-
dents have two opportunities to pass the exam (non-
exclusive), May and July.
To finish our description, in the 2017/2018 edi-
tion 135 students followed the course. Of the 125 stu-
dents which followed the continuous assessment 69
finally passed the course. And of the 10 students not
engaged in continuous assessment only 2 finally were
able to pass (one of them had an active participation
in the three forums). In the 2018/2019 course, the
same number of 135 students were enrolled. Of the
130 students which followed the continuous assess-
ment 56 finally passed the course. And none of the
students not engaged in continuous assessment was
able to pass (none of them participated in the forums
activity). At this point it is important to note that,
in average, the 2017/2018 cohort is getting better aca-
demic results in the degree than the 2018/2019 cohort.
4 ANALYSIS OF THE DATASETS
We have applied standard SNA techniques to mine the
data collected in forums in both editions. For such
purpose, we have recorded the events that took place
in each forum, users who posted new threads, users
who replied and the average valuations they received.
This information is represented as a graph where two
nodes, the users, are connected by an edge if one has
given a reply to an entry posted by the other. More-
over, self-edges represent new threads. The weight of
each edge is related to the points or votes obtained by
the reply or the new thread post.
An illustration of the graphs of both editions is
given in Figure 1, where every node is a student iden-
tified by his/her position in the ordered list of final
grades. The node with label 0 corresponds to the in-
structors.
4.1 Measures
Next, we report some of the typical measures of a
graph that can be obtained globally or individually for
each node, and their values in our datasets. Notice
that for some measures we consider simplified ver-
sions of the graphs, where the weight of each edge
is the sum of the weights of all the edges between
the underlying pair of nodes. Moreover, including
self-edges means including the opening of new forum
threads in the analysis.
4.1.1 Centrality
There exist a number of centrality measures for nodes
in a graph that were developed to capture different
properties of nodes’ position. The following are some
of the most commonly used, theoretically and empir-
ically:
• Degree centrality: just counts the number of
neighbors of each node. Implicitly, this considers
CSEDU 2020 - 12th International Conference on Computer Supported Education
150

13
10
36
90
0
106
69
23
2
19
135
30
26
1
44
5
51
98
125
61
6
78
76
22
4
27
8
46
58
24
15
14
82
42
94
88
75
55
65
74
73
37
96
108
29
41
70
124
64
100
17
25
49
9
66
12
118
97
32
123
47
11
40
23
0
91
25
67
118
70
60
8
116
90
10
21
31
101
122
3
33
69
17
125
80
2
132
53
16
1
46
5
12
73
94
4
20
14
52
86
11
63
92
99
58
98
15
113
102
42
9
22
61
52
130
134
34
38
41
74
79
35
97
43
68
89
106
71
85
128
112
77
83
6
88
24
26
103
93
66
62
Figure 1: Forums activity graphs. 2017/2018 edition (top)
and 2018/2019 edition (bottom).
Table 1: Summary of parameters of each graph.
2017/2018 edition 2018/2019 edition
degree
in 0.2219 0.2291
out 0.6763 0.7463
closeness 0.7569 0.7121
betweenness 0.6398 0.7979
eigenvector 0.8378 0.8832
# cliques
Size
2 178 164
3 185 103
4 94 27
5 21 5
6 2 0
number new threads µ-σ 2.0476− 1.9296 1.3589− 1.4856
number replies µ-σ 5.2698− 16.4358 3.9871− 15.1713
points new threads µ-σ 17.1761− 17.0845 59.5769− 64.5836
points replies µ-σ 43.2703− 142.5605 185.6412− 774.3123
that all the adjacent nodes are equally important.
• Closeness centrality: measures how easily a node
can reach other nodes, computing the inverse of
the average length of the shortest paths to all the
other nodes in the graph.
• Betweenness centrality: tries to capture the im-
portance of a node in terms of its role in con-
necting other nodes, computing the ratio between
the number of shortest paths that a node lies on
and the total number of possible shortest paths be-
tween two nodes.
• Eigenvector centrality: a measure based on the
premise that a node’s importance is determined by
how important or influentialits neighborsare. The
scores arise from a reciprocal process in which the
centrality of each node is proportional to the sum
of the centralities of the nodes it is connected to.
For the case of degree centrality, we considered sep-
arately the in-degree and out-degree centralities. In
this application, considering the simplified version of
the graphs, the in-degree centrality is the number of
neighbors whose replies a student receives, and the
out-degree centrality is the number of neighbors that
receive the replies given by a student. The results
in Table 1 reveal that the in-degree centrality values
are moderate, but the out-degree centrality is notice-
able, indicating a non-homogeneous distribution of
the number of neighbors that receive the replies sub-
mitted by the participants. A subset of few nodes act
as very active participants in forums (among them the
teachers). Nevertheless, more nodes act as generators
of new threads and recipients of information.
For the closeness centrality, the high values shown
in Table 1 are again indicative of the existence of few
very active contributors.
In the case of the betweenness centrality, the high
values observed in Table 1 suggest that in both net-
works few nodes act as bridges between different
parts of the graph.
Finally, for the eigenvector centrality, we consid-
ered the version of the graph with self-edges. Table 1
shows that the measured eigenvector centrality values
are noticeable. Again, this clearly means that there
are substantial differences among the nodes in their
role as sources or recipients of information.
4.1.2 Cliques
A clique is a maximal completely connected subgraph
of a given graph. So, cliques represent strongly tied
subcommunities where each member interacts with
any other member. And the crossclique number ac-
counts for the number of cliques a node belongs to.
Table 1 lists the number of cliques in the graphs by
their size. We can see that in both editions cliques
larger than 4 are not very likely.
4.1.3 Intensity and Quality of the Interactions
If we consider the non-simplified version of the
graphs, the in-degree centrality is the number of
replies a student receives, and the out-degree central-
ity is the number of replies given by a student. More-
An Assessment of Statistical Classification for Socially Oriented Learning Methodologies
151

over, the number of self-edges accounts for the num-
ber of new threads opened by each student. In addi-
tion to the intensity of interactions, another important
factor is their quality that can be measured taking into
account the weights of the edges. The results in Ta-
ble 1 show the mean value and the standard deviation
of this measures. We can observe that the variabil-
ity in the number of points received by the students is
quite high.
4.2 Correlations with Final Results
Table 2: Correlation between individual features and stu-
dent’s performance in the 2017/2018 edition of the course.
2017/2018 edition
ˆ
ρ (
ˆ
β, t, P(> |t|))
in degree 0.1962 (0.2179, 2.3165, 2.21·10
−2
)
out degree 0.1639 (0.1601, 1.9241, 5.65·10
−2
)
betweenness 0.1001 (15.9159, 1.1661, 2.46 · 10
−1
)
closeness 0.3319 (3.8679, 4.0731, 7.91 · 10
−5
)
eigenvector 0.3661 (8.0296, 4.5531, 1.17·10
−5
)
crossclique number 0.1137 (0.0141, 1.3264, 1.87·10
−1
)
number new threads 0.3031 (0.5095, 1.3408, 3.36· 10
−4
)
number replies 0.2271 (0.1735, 2.6994, 7.85·10
−3
)
points new threads 0.2933 (0.0518, 3.5511, 5.29·10
−4
)
points replies 0.2531 (0.0241, 3.0281, 2.95·10
−3
)
Table 3: Correlation between individual features and stu-
dent’s performance in the 2018/2019 edition of the course.
2018/2019 edition
ˆ
ρ (
ˆ
β, t, P(> |t|))
in degree 0.1415 (0.0952, 1, 6721, 9.68· 10
−2
)
out degree 0.1176 (0.1521, 1.6211, 5.97·10
−2
)
betweenness 0.0651 (15.4802, 0.9931, 3.23· 10
−1
)
closeness 0.1949 (2.2642, 2.2931, 2.34· 10
−2
)
eigenvector 0.1644 (3.2892, 1.9233, 5.67 · 10
−2
)
crossclique number 0.0669 (0.0176, 0.8241, 4.12· 10
−1
)
number new threads 0.1866 (0.0983, 2.191, 3.02· 10
−2
)
number replies 0.1048 (0.1023, 1.2161, 2.26·10
−1
)
points new threads 0.2109 (4.8951, 2.4882, 1.41·10
−2
)
points replies 0.1759 (6.8771, 2.0621, 4.12·10
−2
)
In order to check the relationship among the patterns
of participation in the forums and the achievements
of the course, we have measured the statistical corre-
lations between the features under study in this sec-
tion and the final grades of the students that followed
the continuous assessment. The sample correlations
ˆ
ρ were computed and the linear regression statistical
test was used to quantify such correlations. This test
checks the statistical significance of a linear fit of a
response variable on one factor variable. The esti-
mated linear coefficient is denoted by
ˆ
β. Under the
null hypothesis (meaning that there is no such linear
dependence) the test statistic follows a t-distribution
and high values are very unlikely to be observed em-
pirically (James et al., 2013).
The results in Tables 2 and 3 show a statisti-
cally significant positive dependence between many
of the considered factors and the students’ perfor-
mance, mainly in the 2017/2018 edition of the course.
5 LEARNING SUCCESS/FAILURE
PREDICTION
To check the power of the above selected measures to
predict students success/failure, we have considered
three popular statistical learning classifiers, namely
logistic regression (LR), linear discriminant analysis
(LDA) and support vector machines (SVM). These
classifiers function in two phases: during the train-
ing phase they are presented with a set of input-output
pairs. Each classifier then adjusts its internal param-
eters and during the testing phase they are presented
with new input data to predict the outputs. If actual
output values are available, the comparison with the
predicted ones is used to measure the performance of
the classifier. Details of implementation of each clas-
sifier can be found in (James et al., 2013).
In our application, the training sets consist of
the selected student data of the two offerings of the
course considered in the study (we have selected these
datasets due to the high similarities in the methodol-
ogy along the whole term in both offerings). The out-
put is the binary variable that represents the success or
failure of the students in the course, and the input is a
combination of the features described in the previous
section.
We use k-fold cross validation to consider multi-
ple training/testing set partitions. If the set of obser-
vations is the same for training and testing, this ap-
proach involves randomly divide it into k groups of
approximately equal size. The procedure is repeated
k times and each time k− 1 different groups of obser-
vations are treated as the training set and the other one
as the testing set. If one set of observations is used for
training and another different for testing, the first one
is divided into k groups of approximately equal size
and in each repetition of the procedure k − 1 differ-
ent groups are treated as the training set. In any case,
as this procedure results in k values, the performance
results are computed by averaging these values. We
have selected k = 5 in our tests and, in order to in-
crease the accuracy, we have repeated the procedure
10 times, being the final performance values obtained
by averaging again the 10 resulting values.
To evaluate the performance of decision we have
used three different criteria, which estimate the accu-
racy, the sensitivity and the precision. We consider the
following notation: PF the predicted failures, PS the
predicted successes, TPF the correct predicted fail-
ures, TPS the correct predicted successes, FPF the
incorrect predicted failures and FPS the incorrect pre-
dicted successes.
The accuracy criterion measures the total propor-
tion of the students whose final status, failing or pass-
CSEDU 2020 - 12th International Conference on Computer Supported Education
152
ing the course, was correctly predicted:
Accuracy =
TPF + TPS
PF + PS
.
The sensibility criterion measures the proportion of
the students whose final status, failing (or passing) the
course, was correctly predicted:
Sensibility =
TPF
TPF + FPS
or Sensibility =
TPS
TPS + FPF
.
The precision criterion is used to determine the pro-
portion of the students that actually failed (or passed)
the course, among all those that the method predicted
as such.
Precision =
TPF
TPF + FPF
or Precision =
TPS
TPS + FPS
.
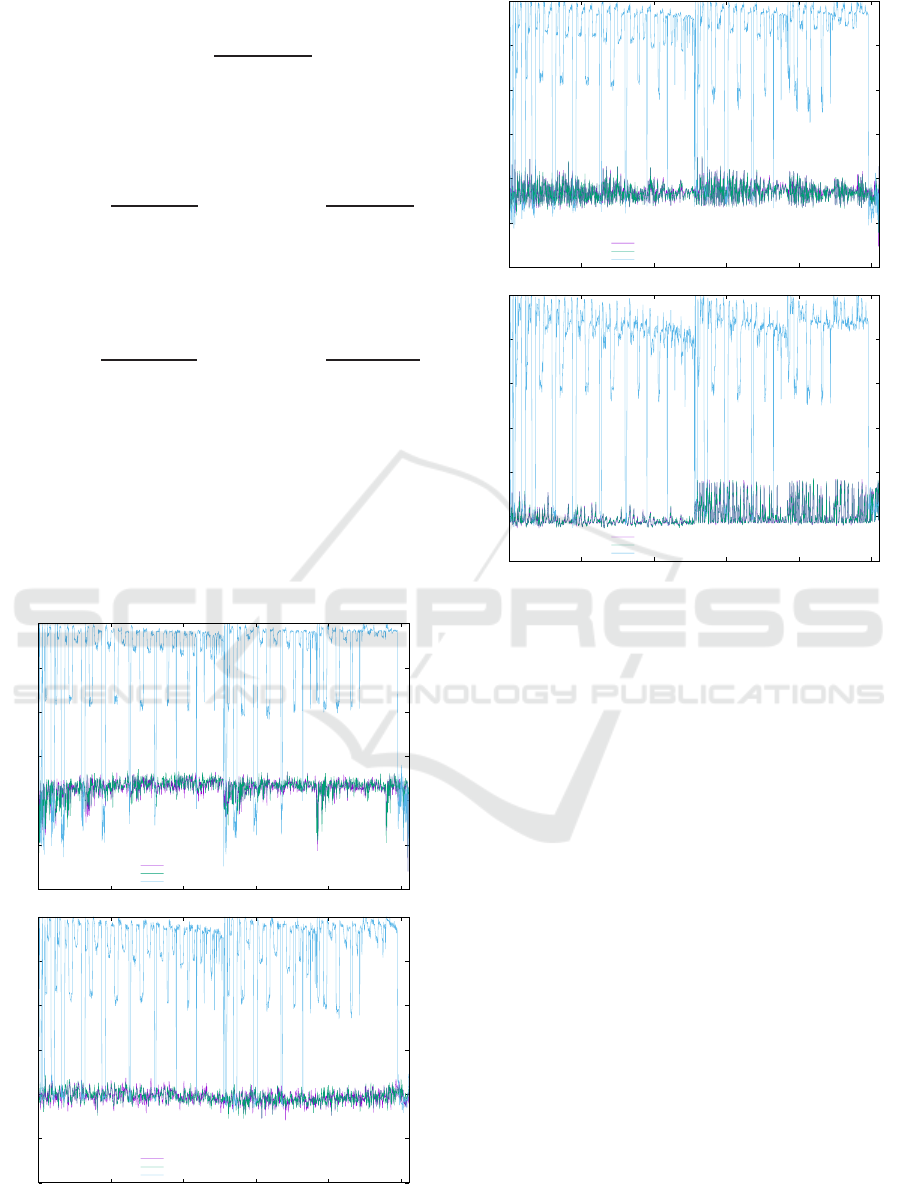
In Figures 2 and 3 we show the results obtained for the
accuracy with each classifier (considering the predic-
tion of successes), taking into account as predictors
the 2
10
− 1 combinations of the 10 measures under
study in this paper (crossclique number, in degree, out
degree, number new threads, number replies, points
new threads, points replies, betweenness, closeness
and eigenvector). The first two graphs consider the
same dataset for training and testing (2017/2018 and
0.4
0.5
0.6
0.7
0.8
0.9
1
200 400 600 800 1000
logistic regression
LDA
SVM
0.4
0.5
0.6
0.7
0.8
0.9
1
200 400 600 800 1000
logistic regression
LDA
SVM
Figure 2: Accuracy of each classifier for each subset of
predictors. 2017/2018 (top) and 2018/2019 (bottom).
0.4
0.5
0.6
0.7
0.8
0.9
1
200 400 600 800 1000
logistic regression
LDA
SVM
0.4
0.5
0.6
0.7
0.8
0.9
1
200 400 600 800 1000
logistic regression
LDA
SVM
Figure 3: Accuracy of each classifier for each subset of
predictors. 2017/2018 → 2018/2019 (top) and 2018/2019
→ 2017/2018 (bottom).
2018/2019, respectively) and the last two graphs con-
sider one of the datasets for training and the other one
for testing (2017/2018 → 2018/2019 and 2018/2019
→ 2017/2018, respectively).
We can see in the Figures that SVM is consistently
the classifier showing the better results (in terms of
accuracy) for most of the combinations of predictor
variables, whereas with logistic regression or LDA
accuracy rates above 70% are not achieved for any
combination of factors.
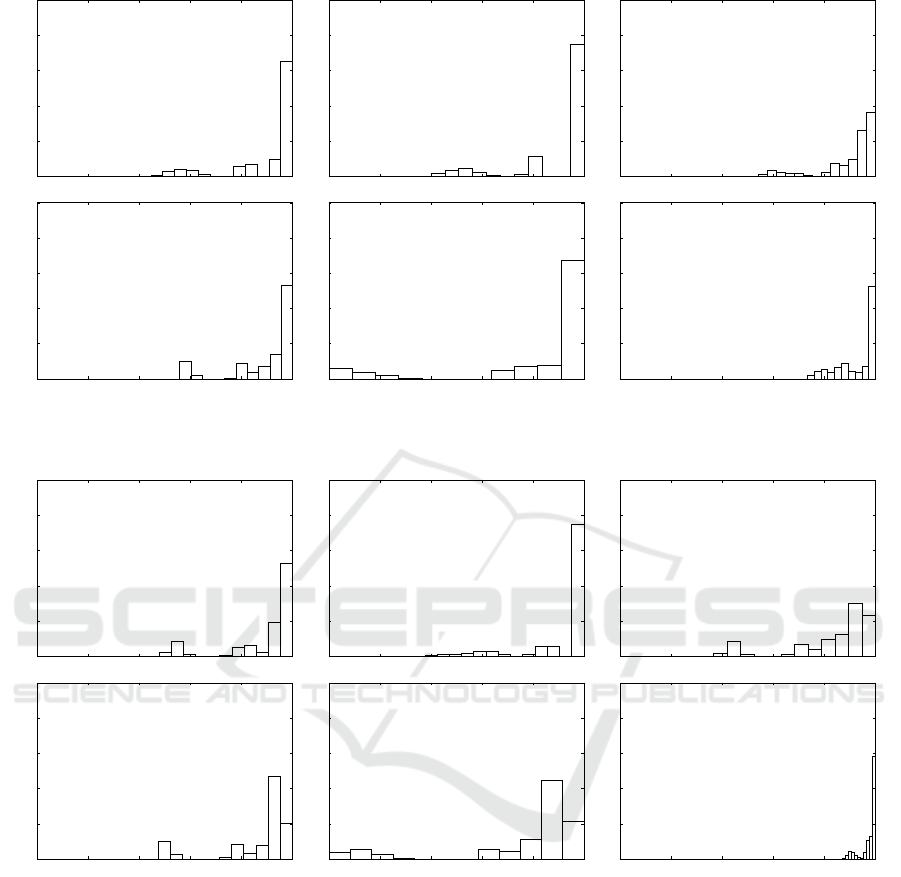
Focusing only on SVM classifiers, Figures 4 and 5
present the histograms of the accuracy, sensibility and
precision for the subsets of predictors under study.
These Figures show that almost all the combinations
achieve percentages above 80% for the three perfor-
mance indices.
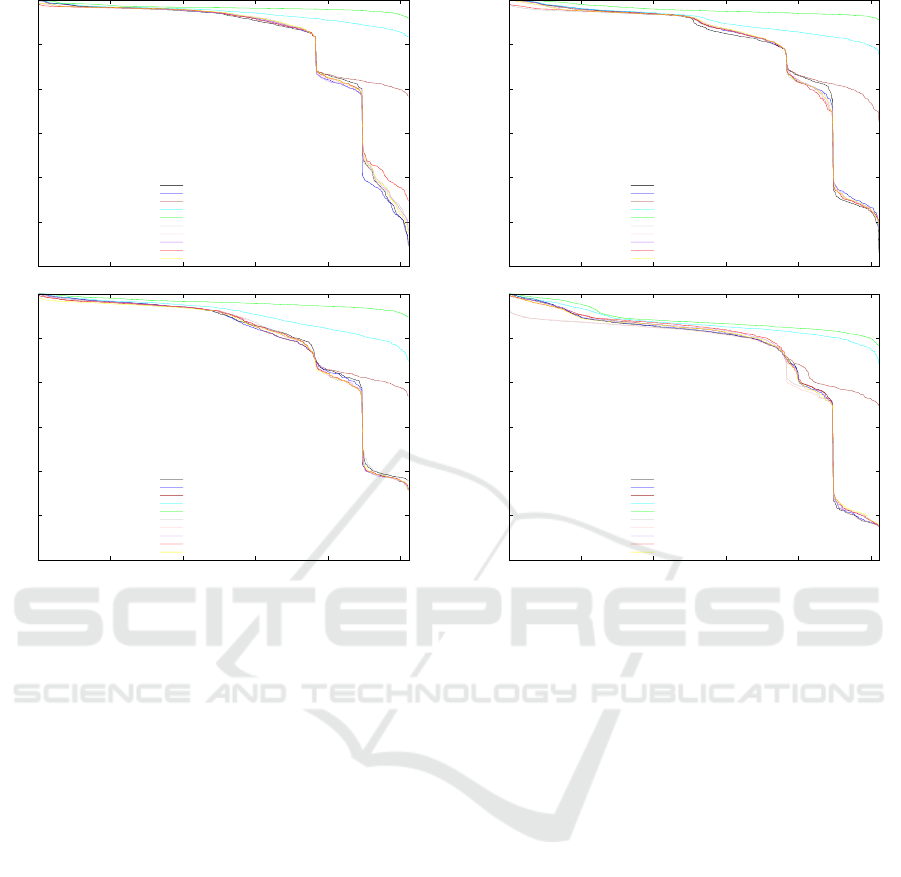
A closer look into the results unveils that the better
predictor variables, either individually or in combina-
tion with others, are the number of new threads, the
number of replies and the out degree of the node. This
can be seen clearly in Figures 6 and 7, where the re-
sults obtained for the accuracy of the SVM classifier,
taking into account as predictors all the 2
9
− 1 com-
binations including one of the former three variables
are depicted.
An Assessment of Statistical Classification for Socially Oriented Learning Methodologies
153
0
0.2
0.4
0.6
0.8
1
0 0.2 0.4 0.6 0.8 1
Accuracy
0
0.2
0.4
0.6
0.8
1
0 0.2 0.4 0.6 0.8 1
Sensibility
0
0.2
0.4
0.6
0.8
1
0 0.2 0.4 0.6 0.8 1
Precision
0
0.2
0.4
0.6
0.8
1
0 0.2 0.4 0.6 0.8 1
Accuracy
0
0.2
0.4
0.6
0.8
1
0 0.2 0.4 0.6 0.8 1
Sensibility
0
0.2
0.4
0.6
0.8
1
0 0.2 0.4 0.6 0.8 1
Precision
Figure 4: Histograms of the accuracy, sensibility and precision of the SVM classifier and the subsets of predictors. 2017/2018
(top) and 2018/2019 (bottom).
0
0.2
0.4
0.6
0.8
1
0 0.2 0.4 0.6 0.8 1
Accuracy
0
0.2
0.4
0.6
0.8
1
0 0.2 0.4 0.6 0.8 1
Sensibility
0
0.2
0.4
0.6
0.8
1
0 0.2 0.4 0.6 0.8 1
Precision
0
0.2
0.4
0.6
0.8
1
0 0.2 0.4 0.6 0.8 1
Accuracy
0
0.2
0.4
0.6
0.8
1
0 0.2 0.4 0.6 0.8 1
Sensibility
0
0.2
0.4
0.6
0.8
1
0 0.2 0.4 0.6 0.8 1
Precision
Figure 5: Histograms of the accuracy, sensibility and precision of the SVM classifier and the subsets of predictors. 2017/2018
→ 2018/2019 (top) and 2018/2019 → 2017/2018 (bottom).
Therefore, for further study in a future work, we leave
the task of analyzing the quality of classification when
these three variables are taken jointly with other vari-
ables sampled along the course, such as the merit
points, the karma level, or the attendance to the lec-
tures.
6 CONCLUSIONS
In this paper, we have reviewed the extent to what
structural properties of networks can help to explain,
and ultimately predict, the behavior and performance
of students in online social learning environments, es-
pecially the ones which integrate support for informal
learning activities. Provided these informal activities
are well designed to capture the students’ interest and
engage them in participation, the structure of the col-
laboration networks reflects and contains useful, sta-
tistically significant information to identify the indi-
vidual patterns of engagement, the communities, as
well as the correlation between network position or
activity and the academic performance of students.
The work presented here focuses on the study
of participation in the forums, modeling as social
CSEDU 2020 - 12th International Conference on Computer Supported Education
154
0.4
0.5
0.6
0.7
0.8
0.9
1
100 200 300 400 500
with crossclique
with in degree
with out degree
with number new threads
with number replies
with points new threads
with points replies
with closeness
with betweenness
with eigenvector
0.4
0.5
0.6
0.7
0.8
0.9
1
100 200 300 400 500
with crossclique
with in degree
with out degree
with number new threads
with number replies
with points new threads
with points replies
with closeness
with betweenness
with eigenvector
Figure 6: Accuracy of the SVM classifier for each subset
of predictors. 2017/2018 (top) and 2018/2019 (bottom).
graphs the relationships developed during two edi-
tions of a typical undergraduate course and studying
the power of some of the graph measures for learning
success/failure prediction. The results of our study re-
veal that among the statistical learning classifiers un-
der study, logistic regression, LDA and SVM, the last
one is the most appropriate for this application and
that several of the measures under study, especially
the number of new threads, the number of replies and
the out degree, i.e, the number of neighbors that re-
ceive the replies given by a student, are very good
predictors of the students’ performance.
As further work, we are going to extend this study,
taking into account the topic of the forum threads (re-
lated to the lessons, to the programming activities or
to the organization of the course), in order to analyze
the resulting graphs separately. Moreover, we are go-
ing to check the quality of classification when the best
forum predictors are taken jointly with other variables
sampled along the course, such as the merit points, the
karma level, or the attendance to the lectures.
0.4
0.5
0.6
0.7
0.8
0.9
1
100 200 300 400 500
with crossclique
with in degree
with out degree
with number new threads
with number replies
with points new threads
with points replies
with closeness
with betweenness
with eigenvector
0.4
0.5
0.6
0.7
0.8
0.9
1
100 200 300 400 500
with crossclique
with in degree
with out degree
with number new threads
with number replies
with points new threads
with points replies
with closeness
with betweenness
with eigenvector
Figure 7: Accuracy of the SVM classifier for each subset of
predictors. 2017/2018 → 2018/2019 (top) and 2018/2019
→ 2017/2018 (bottom).
REFERENCES
Agudo, A., Iglesias, S., Conde, M., and Hern´andez, A.
(2014). Can we predict success from log data in
VLEs? classification of interactions for learning an-
alytics and their relation with performance in VLE-
supported F2F and online learning. Computers in Hu-
man Behavior, 31:542–550.
Barab´asi, A. (2016). Network science. Cambridge Univer-
sity Press.
Brinton, C., Buccapatnam, S., Wong, F., Chiang, M., and
Poor, H. (2016). Social learning networks: Efficiency
optimization for MOOC forums. In INFOCOM’16,
IEEE Conference on Computer Communications.
Brinton, C. and Chiang, M. (2015). MOOC performance
prediction via clickstream data and social learning
networks. In INFOCOM’15, IEEE Conference on
Computer Communications.
Casey, K. (2017). Using keystroke analytics to improve
pass-fail classifiers. Journal of Learning Analytics,
4(2):189–211.
Chung, K. and Paredes, W. (2015). Towards a social net-
works model for online learning & performance. Ed-
ucational Technology & Society, 18(3):240–253.
Eid, M. and Al-Jabri, I. (2016). Social networking, knowl-
edge sharing and student learning: The case of univer-
sity students. Computers & Education, 99:14–27.
An Assessment of Statistical Classification for Socially Oriented Learning Methodologies
155

Ferguson, R. (2012). Learning analytics: Drivers, develop-
ments and challenges. International Journal of Tech-
nology Enhanced Learning, 4(5-6):304–317.
Ferreira, O., Sousa, M., L´opez, J., and Fern´andez, M.
(2019). Investigating interaction patterns in educa-
tional forums: A social networks analysis approach.
In CSEDU’19, International Conference on Computer
Supported Education.
Ferreira, O., Sousa, M., L´opez, J., and Fern´andez, M.
(2020). Studying relationships between network
structure in educational forums and students’ perfor-
mance. In Communications in Computer and In-
formation Science. Computer Supported Education.
Springer.
Fulantelli, G., Taibi, D., and Arrigo, M. (2015). A frame-
work to support educational decision making in mo-
bile learning. Computers in Human Behavior, 47:50–
59.
Galikyan, I. and Admiraal, W. (2019). Students’ engage-
ment in asynchronous online discussion: The relation-
ship between cognitive presence, learner prominence
and academic performance. The Internet and Higher
Education, 43.
Ghosh, A. and Kleinberg, J. (2013). Incentivizing partici-
pation in online forums for education. In EC’13, ACM
Conference on Electronic Commerce.
Greller, W. and Drachsler, H. (2012). Translating learning
into numbers: A generic framework for learning ana-
lytics. Educational Technology & Society, 15(3):42–
57.
G´omez, D., Hern´andez, A., Garc´ıa, F., and Ther´on, R.
(2015). Tap into visual analysis of customization of
grouping of activities in eLearning. Computers in Hu-
man Behavior, 47:60–67.
Hart, S., Daucourt, M., and Ganley, C. (2017). Individual
differences related to college students’ course perfor-
mance in calculus II. Journal of Learning Analytics,
4(2):129–153.
Hern´andez, A., Perera, A., and Serradell, E. (2019). Apply-
ing learning analytics to students’ interaction in busi-
ness simulation games. The usefulness of learning an-
alytics to know what students really learn. Computers
in Human Behavior, 92:600–612.
Hommes, J., Rienties, B., Grave, W., Bos, G., Schuwirth,
L., and Scherpbier, A. (2012). Visualising the invisi-
ble: A network approach to reveal the informal social
side of student learning. Advances in Health Sciences
Education, 17(5):743–757.
James, G., Witten, D., Hastie, T., and Tibshirani, R. (2013).
An introduction to statistical learning with applica-
tions in R. Springer.
Jan, S. and Viachopoulos, P. (2018). Influence of learn-
ing design of the formation of online communities of
learning. International Review of Research in Open
and Distributed Learning, 19(4).
Jayaprakash, S., Moody, E., Laur´ıa, E., Regan, J., and
Baron, J. (2014). Early alert of academically at-risk
students: An open source analytics initiative. Journal
of Learning Analytics, 1(1):6–47.
Larusson, J. and White, B. (2014). Learning analytics:
From research to practice. Springer.
Lawson, C., Beer, C., and Rossi, D. (2016). Identification of
‘at risk’ students using learning analytics: The ethical
dilemmas of intervention strategies in a higher edu-
cation institution. Educational Technology Research
and Development, 64:957–968.
Liu, M., Kang, J., Zou, W., Lee, H., Pan, Z., and Corliss,
S. (2017). Using data to understand how to better de-
sign adaptive learning. Technology, Knowledge and
Learning, 22:271–298.
Mah, D. (2016). Learning analytics and digital badges: Po-
tential impact on student retention in higher education.
Technology, Knowledge and Learning, 21:285–305.
Putnik, G., Costa, E., Alves, C., Castro, H., Varela, L., and
Shah, V. (2016). Analysis of the correlation between
social network, analysis measures and performance of
students in social network-based engineering educa-
tion. International Journal of Technology and Design
Education, 26(3):413–437.
Saqr, M. and Alamro, A. (2019). The role of social network
analysis as a learning analytics tool in online problem
based learning. BMC Medical Education, 19.
Schumacher, C. and Ifenthaler, D. (2018). Features students
really expect from learning analytics. Computers in
Human Behavior, 78:397–407.
Siemens, G. (2013). Learning analytics: The emer-
gence of a discipline. Americal Behavioral Scientist,
50(10):1380–1400.
Sousa, M., L´opez, J., and Fern´andez, M. (2018a). The net-
work structure of interactions in online social learning
environments. In Communications in Computer and
Information Science. Computer Supported Education.
Springer.
Sousa, M., L´opez, J., Fern´andez, M., Ferreira, O.,
Rodr´ıguez, M., and Rodr´ıguez, R. (2018b). Predic-
tion of learning success/failure via pace of events in a
social learning network platform. Computer Applica-
tions in Engineering Education, 26(6):2047–2057.
Sousa, M., L´opez, J., Fern´andez, M., Rodr´ıguez, M., and
L´opez, C. (2017). Mining relations in learning-
oriented social networks. Computer Applications in
Engineering Education, 25(5):769–784.
Tabuenca, B., Kalz, M., Drachsler, H., and Specht, M.
(2015). Time will tell: The role of mobile learning
analytics in self-regulated learning. Computers & Ed-
ucation, 89:53–74.
Tempelaar, D., Rienties, B., and Giesbers, B. (2015). In
search for the most informative data for feedback gen-
eration: Learning analytics in a data-rich context.
Computers in Human Behavior, 47:157–167.
Viberg, O., Hatakka, M., Balter, O., and Mavroudi, A.
(2018). The current landscape of learning analytics
in higher education. Computers in Human Behavior,
89:98–110.
CSEDU 2020 - 12th International Conference on Computer Supported Education
156
