
Assessment of the Completeness of OpenStreetMap
and Google Maps for the Province of Pavia (Italy)
Marica Franzini
a
, Laura Annovazzi-Lodi
b
and Vittorio Casella
c
Department of Civil Engineering and Architecture, University of Pavia, Via Ferrata 3, Pavia, Italy
Keywords: OpenStreetMap, Google Maps, Comparison, Completeness.
Abstract: Free access web-based mapping is nowadays largely used in several areas such as navigation, location-based
services or when it is necessary to obtain quickly geographical information. Some of them are based on
volunteers’ work, among which OpenStreetMap (OSM), while some others were design for commercial
purposes, such as Google Maps (GM). Given the variety of contributors and their heterogeneity, one of the
critical aspects of OSM is the homogeneity and quality level of its information; furthermore, GM is also
largely consulted but presents inhomogeneity between densely populated and rural areas. The paper aims at
analysing the buildings completeness of OSM and GM over the Province of Pavia, in Northern Italy: the
applied method will be presented together with the results obtained at two different time frames (spring 2018
and winter 2018). Finally, a quick review about the volunteers that had effectively contributed to OSM will
be presented.
1 INTRODUCTION
With the advent of the Internet, crowdsourcing was
born, a way in which a project is developed by a
plurality of people who have not been recruited and
trained for the purpose but collaborate voluntarily and
generally for free. The tools with which these projects
are completed are usually specific web platforms.
There are examples of crowdsourcing also in the
cartography field: in this case we speak of
crowdmapping or Volounteered Geographic
Information (VGI) (Goodchild, 2007). The most
significant example is OpenStreetMap (OSM), a
detailed map of the whole world created and
constantly updated, extended and perfected by a
multiplicity of volunteers equipped with smartphones
and/or GNSS receivers. OSM is largerly used for
several applications: navigation (Mobasheri, 2017;
Roussel & Zipf, 2017), location-based servicies
(Ciepluch et al., 2009; Krek et al., 2009) or when it is
necessary to obtain quickly geographical information
such as in crisis mapping (Meier, 2012; Saganeiti et
al. 2017). Given the variety of contributors and their
heterogeneity (Goodchild, 2008), one of the critical
a
https://orcid.org/0000-0002-3921-5178
b
https://orcid.org/0000-0003-3939-9170
c
https://orcid.org/0000-0003-2086-7931
aspects of crowdmapping is the homogeneity and
quality level of the data.
On the other hand, also commercial products are
sometimes used as alternative to the official
cartography. Since its launch in 2005, Google Maps
has progressively spread within several communities
thanks to its accessibility. It has allowed to an
increasing number of people, also not-experts one, to
access geographical information. This sometimes
caused the illusion that information availability is the
only important matter, forgetting data quality. This
issue is instead particularly significant for
commercial cartographies since they are usually
producted via automatic processing.
According to the International Organization for
Standardization (ISO), spatial data quality includes
six main groups of elements: completeness, logical
consistency, positional accuracy, thematic accuracy,
temporal quality and usability (ISO, 2013). The
present paper focus on the first one, the completeness,
that is traditionally subdivided into two quality
elements: omission and commission. Omission
represents a case in which a feature, that must be
mapped, is missing, whereas commission represents
270
Franzini, M., Annovazzi-Lodi, L. and Casella, V.
Assessment of the Completeness of OpenStreetMap and Google Maps for the Province of Pavia (Italy).
DOI: 10.5220/0009564302700277
In Proceedings of the 6th International Conference on Geographical Information Systems Theory, Applications and Management (GISTAM 2020), pages 270-277
ISBN: 978-989-758-425-1
Copyright
c
2020 by SCITEPRESS – Science and Technology Publications, Lda. All rights reserved

a case in which a feature exists on the map, but not in
reality.
OpenStreetMap is now a well-established reality,
and some papers, aimed its quality, have begun to
appear in the last years in scientific journals,
including researches on its completeness in various
countries. The approach is always quite similar and is
based on the comparison of OSM to corresponding
reference cartography which may be obtained from
either an authoritative or commercial dataset. As
reported in several papers (Girres & Touya, 2010;
Haklay et al. 2010; Kounadi, 2009), early studies
focused on OSM road networks, because it was the
primarly subjets for which it was born. Analysis was
then extended to other features such as building, as
reported in Goetz & Zipf (2012) for France and Hecht
et al. (2013) for Germany. Some authors have
proposed a visual comparison (Ciepluch et al., 2010;
Haklay et al. 2010; Koukoletsos et al., 2011) while
others have implemented automatic processing
(Brovelli & Zamboni, 2018; Hecht et al., 2013); both
options have advantages and disadvantages which
will be discussed further in Section 2.
Quality assessment of Google Map is instead a
topic not yet sufficiently addressed. It is possible to
find in literature several examples of accuracy
assessment for Google Earth imagery (Mohammed et
al., 2013; Potere, 2008) but fewer for Google Maps
(Boottho & Goldin, 2017), especially using an
approach similar to that used to evaluate OSM.
Instead, Google Maps was sometimes used as
reference datasets, as reported in Ciepluch et al.
(2010).
The paper will report an experience on the
assessment of buildings completeness for
OpenStreetMap and Google Maps. A visual
comparison will be proposed, as reported in Section
2, and main results will be discussed in Section 3,
reffered to two time frames, spring and winter 2018.
The Results section will also present a quick review
about the volunteers that have effectively contributed
to OSM construction.
2 COMPLETENESS ANALYSIS
OpenStreetMap and Google Maps were tested in
terms of completeness on the whole territory of the
Province of Pavia, one of the twelve administrative
areas of Lombardy Region in Northern Italy. The
study area covers almost 3000 km
2
and it is
subdivided in 188 municipalities (Figure 1). Data
collection and management were performed using
QGIS (version 2.18.3 and 3.2.3) while specific codes
were appositely realized in Matlab (R2018b) for the
statistical analysis of the results.
In literature, several examples of completeness
assessment are reported. They follow both visual and
automatic approach, as already reported in Section 1.
The former is time consuming, especially for large
areas, but guarantees a full control of the results
quality; the latter can instead be easily executed also
on large dataset but does not ensure the correct
processing all the different cases that could occur in
cartography.
Figure 1: Position of the Province of Pavia in the Italian
framework and its subdivision in 188 Municipalities.
The present paper follows a visual comparison
approach for several reasons. The manual approach
does not require a reference cartography, which is
instead mandatory for automatically data-processing;
currently one-third of the analysed municipalities
have not shared their topographic database yet. This
condition would have been particularly restrictive, for
OSM, if a vector comparison strategy was chosen, as
suggested by other authors (Brovelli & Zamboni,
2018); the whole Pavia’s territory would have not
been examined. Even more important, visual
comparison is suitable to be applied to Google Maps
data. Indeed, GM is available in raster format only,
even if vector native, and accessible only with web-
based mapped services. As better explained in the
following, the visual approach has allowed to load
GM data in a GIS environment and check manually
the completeness. Finally, the visual comparison has
ensured an overall control of the processing stages
and results.
As reported in the title, the paper analyses only
completeness which can be subdivided into two
Assessment of the Completeness of OpenStreetMap and Google Maps for the Province of Pavia (Italy)
271
quality parameters, omission and commission,
according to ISO standard (ISO, 2013). Besides,
among the various cartography features, this study
focuses on building completeness, since their
presence is interesting for several applications such as
urban planning or civil engineering. The main
limitation of performing visual inspection for
buildings presence on two cartographies (OSM and
GM), is the impossibility to perform an exhaustive
examination on all the buildings. For this reason, only
a subset of constructions has been identified and used
as representative sample. The location and number of
these elements were carefully selected: samples were
chosen not only in the main built-up areas but also in
the surroundings (industrial installations, hamlets,
etc.) and elements number has been proportional to
the municipalities size (from approximately 50
buildings for the smaller municipalities up to more
than 1000 for the larger cities).
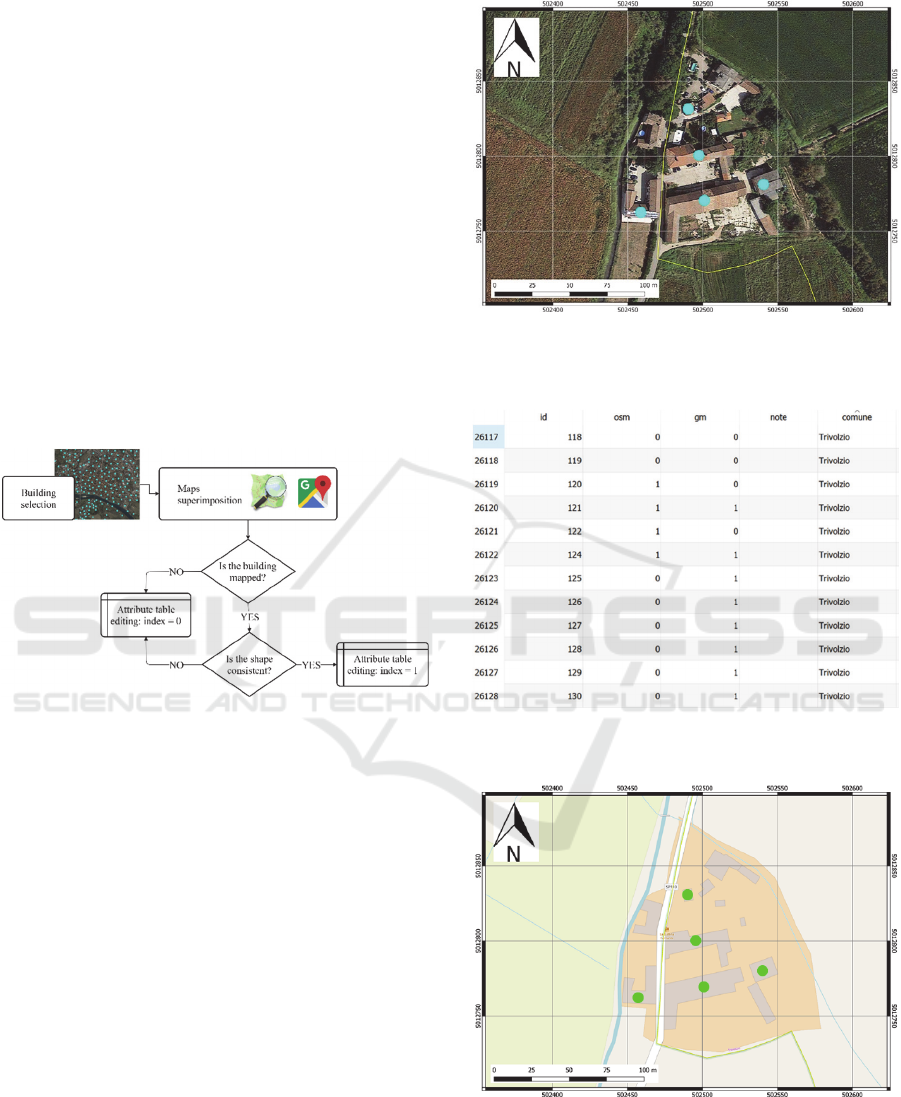
Figure 2: Flowchart for the database construction.
Figure 2 reports the flowchart for the database
construction. As reported before, all the steps were
performed inside QGIS environment. Google
Satellite images was chosen as reference data
because sufficiently updated. The imagery was
acquired between March 2017 and March 2018, while
the Regional orthophoto is older (2015), and it can be
considered the state of the art of the built-up area for
the Province. Images were displayed in QGIS and
buildings samples were chosen in a blind approach,
meaning that elements were selected before verifying
their presence in OSM and GM cartographies,
guarantying a non-prejudicial choice. A shapefile of
points was then created for the collected features.
Figure 3 shows an example of the selected buildings,
that were marked with a point, for a small hamlet; not
all the constructions were chosen but, those marked,
represent well the area. Figure 4 reports an excerpt of
the attribute table that is composed by five fields:
points ID, indices that represent the buildings
presence or absence in OSM and GM (better
explained later), notes and municipalities name.
Figure 3: An example of selected buildings for a hamlet of
Trivolzio, a small village 10 km far from Pavia. Google
Satellite image is the background.
Figure 4: An excerpt of the attribute table of the created
punctual shapefile.
Figure 5: Categorized results for OSM cartography: the
green dots represent constructions that are present and have
consistent shapes.
GISTAM 2020 - 6th International Conference on Geographical Information Systems Theory, Applications and Management
272
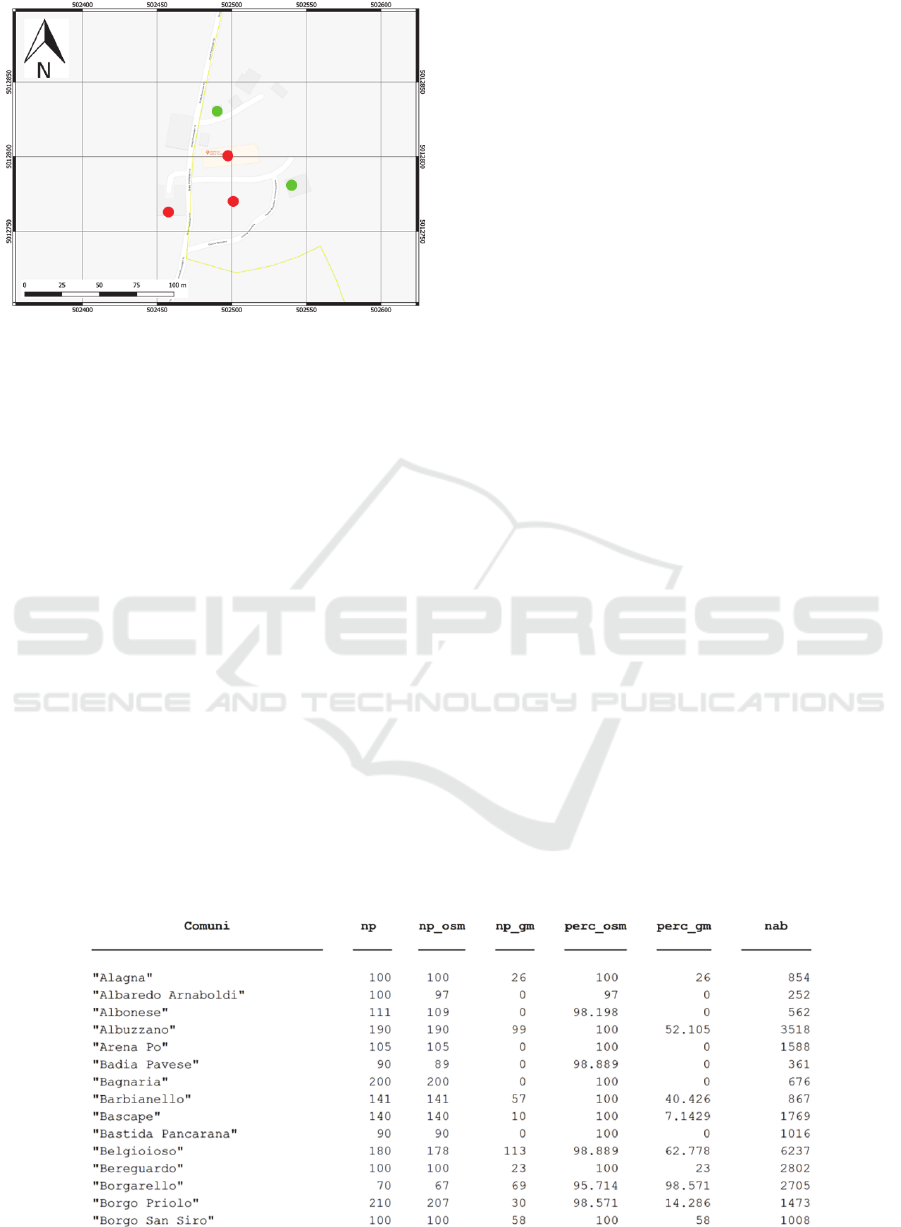
Figure 6: Categorized results for GM cartography: the green
dots represent constructions that are present and have
consistent shape whereas red ones those buildings not
present or with a significant shape diversity.
OpenStreetMap and Google Maps were then
loaded too: the former thanks to a shapefile (available
on the official website https://www.openstreetmap
.org/); the latter, using two plugins to access web-
based map services. They were used according to
software version, OpenLayers for QGIS release
2.18.3 and QuickMapServices for release 3.2.3.
Once the cartographies were visualized, two
controls were performed: verify the building presence
or absence and check if the shape of the mapped
construction is consistent to the real one. For each
municipality, the collected points were alternately
superimposed on OSM and GM cartographies for
each municipality and the indices were edited
according to this rule: the index assumes value equal
to 1 if the element is mapped and there is shape
consistency; the index is 0 if the construction is not
mapped or the shape is significantly different. Figure
4 shows also an example of this classification where
the values 1 or 0 were attributed to OSM and GM
indices, in the second and third columns. The adopted
strategy allows to categorize the points symbology,
simplifying the identification between the two status:
present and correctly mapped or not. Figure 5 and 6
show the obtained results for OSM and GM
respectively: a green dot means that the building is
present, and its shape is consistent with the real one,
while a red dot means that the construction is not
present, or its shape is inconsistent. Observing the
images, it is immediately evident that OSM is fully
mapped in this small area: in Figure 5, all points are
green. Instead GM has some lacks: two buildings are
completely missing (the two red dots on the lower left
part of Figure 6) while one is present but with a
clearly error in the shape reconstruction (central red
point). All three were classified as omission in the
corresponding record of the attribute table.
The so-obtained shapefile was then imported and
processed in specific Matlab functions, especially
written for statistical analysis. For each municipality
some figures were computed: the total number of
collected points, the buildings correctly mapped
(flagged with 1) and the completeness expressed as
the ratio between the two previous numbers, both for
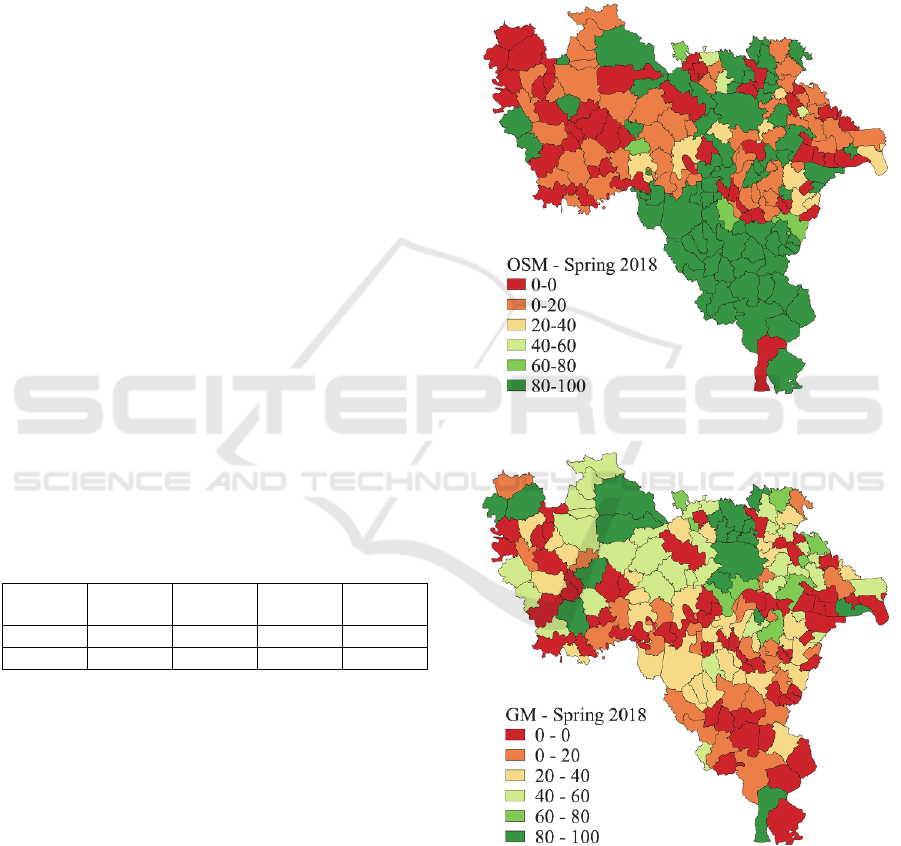
OSM and GM. Figure 7 shows an excerpt of the
output listing the figure just described and, in the last
column, the number of inhabitants. Main descriptive
statistic figures were then calculated for the whole
Province processing data in a traditional way and
weighting it according to population; results will be
shown in the next section.
The proposed methodology is more related to
omission which represent a feature that must be
mapped but is instead missing. Nevertheless, in the
consistency check step, it was asked to operators to
verify also commissions (features existing on the map
but not in the reality). Surprisingly no commissions
were found, therefore Section 3 will discuss only the
omission.
Figure 7: Excerpt of the summary table generated by Matlab code.
Assessment of the Completeness of OpenStreetMap and Google Maps for the Province of Pavia (Italy)
273
A final remark must be done on timing: data
collection ended in early spring 2018 and statistical
analysis was performed first time in May. During
summertime, between July and August, Google made
a significant updating of its maps so, during the
fall/winter, a complete review was carried out; the
revision was performed on OSM too. The paper will
present the completeness results for both time frames,
spring 2018 and winter 2018, to witness of the
activities that are continuously made on such
products.
3 RESULTS
Data collection was started at the beginning of the
year 2018 and a first statistical elaboration was
obtained in late spring. During summertime, between
July and August, GM made a significant updating of
its maps, so a complete review was carried out and
new analysis were performed in winter.
3.1 Spring 2018 Results
First results refer to May 2018, when the presence of
more than 27000 buildings were verified above the
188 municipalities of the Province of Pavia. The
distribution is not uniform since some municipalities
did not have neither OSM nor GM cartographies
available at that time; in these cases, the shapefile has
not been populated and the ratio between mapped
buildings and total ones was directly set equal to 0.
Table 1: Synthesis of the spring 2018 results.
Empty Mapped Arithm.
Mean %
Weigh.
Mean %
OSM 50 138 42.61 56.01
GM 64 124 28.34 56.20
Table 1 illustrates final synthesis where, in the
first two columns, the maps availability is reported.
OSM has 50 municipalities without cartography that
represents more than the 25% of the overall territory;
GM has 14 more that increase its lack to the 34%. The
third column shows the overall completeness
obtained averaging the values determined for each
municipality: Open Street Map presents acceptable
value around 43% while Google Maps reaches only
the 28%.
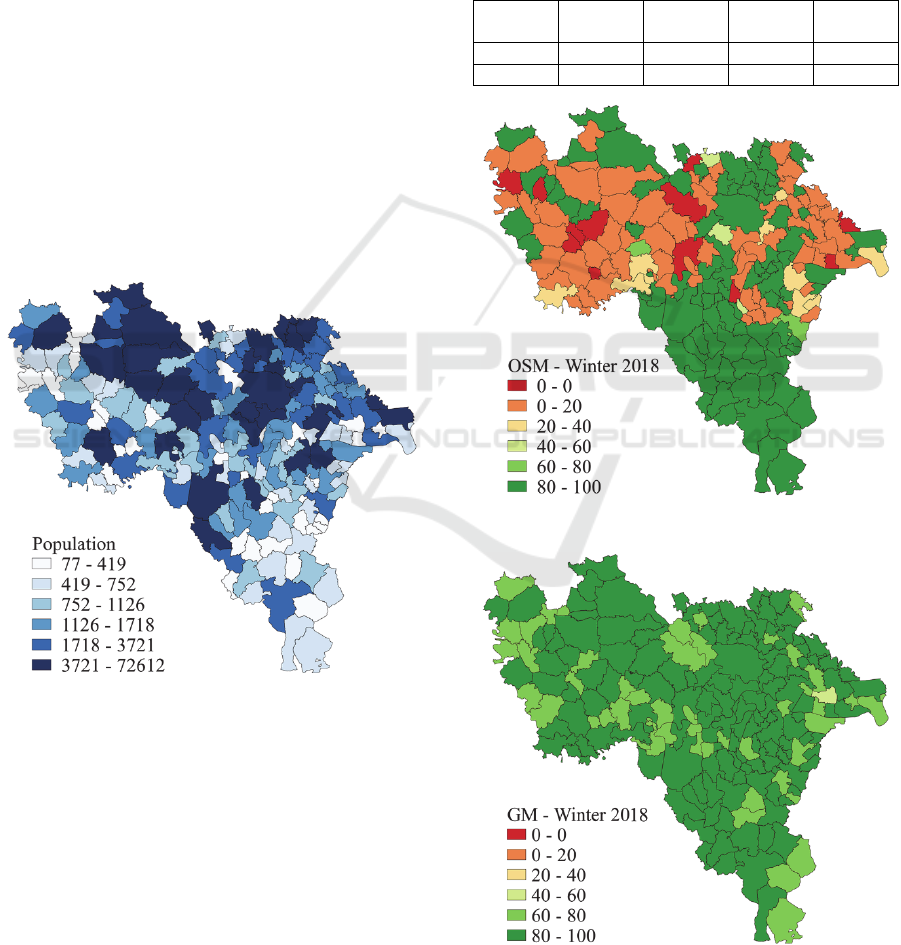
Data can be represented more efficiently with a
map as shown in Figure 8 and 9 in which the
completeness percentages were reported with
graduated colour that changes from red, meaning 0%
to green, corresponding to 100%. Comparing the
maps two aspects stand out:
GM presents more hues while OSM has more
cases where municipalities are completely
mapped or totally empty;
the spatial distribution is different since OSM is
more complete in the southern part while GM in
the northern area near the border with the
Province of Milan.
Figure 8: Overall results for OSM completeness in spring.
Figure 9: Overall results for GM completeness in spring.
The spatial distribution observed in these figures
has led out a reflection about mapping strategy: while
OSM is based only on voluntary initiatives, GM has
commercial basis and most likely people distribution
is relevant for its implementation. For this reason, a
GISTAM 2020 - 6th International Conference on Geographical Information Systems Theory, Applications and Management
274
new analysis was conducted taking into consideration
this new variable; Figure 10 shows people
distribution above the Province of Pavia. The map
illustrates clearly as this parameter is very irregular,
ranging between few tens (Villa Biscossi, a small
village in the countryside) to some thousands (Pavia,
the Province’s capital) of people; besides population
are not homogeneous spatially distributed as most of
them lives in northern part of the Pavia’s territory,
near Milan. Comparing Figure 10, population
distribution, to Figure 9, GM completeness, similar
behaviours are evident, which support this
hypothesis. Using this additional information, a new
analysis was conducted in which the overall
completeness percentage was determined weighting
each municipality values according to its population.
The last column of Table 1 reports these new results:
OSM passes from 42% to 56% while GM from 28%
to 56%. These values demonstrate as Google, even if
less complete, has mapped the most densely
populated municipalities and according to this new
point of view the two cartography reach equal levels
of completeness.
Figure 10: Population distribution in Province of Pavia.
3.2 Winter 2018 Results
In summer 2018, Google Maps has strongly updated
its cartography on the Pavia’s territory. For this
reason, a complete review of the dataset was
performed, and new analysis were conducted. The
chosen data structure (based on the use of punctual
shapefile superimposed to cartography) has allowed
to easily inspect the correctness of the classification
(1 if present or 0 otherwise). Moreover, new features
were collected for municipalities previously
classified empty which present cartography now;
total amount of buildings reached almost 31000 units.
Table 2 reports the new statistics: columns 2 and
3 indicates the updated synthesis on maps
availability: GM is now present on the whole territory
(before only the 66% of the municipalities was
mapped); OSM has also improved its results reaching
the 94% (less than 75% before).
Table 2: Synthesis of the winter 2018 results.
Empty Mapped Arithm.
Mean %
Weigh.
Mean %
OSM 12 176 53.74 65.09
GM 0 188 85.53 91.10
Figure 11: Overall results for OSM completeness in winter.
Figure 12: Overall results for GM completeness in winter.
Assessment of the Completeness of OpenStreetMap and Google Maps for the Province of Pavia (Italy)
275
Matlab modules were executed again and new
statistic was obtained. Table 2 shows also these
results: column 4 reports the arithmetic means while
column 5 the weighted ones. The huge work realized
by Google during summertime is immediately
evident which brought its product near the total
completeness.
GM has changed its values from 28% to 86%
considering the simple arithmetic mean and from
56% to 91% in the case of weighted one.
OpenStreetMap has also improved its values passing
from 42% to 54%, for arithmetic mean and from 56%
to 65%, for weighted one. Figure 11 and Figure 12
report in map the results: once again, the
completeness percentages were represented with
graduated colour that changes from red for the 0% to
green for the 100%. OSM, Figure 11, presents again
a different behaviour between northern, less mapped,
and southern area, full covered, while GM, Figure12,
is substantially uniformly green.
3.3 OSM Authorship
OpenStreetMap always presents a non-uniform
spatial completeness distribution, both at the end of
the first analysis, in spring 2018 (Figure 8), and the
second one, in winter 2018 (Figure 11).
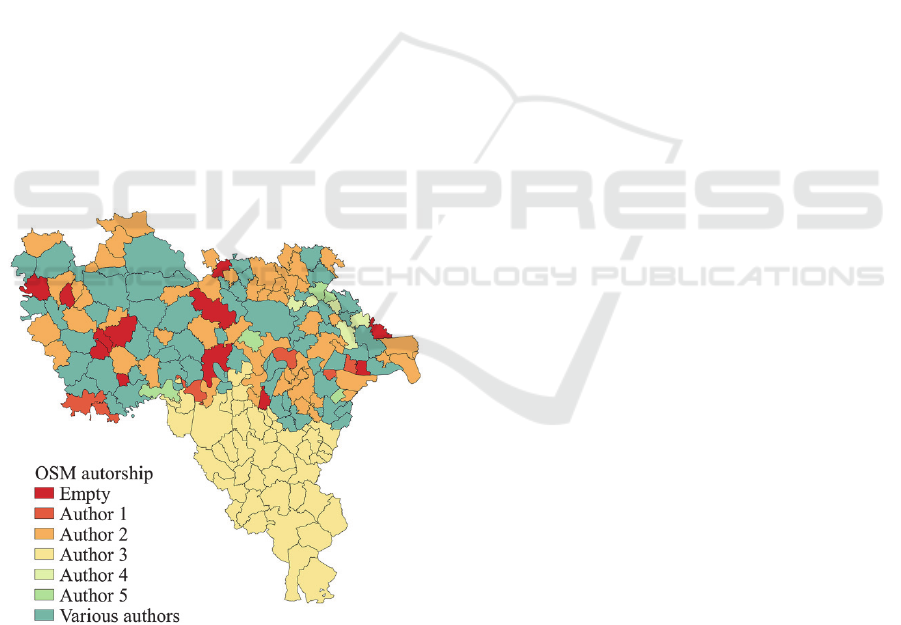
Figure 13: OSM authorship (winter 2018).
Focusing to the second analysis, winter 2018, the
mapped municipalities are concentrated in the
Southern provincial area, less populated, while the
Northern one presents a more irregular behaviour.
This phenomenon has raised the interest to
understand if OSM is an effectively participatory map
or if, in our case, the authors are always the same.
Analysing the metadata of the considered
buildings, containing the authors’ user-ID, a map of
the OSM authorship was built; the map is reported in
Figure 13. It is evident that many municipalities were
mapped by a single person especially in the Southern
part (authors’ name was anonymized) while in the
Northern area the authorship is more fragmented.
There is a clear symmetry between the fully or
almost fully mapped municipalities in Figure 11 and
those attributable to a single author in Figure 13; this
condition leads to good results. On the contrary, if
various authors work on the same city (blue shapes in
Figure 13), the completeness suffers of this multi-
contribution (orange shapes in Figure 11).
4 CONCLUSIONS AND
FURTHER ACTIVITIES
The study concerns the systematic analysis of the
completeness of the OSM and Google Maps on the
188 municipalities of the Province of Pavia. The
analysis concerned only buildings since their
presence is interesting for several applications such as
urban planning or civil engineering. Data collection
and management were performed using QGIS, in a
visual comparison approach, while the statistical
analysis was conducted with specific codes realized
in Matlab. While OSM was largely evaluated in the
past years by some authors (Section 1 presents a state-
of-the-art literature), GM is still not well examined,
even if largely used thanks to its notoriety and
easiness of access. The choice to perform a visual
comparison is mainly motivated to the aim to evaluate
and compare their completeness.
Initial results, obtained in spring 2018, show poor
values especially for Google: OSM reached a
completeness of about 40% while GM did not exceed
30%. The geographic distribution of Google Maps
data suggested a correlation between completeness
and inhabitant distribution; a new statistic was then
proposed weighting the results according to this
parameter. The so-obtained statistics showed that the
two cartographies are substantially equivalent, of
about 56%, from this point of view. During
summertime, between July and August, Google made
a significant updating of its maps, so a complete
review was carried out and new results were obtained
in winter 2018. Considering only weighted means,
this second analysis left OSM almost unchanged,
GISTAM 2020 - 6th International Conference on Geographical Information Systems Theory, Applications and Management
276

from 56% to 65%, but has significantly improved GM
completeness passing through 56% to 91%.
The paper has demonstrated as free access web-
based mapping is a living reality ever-changing with
updates, integrations and refinements. Google Maps
turns out to be the most dynamic and the proposed
analysis, connected with population distribution, has
demonstrated that it is strongly connected to
commercial purposes. OpenStreetMap is slower but
under updating anyway and its completeness is
affected by the number of contributors.
About further activities, positional accuracy is
currently under investigation. Following once again a
visual approach, OSM and GM is compared with
official topographic database, where available.
Currently, the analysis, conducted again with the
support of QGIS and Matlab, is more than 50%
completed.
REFERENCES
Boottho, P. and Goldin, S.E., 2017, March. Automated
evaluation of online mapping platforms. In 2017
International Electrical Engineering Congress
(iEECON) (pp. 1-4). IEEE.
Brovelli, M.A. and Zamboni, G., 2018. A new method for
the assessment of spatial accuracy and completeness of
OpenStreetMap building footprints. ISPRS
International Journal of Geo-Information, 7(8), p.289.
Ciepluch, B., Mooney, P., Jacob, R. and Winstanley, A.C.,
2009. Using OpenStreetMap to deliver location-based
environmental information in Ireland. SIGSPATIAL
Special, 1(3), pp.17-22.
Ciepłuch, B., Jacob, R., Mooney, P. and Winstanley, A.C.,
2010, July. Comparison of the accuracy of
OpenStreetMap for Ireland with Google Maps and Bing
Maps. Proceedings of the Ninth International
Symposium on Spatial Accuracy Assessment in Natural
Resuorces and Enviromental Sciences 20-23rd July
2010 (p. 337). University of Leicester.
Girres, J.F. and Touya, G., 2010. Quality assessment of the
French OpenStreetMap dataset. Transactions in GIS,
14(4), pp.435-459.
Goetz, M. and Zipf, A., 2012, April. OpenStreetMap in 3D–
detailed insights on the current situation in Germany. In
Proceedings of the AGILE 2012 International
Conference on Geographic Information Science,
Avignon, France (Vol. 2427, p. 2427).
Goodchild, M.F., 2007. Citizens as sensors: the world of
volunteered geography. GeoJournal, 69(4), pp.211-
221.
Goodchild, M.F., 2008. Assertion and authority: the science
of user-generated geographic content. Proceedings of
the Colloquium for Andrew U Frank's 60th Birthday,
GeoInfo 39, Department of Geoinformation and
Cartography, Vienna University of Technology
Haklay, M., Basiouka, S., Antoniou, V. and Ather, A.,
2010. How many volunteers does it take to map an area
well? The validity of Linus’ law to volunteered
geographic information. The cartographic journal,
47(4), pp.315-322.
Hecht, R., Kunze, C. and Hahmann, S., 2013. Measuring
completeness of building footprints in OpenStreetMap
over space and time. ISPRS International Journal of
Geo-Information, 2(4), pp.1066-1091.
ISO 19157:2013 Geographic information - Data quality
https://www.iso.org/standard/32575.html (accessed
January 2020)
Koukoletsos, T., Haklay, M. and Ellul, C., 2011, July. An
automated method to assess data completeness and
positional accuracy of OpenStreetMap.
GeoComputation (3), pp. 236-241).
Kounadi, O., 2009. Assessing the quality of
OpenStreetMap data. Msc geographical information
science, University College of London Department of
Civil, Environmental and Geomatic Engineering.
Krek, A., Rumor, M., Zlatanova, S. and Fendel, E.M., 2009.
Interoperable Location Based Services for 3D cities on
the Web using user generated content from
OpenStreetMap. Urban and Regional Data
Management (pp. 87-96). CRC Press.
Meier, P., 2012. Crisis mapping in action: How open source
software and global volunteer networks are changing
the world, one map at a time. Journal of Map &
Geography Libraries, 8(2), pp.89-100.
Mobasheri, A., 2017. A rule-based spatial reasoning
approach for OpenStreetMap data quality enrichment;
case study of routing and navigation. Sensors, 17(11),
p.2498.
Mohammed, N.Z., Ghazi, A. and Mustafa, H.E., 2013.
Positional accuracy testing of Google Earth.
International Journal of Multidisciplinary Sciences and
Engineering, 4(6), pp.6-9.
Potere, D., 2008. Horizontal positional accuracy of Google
Earth’s high-resolution imagery archive. Sensors,
8(12), pp.7973-7981.
Rousell, A. and Zipf, A., 2017. Towards a landmark-based
pedestrian navigation service using OSM data. ISPRS
International Journal of Geo-Information, 6(3), p.64.
Saganeiti, L., Amato, F., Murgante, B. and Nolè, G., 2017.
VGI and crisis mapping in an emergency situation.
Comparison of four case studies: Haiti, Kibera,
Kathmandu, Centre Italy. GEOmedia, 21(3).
Assessment of the Completeness of OpenStreetMap and Google Maps for the Province of Pavia (Italy)
277
