
Corinth Gulf Story Map: Enhancing Public Awareness in Natural
and Anthropogenic Environment using Interactive GIS Applications
Varvara Antoniou
1a
, Paraskevi Nomikou
1b
, Konstantinos Papaspyropoulos
1c
,
Effrosyni Zafeirakopoulou
1d
, Othonas Vlasopoulos
1e
, Evangelia-Varvara Xrysopoulou
1
,
Eustathia Tziannou
1f
and Lemonia Ragia
2g
1
National and Kapodistrian University of Athens, Department of Geology and Geoenvironment,
Panepistimioupoli Zografou, 15784 Athens, Greece
2
Technical University of Crete, Natural Hazards, Tsunami and Coastal Engineering Laboratory, Chania, Greece
{vantoniou, evinom, kpapaspy}@geol.uoa.gr, lragia@isc.tuc.gr, {othovl, effie.zaf92, effietziannou}@gmail.com,
gellychr@yahoo.gr
Keywords: GIS Story Map, Corinth Gulf, Geotope, Natura 2000, Web Application.
Abstract: Story maps are widespread as an interactive tool used for science and spatial data communication, information
and dissemination. A web-based application using story mapping technology is presented here to highlight
places of interest around Corinth Gulf (Greece), a new addition in Natura 2000 areas. A tailored story map
that combines thematic webmaps and scenes (3D webmaps) generated through a Geographic Information
System (GIS) having a great impact on web-based visual presentations with narrative text and multimedia
content was created to highlight the geological and cultural environment of the area around Corinth Gulf.
1 INTRODUCTION
Recent improvements in Geographic Information
Systems (GIS) technologies can provide new
opportunities for immersive and wide engaging
public audiences with complex multivariate datasets.
Story Maps can provide support for scientific
storytelling in a compelling and straightforward way
(Antoniou, et al., 2019) using multi-media assets (e.g.
photos, videos, 3D representations) and narrative text
for visualizing spatial data effectively.
Thereby, Story Maps can be used in order to
disseminate and understand scientific findings to
broader non-technical audiences (Janicki et al., 2016;
Wright et al., 2014).
In this paper biodiversity (unique flora and fauna)
and geodiversity (geological formations, major active
faults, sea level changes), cultural and recreation
areas environment on both shorelines of the Corinth
a
https://orcid.org/0000-0002-5099-0351
b
https://orcid.org/0000-0001-8842-9730
c
https://orcid.org/0000-0002-6432-2602
d
https://orcid.org/0000-0003-4342-1983
e
https://orcid.org/0000-0002-6713-9141
f
https://orcid.org/0000-0001-9713-6809
g
https://orcid.org/0000-0002-3232-8671
Gulf, are presented through a narrative map, as it is
now included in Natura 2000 site areas.
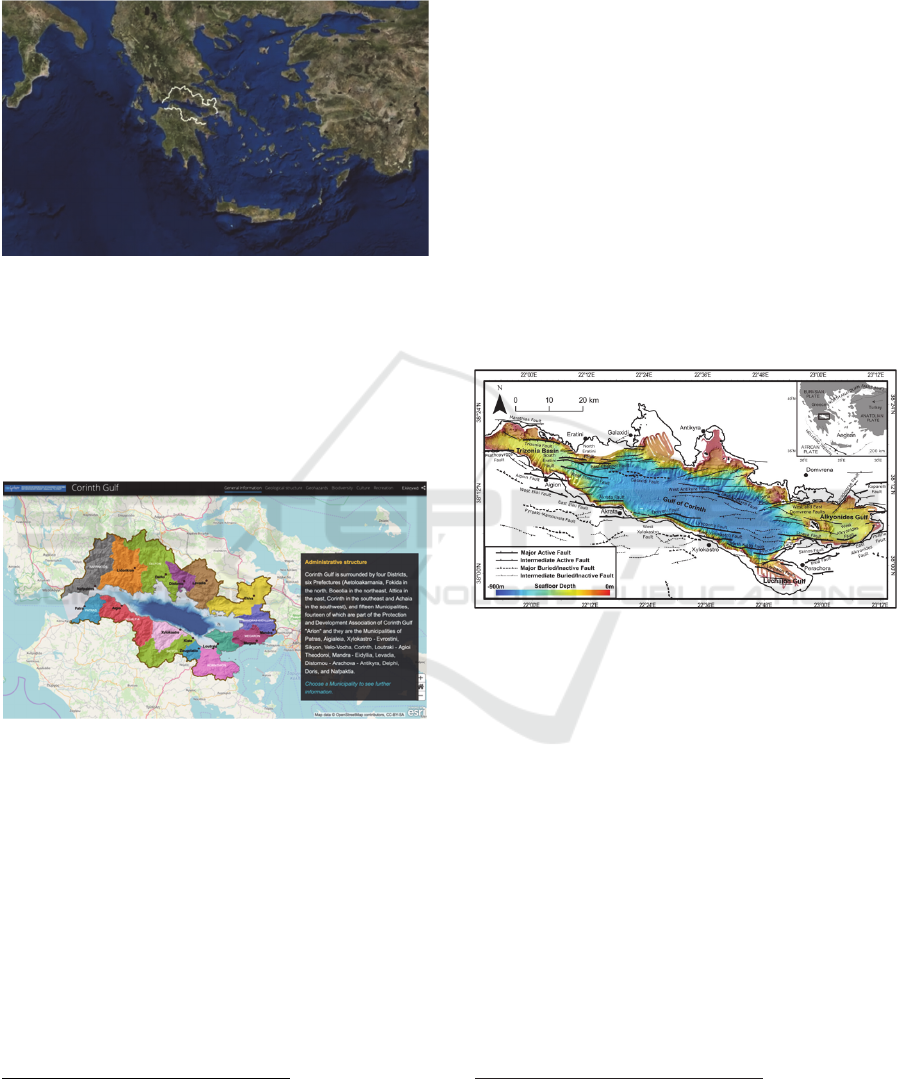
2 STUDY AREA
Corinth Gulf is a small, long, semi-enclosed and
significally deep gulf, formed between Central
Greece and Peloponnese, starting from the Ionian Sea
to the west and ending up to the Isthmus of Corinth to
the east (Fig. 1).
It is an elongated basin of 105km length with a
WNW-ESE direction and 10-15km width represent-
ing one of Europe's most active seismic areas. The
central part of the gulf is characterized by a flat area
of 800-870m depth, with a length of 40km and a
width of 9km to the west up to 12km to the east. Its
southern part is characterized by the existence of
many submarine canyons in the NE-SW direction,
262
Antoniou, V., Nomikou, P., Papaspyropoulos, K., Zafeirakopoulou, E., Vlasopoulos, O., Xrysopoulou, E., Tziannou, E. and Ragia, L.
Corinth Gulf Story Map: Enhancing Public Awareness in Natural and Anthropogenic Environment using Interactive GIS Applications.
DOI: 10.5220/0009563502620269
In Proceedings of the 6th International Conference on Geographical Information Systems Theory, Applications and Management (GISTAM 2020), pages 262-269
ISBN: 978-989-758-425-1
Copyright
c
2020 by SCITEPRESS – Science and Technology Publications, Lda. All rights reserved
while its northern part is mild up to 400m depth and
then with steep slopes up to 800m (Nomikou et al.,
2011). Of the total of 2,336km
2
of its surface, 23% is
deeper than 100m, while 38% has 400-800m depth.
Figure 1: Screenshot showing the geographic location of the
Corinth Gulf. It constitutes a video frame, part of the video
that has been created using ArcGIS Desktop – Pro version
1
,
in order to highlight the study area.
It is surrounded by 4 Districts, 6 Prefectures and
15 Municipalities (Fig. 2) while the total population
is approximately 584.000 (2017) citizens occupying
mostly with tourism, industry and fishing acrivities.
Figure 2: Screenshot presenting the administrative structure
of the area.
Being recently a part of Natura 2000 site areas,
Corinth Gulf foster an unusually high biodiversity
and productivity of marine habitats due to its high
depths in combination with the particular
geomorphological, oceanographic and environmental
conditions. Specifically, the habitats as well as genus
and species that can be found in the gulf are reported
at Natura 2000 official site
2
.
Furthermore, in the wider area, visitors meet the
“Helmos – Vouraikos” geopark belonging to the
UNESCO Network of European Geoparks and the
1
https://www.esri.com/en-us/arcgis/products/arcgis-pro/
overview
World Geoparks Network
3
, as well as the Parnassus
National Park.
From the geological point of view, Corinth Gulf
basin is a tectonic half-graben to an asymmetric
graben with a strong differentiation of its two sides.
Thus, in the North Peloponnese there is a large
tectonic uplift, which has raised the first post alpine
sediments of the gulf at an altitude of 1200-1400m
creating an intense topographic relief. Their age is
very young, ranging from the Upper Pliocene to the
Lower-Middle Pleistocene (3.6-0.78mya). In contrast
to the south side of the Gulf, the north side along the
coast of Central Greece, is subsided or it is relatively
stable and consists of alpine rocks mainly of
Mesozoic - Lower Cenozoic (250-23mya).
Responsible for this, are the major normal marginal
faults, with WSW-ENE direction, which border the
different geodynamic-environmental units and at the
same time constitute the main seismic sources of the
gulf (Fig. 3).
Figure 3: Structural map of the Corinth Rift with the major
marginal faults (active and inactive). The bathymetry was
obtained through multibeam mapping systems (Nomikou et
al., 2011). Offshore faults by Nixon et al., 2016, Taylor et
al. 2011, Bell et al., 2009. Onshore faults by Fold et al.,
2007, 2013 and Skourtsos and Kranis 2009.
The timing of the opening of the present-day
Corinth Gulf is not accurate but is generally estimated
in the Upper Pliocene (3.6My). Its evolution is
characterized by a migration of tectonic activity from
south to north. Today, Corinth Gulf is under
continuous subsidence with a constant depth of
central area at 800m.
In the wider area of Corinth Gulf, natural
phenomena can occur due to geodynamics of the
region, seismicity and the peculiar terrain they
generate. As it exhibits strong seismic activity and
high seismicity, being one of the most active seismic
2
http://natura2000.eea.europa.eu/Natura2000/SDF.aspx?
site=GR2530007
3
http://www.hellenicgeoparks.gr
Corinth Gulf Story Map: Enhancing Public Awareness in Natural and Anthropogenic Environment using Interactive GIS Applications
263

regions in the world (Ambraseys & Jackson 1990,
1997; Papazachos & Papazachou 1989, 1997;
Papadopoulos 2000), Corinth Gulf constitutes a
seismic laboratory for Greece. During the last 150
years strong earthquakes have resulted in the loss of
many human lives or even the destruction of entire
cities. Geological studies have revealed many main
active faults that have spectacular surface
appearances, making populated cities such as Corinth
and Athens vulnerable to seismic hazard
(Papadopoulos et al. 2000).
Tsunamis have also been reported due to
earthquakes of low focal depth and coastal landslides,
while the pre-existing evidence of submarine mounds
interruptions indicates the possibility of a tsunami
with a maximum wave height of 1.04 - 4.04m and a
maximum wavelength of 4.52 - 6.25km (Stefatos et
al. al., 2006).
Also, flash floods, as well as forest fires events
can be observed due to the morphology, on both sides
of the Gulf. Finally, the coastline is in widespread
erosion at a percentage of more than 65%, while its
southern coast is in full recession.
3 METHODOLOGY
In order to meet the challenge of creating the Story
Map of Corinth Gulf, which focuses on presenting the
bio- and geo-diversity as well as the anthropogenic
environment of the broader area, different types of
datasets have been compiled (historical, geological,
topographical, etc. data together with geospatial data
from open source portals). Moreover, multiple field
trips have taken place for data collection, such as
photos and videos for each site of interest to enrich
the existing knowledge.
Τhe Story Map of Corinth Gulf has been created
in an ArcGIS platform, although other free software
is also available (e.g. StoryMapJS
4
, Google Earth
Outreach
5
). The selection was based on the fact that
all available data as well as the necessary tools and
apps, exist into the same platform without the need to
use different software to achieve the same result and
without the need for programming.
Thus, all the available vector and grid spatial data,
along with descriptive data, was first collected,
homogenized and organized into a geodatabase via
4
https://storymap.knightlab.com
5
https://www.google.com/earth/outreach/
6
http://doc.arcgis.com/en/arcgis-online/
7
https://www.esri.com/en-us/arcgis/products/collector-
for-arcgis/overview
ArcGIS Pro v.2.4 software. Moreover, the
geodatabase also contained the necessary feature
layers to be used during field work for data collection.
Geodatabase was then uploaded in ArcGIS online
platform
6
and the available information layers were
used to create a webmap.
To ensure the accuracy of the geographic location
of the sites and to collect real time data, a web
application, available in ArcGIS Online, was created
using the afore mentioned webmap and Collector for
ArcGIS
7
, an application both compatible for Android
and iOS devices, which gives the opportunity, to
collect and update spatial and descriptive data
through mobile devices (tablets or smartphones).
Accordingly, during field work, points that
correspond to sites of interest were collected using the
map or the GPS signal, while descriptive text and
photos completed the fields available in the attribute
table of the corresponding layer as attachments.
After having gathered and processed all the data
for the area, a decision had to be made as a follow-up:
the template of the Story Map. ESRI provides a
number of open source templates
8
which can be used
either as they are (or with minor CSS code
modifications in ArcGIS Online Assistant
9
) through
ArcGIS Online or can be downloaded through
GitHub, modified and then served through a private
server (Antoniou & Vassilakis, 2019). The first
approach was followed during the deployment of this
Story Map, not only due to the large number of users
expected to visit the application, but also due to the
lack of a private server capable of managing them.
As far as the visual output is concerned, a template
called Cascade Story Map
10
was implemented, to
present the available information, as it resembles an
easily accessible for the end user webpage.
Furthermore, due to the large variety of information
that are supposed to be presented, it has been decided
that the guided linear narration through immersive
scrolling is more effective for the users, than the one
that allows jumping from one tab to another without
sequence.
Finally, the Cascade Builder, accessed also with a
free, non-commercial ArcGIS public account, was
used to combine narrative text with webmaps,
images, and multimedia content in an engaging, full
screen scrolling experience, as described in the
following chapter.
8
https://storymaps-classic.arcgis.com/en/app-list/
9
https://ago-assistant.esri.com/
10
https://storymaps-classic.arcgis.com/en/app-list/
cascade/
GISTAM 2020 - 6th International Conference on Geographical Information Systems Theory, Applications and Management
264
4 THE STORY MAP
In the Story Map created for Corinth Gulf
11
,
webmaps, narrative texts, images, tables, multimedia
content and scenes, which correspond to 3D
presentation of data, were used. Additionally, through
ArcGIS Desktop – Pro version 3D animations using
the available spatial data were created, while web
apps were embedded into the main application.
The thematic maps which are presented in the
application, were created directly in ArcGIS Online
12
,
based on the collected data, fieldwork and literature
review, depicting the most important and unique
points. In every webmap, the individual parameters
for each of the information layers, e.g. its symbol, the
appearance or not of pop-up menus, reference scale,
etc., have been determined (DiBiase et al. 1992;
Newman et al. 2010). Although the use of this
template does not require the knowledge of language
programming, ArcGIS Assistant was used, to perform
modifications in CSS coding.
Before using the Cascade Builder, all available
information was grouped into six categories covering
(a) the natural and anthropogenic environment:
general information for the wider area, (b) its
geological structure, (c) the geohazards that might
occur in it, (d) its biodiversity, (e) cultural
information and (f) recreation and outdoor activities
through tourism information across the involved
Municipalities around Corinthian Gulf. For each
category, webmaps or scenes were created using
corresponding data as mentioned below.
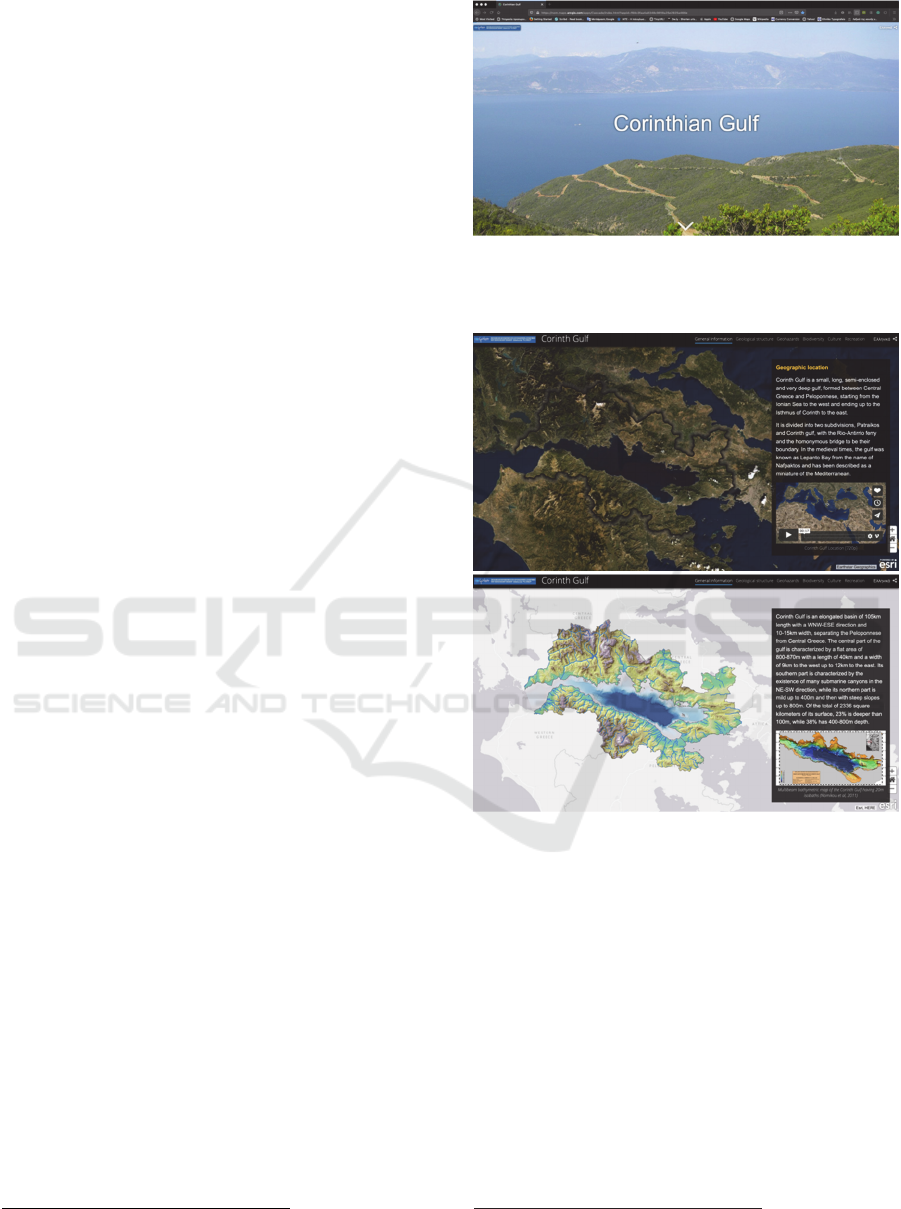
User’s first experience entering the web application
is a representative picture of the area (Fig. 4) as well
as, a way to navigate through the desired language. The
narrative starts giving general information about the
broader area, as its geographic location, the onshore-
offshore morphology of the area, the administrative
structure of the Municipalities bordering the Gulf and
concludes giving information for the anthropogenic
environment. Each narrative text is accompanied with
a webmap showing the spatial distribution of the data
presented using Imagery, OpenStreetMap or Light
Gray Canvas as basemap, while pop-ups give further
information. In addition, a video, in MP4 format, a
combination of successive thumbnails of spatial
distribution of feature layers along with an imagery
basemap animating the location and a multibeam
bathymetric map of the Corinth Gulf with 20m
isobaths (Nomikou et al, 2011) were used to enhance
the narration (Fig. 5).
11
https://nom.maps.arcgis.com/apps/Cascade/index.
html?appid=f68c3faa4a8348c9818a25e2925a466e
Figure 4: Screenshot showing the home page of Corinth
Gulf Story Map. In the upper right part, users can select the
desired language for the narration.
Figure 5: Screenshots showing the boundary (up) and
onshore-offshore morphology of the area (down).
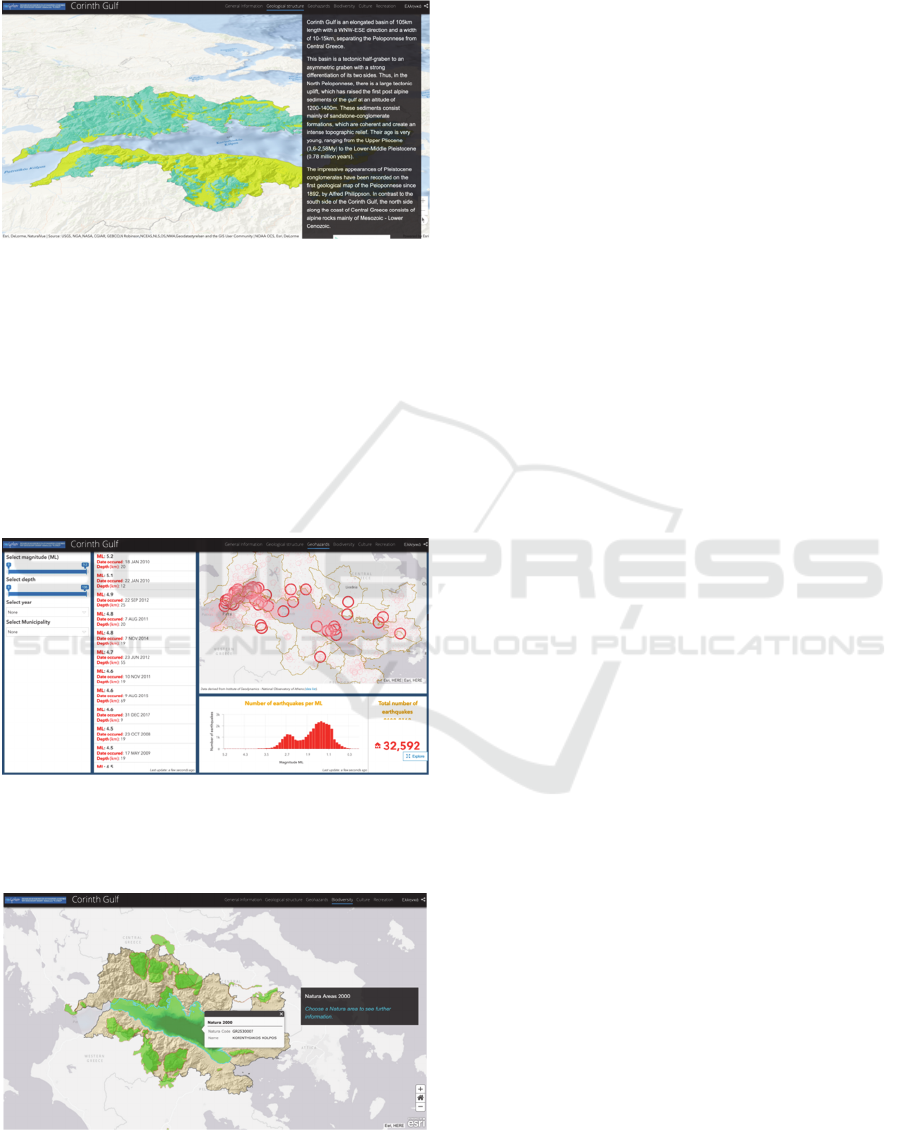
The geological – tectonic structure of the area is
subsequently presented using Ocean basemap. Starting
with a 3D representation of the spatial distribution of
geological formations, which are distinguished in
alpine and post-alpine, a narrative text using
multimedia content describes the evolution of the gulf.
Users can use the tools on the right bottom of the map,
to zoom in and out or right-click anywhere on the scene
to tilt and rotate (Fig. 6). Due to the geodynamics of
the area, further information is given about the
geohazards that might occur in the area: earthquakes,
tsunamis, landslides, floods, coastal and soil erosion
and forest fires. Apart from maps showing the spatial
12
https://www.arcgis.com/home/index.html
Corinth Gulf Story Map: Enhancing Public Awareness in Natural and Anthropogenic Environment using Interactive GIS Applications
265
distribution of these phenomena, representative photos
of the area also enhance the narration.
Figure 6: Screenshot showing the three-dimensional
distribution of alpine and post-alpine formations of the area.
To better understand the high seismicity of the
area, an interactive dashboard was created showing
the earthquakes that occurred with in the period 2008-
2018 and their distribution. Filters can be applied to
minimize the results in every panel, using depth,
magnitude, year and area of event, while statistical
data present the result as a total number of
earthquakes and as a diagram with their distribution
according to magnitude (Fig 7).
Figure 7: Screenshot showing a dashboard where the high
seismicity of the area is presented. Users can modify the
data displayed according to earthquake’s magnitude and
depth, as well as the year and area of occurrence.
Figure 8: Screenshot showing the spatial distribution of
Natura 2000 areas around Corinth Gulf.
The natural environment, biodiversity and
ecosystems available in the area were presented
through a webmap showing the spatial distribution of
Natura 2000 areas (Fig. 8) around the gulf, using
Light Gray Canvas basemap, while photos and
narrative texts describe the unique flora and fauna of
the area.
The two following sections present the cultural
environment as well as recreation and outdoor
activities in the area. Due to the large number of sites
available, it was decided to present the five most
important for each Municipality. Cultural
environment section provides information about
archaeological sites – museums, cultural heritage
monuments and sport facilities available in the area.
For each category a webmap has been created
visualizing the spatial distribution of the data using
the morphology of the area as basemap. Selecting a
site of interest, further information is given through
text and photos in a pop-up format. The same
approach is adopted for the different kinds of
recreation and outdoor activities, which provides
information about fishing shelters, diving centers,
bathing waters, walking paths and religious sites (Fig.
9).
All the available information (texts, multimedia,
etc.) that was used in this interactive GIS application,
is properly mentioned, along with the research team
responsible for its creation, at the end of the story
map.
5 DISCUSSION
In the demonstrated application the aim was to
highlight, bio- and geo-diversity as well as cultural
and recreation sites, around Corinth Gulf. Using Story
Maps, a relatively new geographical approach, and
having open source code, provide many possibilities,
due to the simplicity of use, both from the aspect of
the developer and the end user. It allows integration
of new functions combining many scientific fields, in
a way that scientific knowledge is received and
comprehended by a broader audience. Furthermore, it
is responsive, and it can also be as interactive as the
developer wishes.
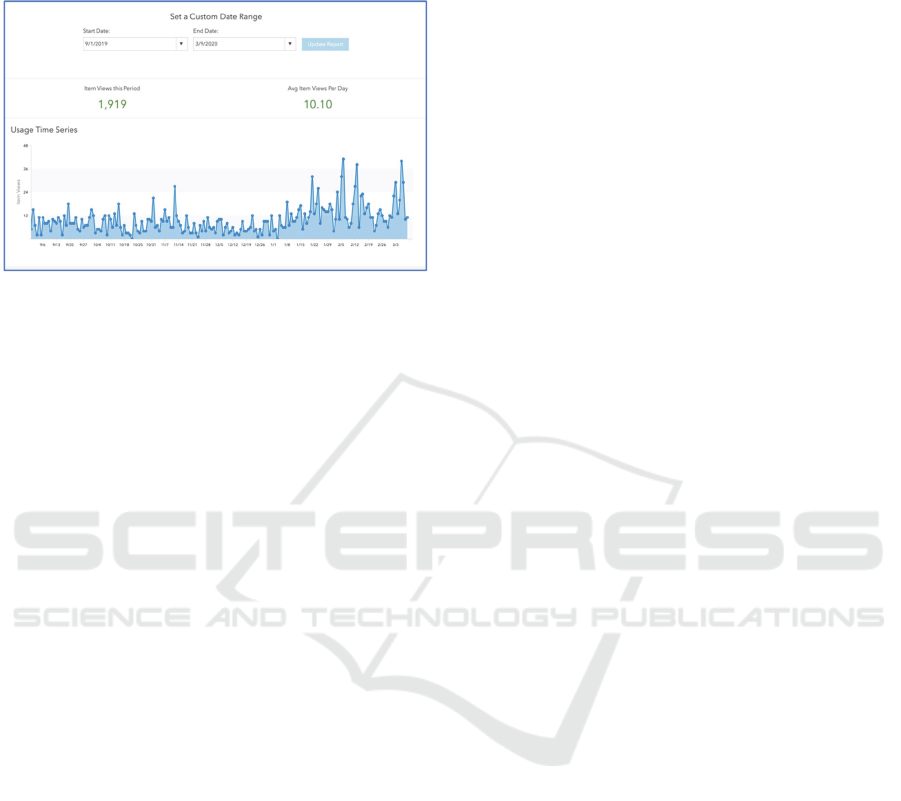
As shown in figure 10, the developed application
has already reached a number of users in a very
small period of time. Furthermore, having in mind
previous attempts (Antoniou, at al., 2018, 2019), this
can be an interactive way for presenting geological,
geomorphological and cultural contents of any
GISTAM 2020 - 6th International Conference on Geographical Information Systems Theory, Applications and Management
266
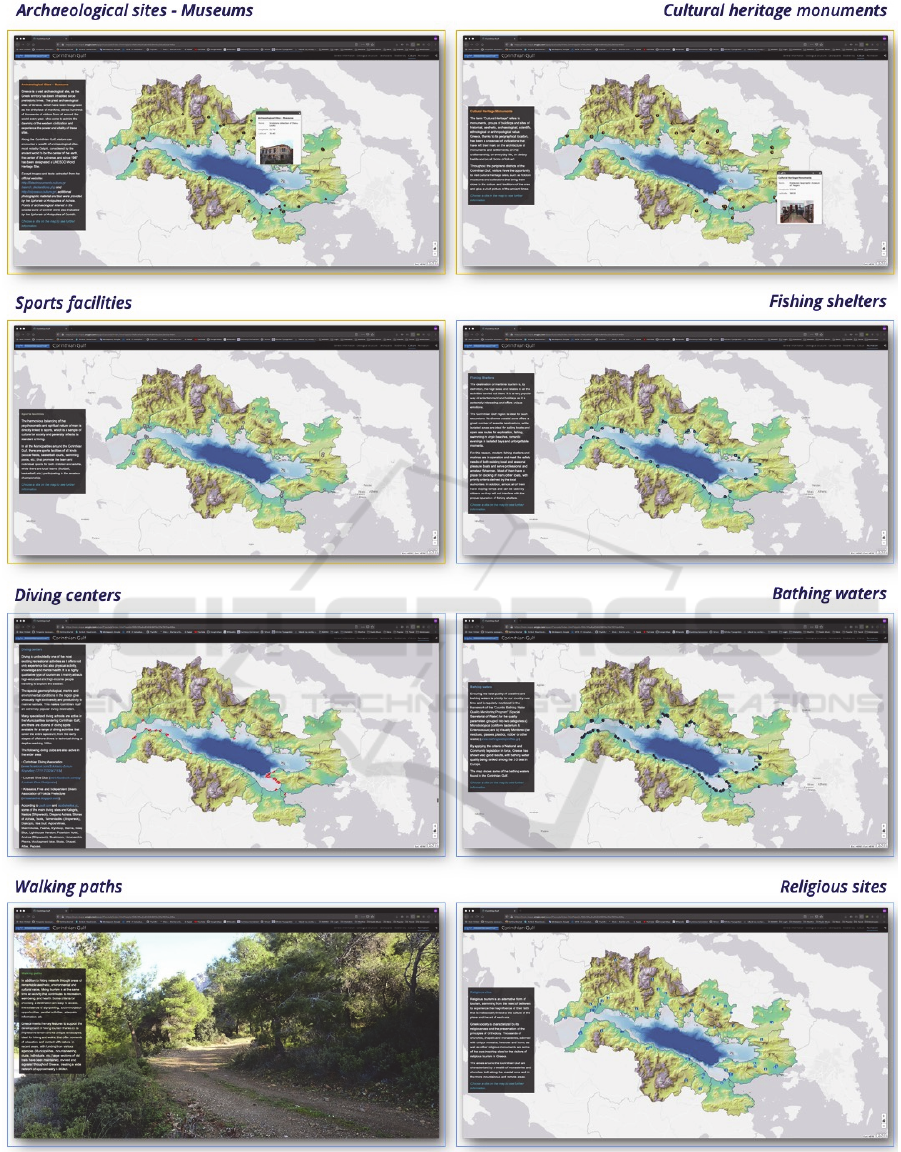
Figure 9: Screenshots showing the spatial distribution of cultural environment and recreational and outdoors activities. Also,
representative photo is used to present general information about the walking paths of the area.
Corinth Gulf Story Map: Enhancing Public Awareness in Natural and Anthropogenic Environment using Interactive GIS Applications
267
significant area, especially places which can be
characterized as geotopes or protected areas
worldwide.
Figure 10: Screenshot showing accessibility statistics for a
6-month period.
Finally, as Corinth Gulf portrays a Natura 2000
area, this application provides a quick access of all
useful data to a wide audience, attracting interest and
possibly motivating people to learn more and visit the
area.
ACKNOWLEDGEMENTS
This work was supported and funded by Protection
and Rational Development Association of Corinth
Gulf “Arion”, in the framework of the Research
Project “Recording and highlighting the geo-cultural
heritage of the Corinth Gulf using modern digital
mapping tools” of NKUA.
REFERENCES
Ambraseys, N.N. and Jackson, J., 1990. Seismicity and
associated strain of central Greece between 1980 and
1988. Geophys. J. Int., 101, 663-708.
Ambraseys, N.N. and Jackson, J., 1997. Seismicity and
strain in the Gulf of Corinth (Greece) since 1694. J. of
Earthquake Eng., 1, 433-474.
Antoniou, V., Nomikou, P., Bardouli, P., Lampridou, D.,
Ioannou, Th., Kalisperakis, I., Stentoumis, Ch.,
Whitworth, M., Krokos, M. & Ragia, L. (2018). An
Interactive Story Map for the Methana Volcanic
Peninsula. In Proceedings of the 4th International
Conference on Geographical Information Systems
Theory, Applications and Management (GISTAM
2018), pages 68-78, ISBN: 978-989-758-294-3.
Antoniou, V., Ragia, L,. Nomikou, P., Bardouli, P.,
Lampridou, D., Ioannou, T., Kalisperakis, I.
Stentoumis, C., 2018. Creating a Story Map Using
Geographic Information Systems to Explore
Geomorphology and History of Methana Peninsula.
ISPRS Int. J. Geo-Inf. 2018, 7, 484.
Antoniou, V. and Vassilakis, E. (2019). Diffusion of Geo-
Environmental Datasets through Online Interactive and
Real-Time Applications. Case Study:The Natura
GR2440006 Protected Area. Annals of Geographical
Studies, Volume 2, Issue 1, 8-16.
Antoniou, V., Nomikou, P., Bardouli, P., Sorotou, P.,
Bonali, F.L., Ragia, L. and Metaxas, A., 2019. The
Story Map for Metaxa Mine (Santorini, Greece): A
Unique Site Where History and Volcanology Meet
Each Other. In Proceedings of the 5th International
Conference on Geographical Information Systems
Theory, Applications and Management - Volume 1:
GISTAM, 212-219.
Antoniou, V., Nomikou, P., Zafeirakopoulou, E., Bardouli,
P., Ioannou, T., 2019. Geo-biodiversity and cultural
environment of Nisyros volcano. 15th International
Congress of the Geological Society of Greece, Sp. Pub.
7 Ext. Abs. GSG2019-195, Athens, 22-24 May, 2019,
p. 716-717.
Bell, R.E., et al., 2009. Fault architecture, basin structure
and evolution of the Gulf of Corinth Rift, central
Greece. Basin Research, 21, 824-855.
DiBiase, D., A.M. MacEachren, J.B. Krygier, and C.
Reeves. 1992. “Animation and the Role of Map Design
in Scientific Visualization.” Cartography and
Geographic Information Systems, 19 (4): 201–2014.
Ford, M., et al., 2007. Stratigraphic architecture,
sedimentology and structure of the Vouraikos Gilbert-
type fan delta, Gulf of Corinth, Greece. In Nichols, G.,
Paola, C., and Williams, E. (Eds.). Sedimentary
Processes, Environments and Basins: A Tribute to Peter
Friend. Jarvis, I. (Series Ed.). Special Publication of the
International Association of Sedimentologists, 38:44–
90.
Ford, M., et al., 2013. Tectono-sedimentary evolution of
thewestern Corinth rift (Central Greece). Basin
Research, 25, 3–25.
Nixon, C.W., et al., 2016. Rapid spatiotemporal variations
in rift structure during development of the Corinth Rift,
central Greece. Tectonics, 35(5), 1225-1248.
Nomikou, P., et al., 2011. Swath bathymetry and
morphological slope analysis of the Corinth Gulf. 2nd
INQUA-IGCP-567 International Workshop on Active
Tectonics, Earthquake Geology, Archaeology and
Engineering, Corinth, Greece.
Papadopoulos, G.A., 2003. Tsunami Hazard in the Eastern
Mediterranean: strong earthquakes and tsunamis in the
Corinth Gulf, Central Greece. Natural Hazards, 29,
437–464.
Papadopoulos, G., et al., 2000. Foreshock activity as a
precusror of strong earthquakes in Corinthos Gulf,
Central Greece. Physics and Chemistry of the Earth, 25,
239–245.
Papazachos, B. and Papazachou, C., 1997. Earthquakes in
Greece. Ziti Publications, 304.
Papazachos, B. and Papazachou, C., 1989. Earthquakes in
Greece. Ziti Publications, 244.
GISTAM 2020 - 6th International Conference on Geographical Information Systems Theory, Applications and Management
268

Skourtsos, E. and Kranis, H., 2009. Structure and evolution
of the western Corinth Rift, through new field data from
the northern Peloponnesus. In Ring, U., and Wernicke,
B. (Eds.), Extending a Continent: Architecture,
Rheology and Heat Budget. Geological Society Special
Publication, 321(1), 119–138.
Stefatos, A., Charalambakis, M., Papatheodorou, G. &
Ferentinos, G., 2006. Tsunamigenic sources in an active
European half-graben (Gulf of Corinth, Central
Greece). Marine Geology, 232: 35–47.
Taylor, B., et al., 2011. The structures, stratigraphy and
evolution of the Gulf of Corinth rift, Greece. Geoph. J.
Int., 185(3):1189–1219.
Janicki, J., Narula, N., Ziegler, M., Guénard, B. and
Economo, E., 2016. Visualizing and interacting with
large-volume biodiversity data using client–server web-
mapping applications: The design and implementation
of antmaps.org. Ecological Informatics, 32, pp.185-
193.
Wright, D.J., Verrill, A., Artz, M., and Deming, R., 2014
Story maps as an effective social medium for data
synthesis, communication, and dissemination, Eos,
Trans. AGU, 95, Fall Meet. Suppl., Abstract IN33B-
3773, 2014.
Corinth Gulf Story Map: Enhancing Public Awareness in Natural and Anthropogenic Environment using Interactive GIS Applications
269
