
Applied Data Science: An Approach to Explain a Complex Team Ball
Game
Friedemann Schwenkreis
1a
and Eckard Nothdurft
2
1
DHBW Stuttgart, Paulinenstr. 50, 70565 Stuttgart, Germany
2
Landessportschule Albstadt, Vogelsangstraße 21, 72461 Albstadt, Germany
friedemann.schwenkreis@dhbw-stuttgart.de, eckard.nothdurft@ls-albstadt.de
Keywords: Information Model, Team Handball, Statistics, Applied Data Science.
Abstract: Team handball is a fast and complex game with a very traditional background and so far, almost no collection
of digital information. Only a few attempts have been made to come up with models to explain the
mechanisms of the game based on measured indicators. CoCoAnDa is a project located at the Baden-
Wuerttemberg Cooperative State University that addresses this gap. While having started with the aim to
introduce data mining technology into an almost non-digitalized team sport, the project has extended its scope
by introducing mechanisms to collect digital information as well as by developing field specific models to
interpret the collected data.
The work presented will show the design of specialized apps that have been implemented to manually collect
a maximum of data during team handball matches by a single observer. This paper will also describe the
analysis of available data collected as part of the match organization of 1,190 matches of the first and 1,559
matches of the second German team handball league, HBL. Furthermore, the data of more than 150 games of
national teams, the first league, and the third league have been manually collected using the apps developed
as part of the project.
1 INTRODUCTION
Since October 1917, when Max Heiser decided on the
name “Handball” for the previously by himself
invented game “Torball” (DHB, 2017), team handball
has evolved tremendously, particularly in Europe.
The complexity and trickiness of this team ball game,
with its permanent game continuum in which two
teams interfere with each other, exert a fascination on
the involved people that can hardly be described by
words or in terms of explanations.
What might be explainable to the outside, seems
to be very hard to understand from the inside. Why
does the “inner circle” of team handball struggle to
decrypt the own sport? Other team sports have been
subject to digitalization in the past already. For
instance, nothing is left to chance in the professional
leagues in North America having a multi-million-
dollar budget, as at is the case in basketball, football,
and baseball. In Europe, soccer, volleyball, and
hockey have been digitally decoded to a vast extend.
a
https://orcid.org/0000-0003-4072-0582
Team handball, however, seems to have not yet
reached its digital maturity.
Coaches who talk publicly about their work, do
have the basic problem to express verbally what they
do, and they must also justify what they do.
Frequently they struggle to find explanations for
spectators and journalists which leads to (over-
)simplifications. And if an explanation cannot be
found they come up with hollow words like “team
mentality” which cannot be directly observed and
thus it cannot be refuted. According to Jack
McCallum, the resulting platitudes and banalities are
the “lingua franca” (McCallum, 2007) of sports and
immune to falsification.
To replace the beloved folklore and customs by a
non-guessing storytelling which is based on data and
numbers, should be in the interest of all involved
parties. For sure, there is still the “gut feeling”, an
intuition that cannot be explained, yet (Kahnemann,
2013). However, believe and knowledge cannot be
maximized at the same time. To maximize one of the
two, the other one needs to be pushed back in order to
get the necessary additional space for optimization.
Frequently, findings “eat up” intuitions in this
situation.
Whether “big data” steals the romance of sport, as it
was written by the NZZ in June 2019 (Berger, 2019),
or whether the “DNA” of team handball (as well as
ice hockey) can be decrypted completely, is still an
open research question. We are working on an answer
and we have some first results.
2 INDICATORS IN TEAM
HANDBALL
2.1 Basics of Team Handball
Team handball is played indoors on a field of 20 x 40
meters (IHF- International Handball Federation,
2016) It is played by two teams consisting of 7
players out of which one player is the (optional)
goalkeeper. There is a goal on each side of the field
and a penalty area in front of the goal. Only the
goalkeeper of the defending team is allowed inside
the penalty area.
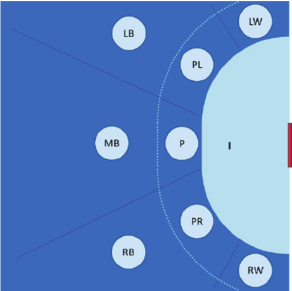
Figure 1 : Attacking zones.
An attack of a team might end with the following
outcomes, which means that the attack ends, and the
ball possession changes:
The team throws the ball at the goal and scores a
goal (goal).
The team throws the ball and misses the goal
(miss), or the goalkeeper saves the ball (save).
During the attack the attacking team loses the ball
due to a ball handling error of one of the players.
During the attack the attacking team loses the ball
due to a violation of the rules of the game (rule
violation).
Attempts to score a goal, by throwing the ball at the
goal, are differentiated based on the position of the
player on the field from which the attempt is made.
There are 8 attacking zones (plus the penalty line) per
side which are distinguished (see Figure 1):
Left Back, Mid Back, Right Back
Pivot Left, Pivot, Pivot Right
Left Wing, Right Wing
2.2 Attack Effectiveness and Attempt
Effectiveness
The attack effectiveness is a key performance
indicator of teams. It is the ratio of the number of
successful attacks (attacks which ended with a goal)
divided by the total number of attacks performed by
the team.
The attempt effectiveness is a key performance
indicator of teams as well as of players and exists in
two variants:
The overall attempt effectives (also called throw
effectiveness), which is the number of successful
attempts (which scored a goal) divided by the
total number of attempts (of the team or player).
The zone-specific attempt effectiveness, which
focusses on attempts in a specific field zone only.
2.3 Technical Error Ratio
All attacks which do not result in an attempt to score
a goal are considered to be technical errors. They
consist of ball handling errors as well as rule
violations. The ratio of technical errors is the number
of attacks without an attempt divided by the total
number of attacks.
2.4 Defence Effectiveness and
Goalkeeper Effectiveness
Whenever the opponent attempts to score a goal and
the attempt does not result in a goal due to a blocked
ball by a defensive field player or due to a saved ball
by the goalkeeper, it is considered a successful
defence. Thus, the defence effectiveness is defined as
the sum of saves plus the number of blocks divided
by the total number of opponent attacks.
The goalkeeper effectiveness is an indicator of the
goalkeepers only and defined as the number of saves
divided by the total number of opponents’ attempts
without considering the number of blocked or missed
attempts. The goalkeeper effectiveness is a team
performance indicator because only saves are
recorded which lead to an end of an attack. There is
also a variant of the indicator, the personal
goalkeeper’s effectiveness, which includes saves that
did not end the attack of the opponent.
3 DATA COLLECTION
Team handball is a very traditional sport and the
regulations have been very restrictive until recently.
For instance, the first German league (Handball
Bundesliga, HBL) waited until the season 2019/2020
to automatically collect data using sensors, and the
International Handball Federation just recently
decided to allow to use information from outside the
field of play for coaching purposes during a match.
Hence, there is not much data available about team
handball matches. Even worse, the available data that
has been collected in the past, like data that has been
collected by Sportradar (Sportradar, 2015) for betting
purposes, do not have the needed quality for in-depth
analysis in the context of research projects. For
instance, simple checks for the balanced number of
attacks during a match reveal significant
discrepancies. Furthermore, there are errors and
missing data, e.g. due to network outages during the
recording. As a consequence, the CoCoAnDa project
(Schwenkreis F. , 2019) had to develop its own data
gathering mechanisms first, in order to collect enough
data with sufficient quality as a basis for applying
analytics.
3.1 Specialized Mobile Apps for Data
Collection
One of the major challenges to collect data in case of
team handball are the limited budgets of the teams
(even in the first league). When looking at options to
collect data during matches, the teams usually need
solutions that can be used when playing at home as
well as abroad. Thus, fixed solutions in the arenas do
only make sense if all teams of a league agree to equip
their sports hall with that solution and to share the
collected data. In general, we are still far from such a
uniform infrastructure (and its use) in the halls. Thus,
CoCoAnDa decided to build mobile apps that support
the manual collection of information which can be
digitally processed later. Currently, we use two apps
to collect information and one app to provide a near
real-time visualization to the coaches.
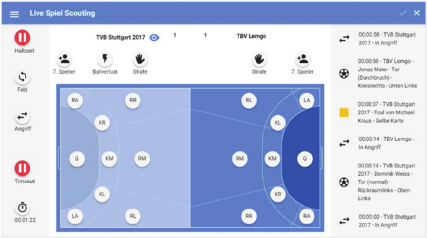
3.1.1 The Scouting App
The so-called Scouting App (see Figure 2) was
developed to record the team handball specific events
during a match. It has been developed with a main
emphasis on the efficient recording of events with a
minimum risk of errors. The app is based on the
Ionic™ framework (ionic, 2019), runs on Android™
tablets, and allows to record the following events:
Attempts to score with their location, involved
players and outcome
Scoring goals including the targeted area of the
goal
Technical errors including the involved players
Sanctioned fouls and penalties including the
involved players (as well as temporary
suspensions)
Saves including the targeted area of the goal and
misses
Blocked attempts including the involved player
Replacing the goalkeeper by an additional field
player
Figure 2 : The Scouting App.
The app generates events which are sent via a
local wireless network to a so-called data backend
which stores the events in a PostgreSQL™
(PostgreSQL, 2019) database. The data backend can
also be run on the same Android tablet as the Scouting
App itself. Hence, the Scouting tablet is a very
lightweight and highly portable solution
(Schwenkreis F. , 2018). It can be used without any
support of the sport halls of a match, even when it is
used in combination with the near real-time
monitoring app: The Coaching App.
Using the Scouting App, we have recorded the
game events of 89 first league matches and 52
matches of the 3rd and the 4th league, the national
women’s team, and the national junior teams.
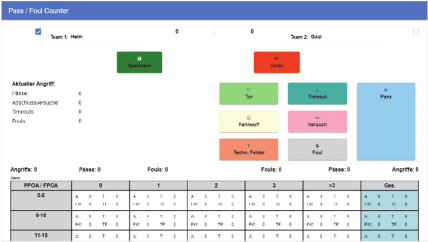
3.1.2 The Passcounter App
The PassCounter App (Figure 3) is an additional
stand-alone app that has been developed to “record”
a team handball match based on passes rather than
time and game events. Since more than 1500 passes
happen during the 60 minutes of a team handball
match, the PassCounter App has been particularly
designed to support the efficient recording of passes
and to cope with errors.
With the PassCounter App we record the number
of passes, the number of fouls, and the number of
technical errors during an attack as well as misses.
Since the recording person needs to react very fast to
events on the field, there is a high probability of
errors. Two features help to minimize the number of
errors in the result generated by the PassCounter App:
Figure 3 : The PassCounter App.
A large button for recording passes.
An Undo button to compensate for errors.
Up to this point we have recorded the information of
145 first league matches and of 22 matches of lower
leagues, the women’s national team and the EHF
Champions League using the PassCounter App.
3.2 Sensor-based Data
With the introduction of sensor-based recording of
the players’ location in the first league, we have now
access to the precise positions of players and their
movement traces (with a time resolution of 20
positions per second). This will allow us to
automatically detect tactics and trigger actions in the
future (Schwenkreis F. , 2018), and by combining this
information with the collected game events we will
be able to analyse the success of certain tactics.
Furthermore, we can calculate a sophisticated player
contribution index based on the position data
(Schwenkreis F. , 2019). However, this is just at its
beginning and we cannot present results, yet.
3.3 Publicly Available Data
As mentioned before, there is some publicly available
data, that is collected by the German Bundesliga (HBL,
2019). Although its overall quality is questionable
(e.g., we detected huge differences in the number of
attacks per team in a single match), some information
can still be used, as for example the sequence of scored
goals. Since the HBL cooperates with the CoCoAnDa
project, we have received the collected data of almost
four seasons of the first (1190 matches) and the second
(1559 matches) German team handball leagues.
4 ANALYSIS AND INSIGHTS
The following results have been derived from the data
that we have collected with our apps. We have used
the publicly available data from the HBL to verify our
findings and to check for differences between the
leagues. Whenever the data from the HBL did not
have the necessary quality, we have not included a
comparison with the league’s data.
4.1 Basic Observations
According to our observations, a match of the first
German league consists in average of approximately
49 (between 40 and 60) attacks per team. Each team
performs 40 attempts, out of which 14 (between 5 and
22) are misses or opponent saves and 26 (between 15
and 40) result in goals. Thus, the defence
effectiveness is almost identical with the goalkeeper
effectiveness. In average the goalkeepers have
approximately 9 saves (between 3 and 19) per game,
i.e. 5 of the 14 misses are attempts that effectively
miss the goal. In average, 10 (between 3 and 16)
attacks are finished with a technical error. Blocked
attempts ending an attack are rare in matches and in
average there is a single blocked ball in two games.
Regarding the performance indicators introduced
in section 2 an average team of the HBL has:
An attack effectiveness of approximately 53%
and a zone independent attempt effectiveness of
approximately 65%.
A technical error rate of approximately 20%.
A goalkeeper effectiveness of approximately
23%.
A comparison with lower level leagues shows a higher
number of attacks, resulting in more goals, more
misses, and more saves. The number of technical errors
per match seems to be almost identical, which is also
the case for the attempt effectiveness.
4.2 Data Science Approach
Data Science (Provost & Fawcett, 2013) focusses on
the application of data mining technologies to answer
“business-level” questions. In the context of the
CoCoAnDa project we are targeting questions of
team handball coaches and try to find answers using
data mining as well as other data analytic approaches.
The overall objective is to find patterns that allow to
predict the final outcome, or the future development
of matches, based on the indicators of players or the
team that can be influenced by the coaches (and the
players themselves). However, as a first step we
focused on identifying “alerts” which indicate the
need for a change in order to avoid a loss.
4.2.1 The Baseline
When applying predictive modelling there needs to be
a baseline regarding probabilities in order to evaluate
the quality of results. A very simple starting point is
to look at the random case first. In case of matches
that would correspond with throwing a coin to
determine the winner of the match. I.e. the probability
of winning a match is 50% in the pure random case
(ignoring ties).
A typical question in case of team ball sports is
whether there is a significant advantage of playing at
home rather than playing abroad. In case of our
observation there is an advantage of being the home
team: In approximately 73% of the cases the home
team does not lose.
Another question that came up was, whether the
outcome of a match can be derived from the current
rank of the teams in the league. It turned out that
having a better or equal rank than the opponent team
(before the match) results in a 71% “probability” of
not losing the game.
The first three baseline “predictions” are
completely independent from the actual match or any
property of the players. Thus, they cannot be
consciously influenced by the coaches or the players.
Finally, we looked at the halftime results and whether
the outcome of the match can be derived from them.
We found, that in 72% the cases, a team does not lose,
if the team was not behind at halftime. I.e. if your
team is behind at halftime, there is only a 28% chance
that your team will not be losing in the end.
4.2.2 Zone-specific Insights
Collecting match information using the Scouting App
has increased the data quality and enhanced the
information with additional data compared to the
HBL data. Based on the attack information of 384
team specific views of matches (correspond with 192
matches), we were able to analyse 13,656 attempts.
According to our observations, an average team in
the first German league has an attempt effectiveness
of approximately 42% from the far distance (9 meters
and beyond), a near-zone attempt effectiveness of
approximately 75%, and an attempt effectiveness
from the wing positions of approximately 66%, which
adds up to an overall attempt effectiveness of 58%.
Overall, goalkeepers reach in average
approximately an effectiveness of 49% from the far
zone, 20% from the near zone and 28% from the
wings (which adds up to 25% in total).
We have compared these numbers with indicators
collected during 52 games of a team playing 3rd
league in one season and 4th league in a second
season. While the lower leagues have a 4% higher
attempt effectiveness from the far zone, and similar
effectiveness from the near zone, the attempt
effectiveness from the wings is 6% lower. The overall
effectiveness is 57%. The zone-specific goalkeeper
effectiveness numbers in the lower leagues are 7%
lower regarding the far zone, similar in the near zone
and 12% better from the wings.
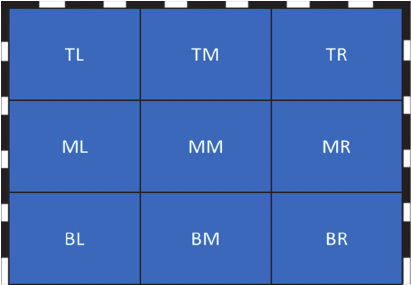
4.2.3 Goal Area Specific Insights
The Scouting App has been extended with the ability
to record the goal area that has been targeted by an
attempt which reaches the goal. The goal has been
divided into nine areas for that purpose (see Figure 4).
Three areas in the top section: top left, top mid, and
top right
Three areas in the middle section: mid left, mid
mid, mid right
Three areas in the bottom section: bottom left,
bottom right, bottom right
Figure 4 : Goal Areas.
Whenever a goal is scored or a save happens, the
targeted goal area is recorded from the attacker’s
point of view. I.e. from a goalkeeper’s perspective the
zones are mirrored. Furthermore, we do not actually
record the goal area where the ball passes the goal line
but rather the area where the ball passes the
goalkeeper or where the goalkeeper saves the ball.
Hence, the collected information is intended to
answer questions like “Where are the strong/weak
areas of a goalkeeper?”, “Is there an area which
should be better covered by the blocking players to
help the goalkeeper?”, or “Has an attacker a certain
“sweet area” when attempting?”.
The recording of the goal areas in case of saves by
goalkeepers has been added rather recently. Thus, we
have only data of 92 HBL games, and 7105 attempts
at this time. Most attempts are targeted at the bottom
section of the goal (approximately 52%). Less than a
quarter of the attempts (22%) are targeted at the top
section, even though the summarized attempt
effectiveness numbers are very similar (77% at the
bottom and 77% at the top respectively). Only about
one fifth of the attempts are targeted at the middle
section, which shows a significantly lower attempt
effectiveness of only 44%. The goalkeeper’s
effectiveness can simply be calculated by subtracting
the attempt effectiveness from 100%.
Again, the numbers have been compared to the
data collected in the 4
th
league. We were able to use
23 matches) including 2,015 attempts. The
distribution of the attempts across goal areas is almost
the same as in case of the HBL (with a maximum
difference of 2% in each section). However, in case
of the lower league we have a lower attempt
effectiveness of 74% in the top section, a significantly
higher effectiveness of 59% in the middle section, and
74% in the bottom section.
4.2.4 Significance of the Sequence of Goals
While considering the question whether the outcome
of a match can be predicted significantly before the
end of a match based on the team’s performance, we
looked at the most prominent indicator: the number
of goals. Several hypotheses have been investigated
and one showed a surprising result: “The team that
scores the nth goal first, will not lose the match”.
With the collected data from the Scouting App,
the complete sequence of match events is available
and can be analysed. Thus, we compared the
“predictability” of different numbers of goals (the n)
ranging from 10 up to 28 based on 98 matches of the
first league.
Below the investigated range, the accuracy
decreases. Above the goal 24 the accuracy does also
decrease because the number of matches in which less
than the required number of goals are scored,
increases (we have in average of approximately 25
goals per match and team in the set of observed
matches).
Two results are particularly interesting. There is a
peak (local maximum) around goal 16 (92.9%) after
which the accuracy decreases. Furthermore, there is a
second peak (the global maximum) around goal 20/21
(95.9%).
We have verified these patterns with the data from
52 matches of the lower leagues. We have found the
same two peaks, the first one at goal 16 (85.4%) and
the second one at goal 26 (100%). However, the
average number of goals per match is significantly
higher (approx. 29) compared to the matches of the
first league.
Since the publicly available HBL data has
sufficient quality regarding the sequence of goals, we
also verified the “two peak finding” using long-term
data (almost 4 seasons) of 1190 first league matches
and of 1559 second league matches. The two peaks
do not exist in long-term data. However, at goal 16
we find an accuracy of 86.6% in the first league and
83.2% in the second league. The maximum accuracy
is at goal 21 in the first league (91.3%) and 22 in the
second league (88.9%). If we just look at the 306
matches of the last season of the first league, we find
the two peaks at 17 goals (89.5%) and at goal 20
(91.5%). Based on 379 second league matches of the
last season we found the first peak at goal 16 (85%)
and the maximum at goal 21 (91%).
4.2.5 Advanced Insights using Data Mining
Techniques
The prediction of the winner of matches is a typical
classification task (Provost & Fawcett, 2013). The
business questions “behind” the classification is:
“Which (minimal) combination of indicators that we
measure can be used to predict the outcome of a
match”. Since we are measuring the indicators while
the match is played, and we want to have an
indication during the match whether we need to
intervene, it is useless to train models using the
absolute numbers of finished matches. We rather
need to use relative indicators as introduced in section
2 that can be measured throughout the match.
Data Mining and its methods are completely new
to team handball coaches. Thus, it is very important
that the results can be explained in terms which can
be understood by the coaches. That is why we started
by using tree classification as the data mining method.
Tree classification models can be explained as a set
of rules over the measured indicators, which makes
them understandable.
Regarding the computation parameters, we found
that the information gain criterion was the best split
criterion and using pruning and pre-pruning avoids
overfitting of the model (while reducing the
prediction accuracy a bit). The tree model we have
found has a prediction accuracy (of the training data)
of approximately 94% and seems to be a logical
extension of the basic observation. Here is a summary
of the rules:
If the attempt effectiveness is 65% or better, and
the defence effectiveness is 26% or better, and
the penalty (seven meter) ratio is higher than 56%
we will win the game. Even if the penalty ratio is
lower, this can be compensated with faster
attacks (average attack time less than 36
seconds).
If our attempt effectiveness is 65% or better, but
our defence effectiveness is less than 26%, the
low defence effectiveness can be compensated by
a very high attempt effectiveness (greater than
77%) in order to still win the game.
If the attempt effectiveness is less than 65%, we
can compensate for that by a defence
effectiveness of 34% or more. Otherwise, it is
likely that we will lose the game.
As an alternative to the tree classification method we
have used the support vector machines (SVMs)
technique (Steinwart & Christmann, 2008). Based on
the radial kernel the resulting model reached a
prediction accuracy (of the training data) of
approximately 99%. Unfortunately, SVM models
cannot be described by a simple set of rules as in case
of the tree classifier. SVM models are partially
described in terms of weights of the measured
indicators. The basic insight is slightly different:
The defence effectiveness is most important, then
attempt effectiveness follows and the goalkeeper
effectiveness is ranked third in terms of their
weight.
With a significant distance, the previous
indicators are followed by the penalty success
ratio and the fast break success ratio.
Finally, it is beneficial to have a low average
attack time.
Besides trying to find a combination of indicators that
can be used to predict the outcome of matches, we
also looked at further questions:
“Can we predict the outcome of a game based on
the zone-specific attempt effectiveness?”
No significant patterns were found while
analysing the zone-specific effectiveness. It
seems that the zone-specific effectiveness of the
teams varies too much.
“Can we predict the final rank class of a team
after a season based on the performance
indicators of a team?”
The rank class of a team splits the league table
into multiple sections like “champions league”,
“EHF cup”, “mid-range”, and “declassification
range”.
Unfortunately, we do not have enough data with
sufficient quality to derive accurate patterns for these
questions at this point.
5 PASSES, FOULS, AND
(NON-)SUCCESS
While the work presented in section 4 focusses on
questions from a complete match perspective, we
extended our work by a more attack-oriented view.
Since a match consists of more than 100 attacks, the
probability of attack-success (i.e. scoring a goal) is
highly correlated with winning the game.
Thus, we investigated the properties of attacks by
collecting the detail data using the PassCounter App
in addition to the data collected by the Scouting App.
Up to now, the pass data of 140 matches of the first
league have been recorded (plus 20 other matches).
This allows first insights based on 13,866 attacks
consisting of approximately 183,000 passes and
7,950 sanctioned fouls of the first league, and 2,540
attacks of the other matches consisting of
approximately 30,000 passes and 1,280 sanctioned
fouls.
Since this is work that just has recently been
started, the detailed results have not been verified yet,
due to the relatively small amount of data (at the point
in time this paper was written). However, we can
derive from the collected data that a match in the HBL
consists in average of approximately 1,300 passes and
56 sanctioned fouls (which is about 1 sanctioned foul
every second attack).
As being mentioned before, we do not have
enough data yet to verify some interesting patterns
that have been discovered using data mining
techniques, like association rules. The recently
introduced sensors in the HBL (Kinexon, 2017) will
help to collect pass data automatically if the match
balls are equipped with the sensors in addition to the
players. However, the quality of that recording needs
to be proven first, for instance, based on the data that
we collect using the PassCounter App.
6 CONCLUSIONS
This paper reflects the work of approximately 3 years.
Since there was almost no detailed data of team
handball of sufficient quality when we started, mobile
apps had to be developed first to generate the data for
the later analysis. We are still far from being able to
“decrypt the DNA of a team handball match”, but we
found some first patterns and we can explain some
characterizing properties of the game. Particularly,
we can explain the differences to other games like
soccer and why models that have been developed in
the context of soccer cannot be applied in case of team
handball.
Some coaches use the findings presented in this
paper to evaluate the performance of their team. The
Coaching App provides a feature that allows to use
the numbers as thresholds which drive the colouring
of the graphical representation of the collected data.
For instance, if the goalkeeper’s effectiveness is
significantly below the average of the league, then the
indicator is coloured in red. Furthermore, we do also
provide team specific effectiveness numbers derived
from the historical data of the team.
The actual challenge of team handball is the fact
that the game is a multi-dimensional problem. All
attempts to sufficiently explain the game based on a
single dimension have proven to be inaccurate. With
the availability of multi-dimensional data mining
analytics, we now have a chance to bring the insights
to the next level.
ACKNOWLEDGEMENTS
We would like to thank the DHB for the general
support of the project and the DHL for sharing their
data. Furthermore, we would like to thank the
collaborating teams: the German National teams,
MadDogs TSV Neuhausen, Wild Boys TVB Stuttgart,
Frisch Auf! Göppingen, SG BBM Bietigheim-
Bissingen, and HBW Balingen-Weilstetten.
Furthermore, we would like to express our
appreciation of the time and expertise contributed by
the helping hands who scouted matches (in
alphabetical order): Jelena Braun, Stefanie Freytag,
Heiko Ruess, Matthias Trautvetter, and Susan Zsoter.
REFERENCES
Berger, N. (2019). Big Data raubt dem Sport die Romantik.
Neue Züricher Zeitung.
DHB. (2017). Triumphe, Typen und Tragödien: 100 Jahre
deutscher Handball. (German Handball Federation)
Von https://www.dhb.de/de/redaktionsbaum/news-
archiv/der-dhb/triumphe--typen-und-tragoedien--100-
jahre-deutscher-handball/ abgerufen
HBL. (2019). Statistics of the first German team handball
league (LiquiMoly HBL). Abgerufen am 19. November
2019 von https://www.liquimoly-hbl.de/en/
IHF- International Handball Federation. (2016). IX. Rules
of the Game. Von http://www.ihf.info/files/Uploads/
NewsAttachments/0_New-
Rules%20of%20the%20Game_GB.pdf abgerufen
ionic. (2019). What is Ionic Framework. Abgerufen am 18.
November 2019 von https://ionicframework.com/
docs/intro
Kahnemann, D. (2013). Thinking, Fast and Slow. New
York City: Farrar, Straus and Giroux.
Kinexon. (2017). Real-time Performance Analytics.
Kinexon.
McCallum, J. (2007). Seven Seconds or Less: My Season on
the Bench with the Runnin' and Gunnin' Phoenix Suns.
New York City: Tochstone.
PostgreSQL. (2019). PostgreSQL: The World's Most
Advanced Open Source Relational Database.
Abgerufen am 18. November 2019 von
https://www.postgresql.org/
Provost, F., & Fawcett, T. (2013). Data Science for
Business. Sebastopol, CA: O'Reilly and Associates.
Schwenkreis, F. (2018). A Three Component Approach To
Support Team Handball Coaches. 23rd Annual
Congress of the European College of Sport Science.
Dublin.
Schwenkreis, F. (2018). An Approach to use Deep Learning
to Automatically Recognize Team Tactics in Team Ball
Games. Proeedings of the 7th Conference on Data
Science, Technology and Applications. Porto:
Scitepress.
Schwenkreis, F. (2019). A Graded Concept of an
Information Model for Evaluating Performance in
Team Handball. Proceedings of the 8th Conference on
Data Science, Technology and Applications. Prag.
Schwenkreis, F. (2019). Coaching Support by Collecting
and Analyzing Data (CoCoAnDa). In Opportunities
And ChallengeS for European Projects (S. 220-225).
Scitepress.
Sportradar. (2015). Handball Scout Admin (HAS) Manual.
Sportradar AG.
Steinwart, I., & Christmann, A. (2008). Support Vector
Machines. New York City: Springer.
