
ICs Manufacturing Workflow Assessment via Multiple Logs Analysis
Vincenza Carchiolo
1 a
, Alessandro Longheu
1 b
, Giuseppe Saccullo
2
, Simona Maria Sau
2
and Renato Sortino
1
1
University of Catania, Italy
2
STMicroelectronics, Catania, Italy
Keywords:
Log Mining, Manufacturing Workflow, Big Data, Real-time Analysis, Elasticsearch, Data Visualization.
Abstract:
Today’s complexity in ICT services, consisting of several interacting applications, requires strict control over
log files to detect what exceptions/errors occurred and how they could be fixed. The current scenario is harder
and harder due to the volume, velocity, and variety of (big) data within log files, therefore an approach to
assist developers and facilitate their work is needed. In this paper an industrial application of such log analysis
is presented, in particular, we consider the manufacturing of Integrated Circuits (ICs), i.e. a set of physical
and chemical processes performed by production machines onto silicon slices. We present a widely used
set of open-source tools that join together a platform to allow logs mining to assess manufacturing workflow
processes. We show that the proposed architecture helps in discovering and removing anomalies and slowdown
in ICs production.
1 INTRODUCTION
The idea of a log file is really old, going back to the
beginning of computer era. The need for tracking
what computers do (or do not) during the execution
of any process still underpins the correct functioning
of applications. The increasing complexity in current
ICT services materializes in a rich set of interacting
applications, each one generating its log files at a dif-
ferent (possibly high) rate, with distinct file format
(sometimes not so human-readable) and with contents
at different detail. In the very past, log files were used
both for accountability purposes and also as an inves-
tigation tool by ICT specialists to detect what excep-
tions/errors occurred and how they could be fixed. To-
day’s scenario often requires (in some cases even real-
time) analysis of such logs that becomes harder and
harder in the 3-V - volume, velocity, and variety- big-
data compliant scenario just described (Katal et al.,
2013) (Lu et al., 2014), therefore an approach to assist
developers and facilitate their work is needed. Several
solutions have been developed in recent years to this
purpose, usually consisting of a tool or a group of in-
teracting tools that carry out the following tasks:
a
https://orcid.org/0000-0002-1671-840X
b
https://orcid.org/0000-0002-9898-8808
• gather the set of log files to collect all information
• filter data stored into logs to extract relevant infor-
mation, e.g. via ER patterns
• convey filtered data into a query engine to support
indexing and searching
• visualize queried data in an effective form as
charts and graphs, to support the discovery of hid-
den phenomena; advanced architecture could also
provide more specific mining tools.
In this paper, an industrial application of log analysis
is presented. The scenario concerns the manufactur-
ing of Integrated Circuits (ICs) inside the STMicro-
electronics production facilities (STMicroelectronics,
2020). The manufacturing workflow basically con-
sists of a set of physical and chemical processes per-
formed by production machines onto silicon slices to
turn a group of them (named Lot) into a set of ICs; de-
tails about the production model can be found in (Car-
chiolo et al., 2010).
A wide range of ICs is developed to satisfy
different market requests, ranging from memories
to devices for automotive, imaging/photonics and
power management scenarios, to MEMS, NFC, mo-
tor drivers, and others. Production machines for all
of these devices are managed via a set of integrated
applications generating a huge amount of logs on a
Carchiolo, V., Longheu, A., Saccullo, G., Sau, S. and Sortino, R.
ICs Manufacturing Workflow Assessment via Multiple Logs Analysis.
DOI: 10.5220/0009517208010808
In Proceedings of the 22nd International Conference on Enterprise Information Systems (ICEIS 2020) - Volume 2, pages 801-808
ISBN: 978-989-758-423-7
Copyright
c
2020 by SCITEPRESS – Science and Technology Publications, Lda. All rights reserved
801
24/7/365 basis to trace the (sometimes very complex)
sequence of ICs manufacturing. Anomalies or errors
may arise at some point in the sequence, especially
when new devices are being tested or when new tech-
nologies are being implemented (e.g. switching from
7nm to 5nm process (IEEE.org, 2018)). Because of
the complexity of interacting processes carried out by
machines, a single log analysis could be not enough to
discover where, when and how such anomalies occur,
therefore an effective log investigation is needed, in
particular integrating information coming from multi-
ple machine driving applications to address and solve
production workflow issues for a globally efficient
ICs manufacturing.
This need for exploiting log data goes back to sev-
eral years ago , e.g. in (Longheu et al., 2009) an old-
dated example about the classification of reports (that
are data collection coming from log analysis) is in-
troduced; here the most recent solution to cope with
the current 3-V scenario is presented and discussed
(a quite similar work we recently developed can be
found in (Carchiolo. et al., 2019)). In particular, we
adopt the ELK Stack (Elastic.co, 2020a) as a widely
used enterprise open source platform successfully ex-
ploited in several other contexts, in conjuction with
Kafka broker (Apache software foundation, 2020b)
to integrate sources (logs and databases) making them
available to subsequent log mining tools. We describe
the system and implementation details to highlight
how the solution effectively helps in manufacturing
workflow assessment and improvement.
The paper is organized as follows: in section 2 the
overall architecture is introduced with its main com-
ponents, while in section 3 in-depth details are pro-
vided to describe the ongoing activity. Section 4 pro-
vides an overview of related works where different
scenarios require a similar approach in the log min-
ing task, finally presenting our concluding remarks in
section 5.
2 LOG ANALYSIS
ARCHITECTURE OVERVIEW
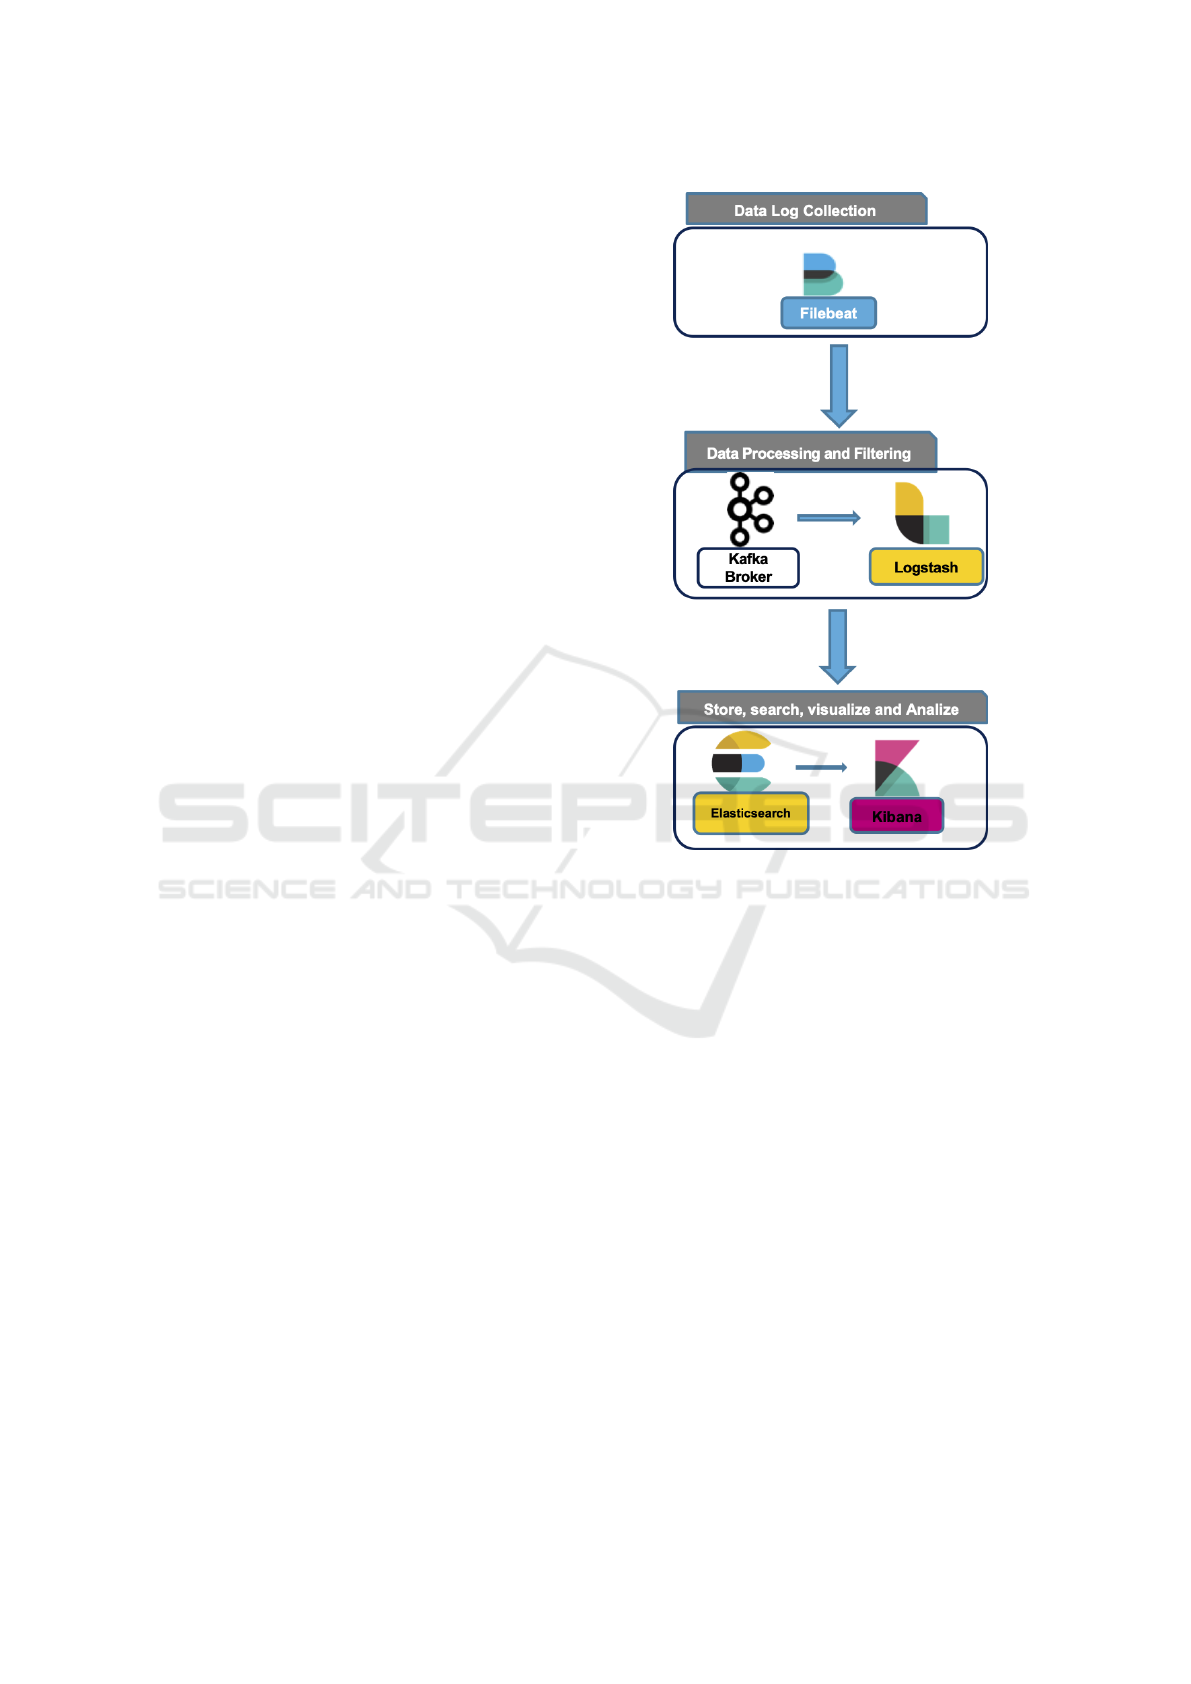
As stated in the introduction, several steps character-
ize a log analysis system; Figure 1 shows the archi-
tecture presented in this paper, and in the following
each element is described in more detail. The starting
point is the set of data sources, where the core busi-
ness relies upon; such sources are characterized by the
3-V Big data properties, therefore, the first element to
manage them is the Data Shipping, consisting of two
modules, namely FileBeat and Kafka in Fig. 1.
Figure 1: System Architecture.
2.1 Extracting and Deliverying Data
FileBeat (Elastic.co, 2020c) belongs to the Beat fam-
ily, a set of products part of the ELK Stack tech-
nology, namely Elasticsearch, Logstash, and Kibana
software (Elastic.co, 2020a). The purpose of File-
Beat is to fetch data from log files, collect and send
them to the other modules. FileBeat includes a set of
so-called harvesters, each one configured for a spe-
cific log file and that reads the file itself on a row ba-
sis. FileBeat can accommodate both inputs as well
as outputs lack, i.e. whenever its output (e.g. Kafka
or LogsTash) is not available, it buffers collected log
lines until the output responds again, whereas if the
input file is moved/renamed during the reading, the
harvester continues to read the file thanks to a unique
identifier for each file. The output sends an acknowl-
edgment to FileBeat hence in case of data loss due
to output and/or FileBeat downtime events, FileBeat
sends again lines starting from the one unconfirmed.
The second module of Data Shipping step
is the Kafka Apache distributed streaming plat-
form (Apache software foundation, 2020b) that re-
ICEIS 2020 - 22nd International Conference on Enterprise Information Systems
802

ceives data from FileBeat and also from production
databases (see sec. 3) and generates a fault-tolerant
durable way data stream for the next module devoted
to data processing, namely Logstash. Kafka supports
the standard publish-subscribe mechanism to manage
its input sources (publishers) as well as output (sub-
scribers); it also arranges data into topics, a logical
grouping of messages sharing some features. Each
topic contains a set of partitions, each being a se-
quence of records; a record is the atomic element
used to build the stream. Partitions help in increas-
ing the parallelism, especially useful for multiple con-
sumers (Logstash instances in our case), also allowing
to scale the amount of data for a given topic. Parti-
tions generally run on a set of servers for fault toler-
ance purposes; which partition is managed by which
server and which consumer is associated with is com-
pletely configurable to achieve the best performances.
Kafka durably persists all its published records
for a specific retention time; when it expires, records
are deleted to free space. Subscribers (Logstash in-
stances) can be configured to consume records from
a specific offset position established by the subscriber
itself, implementing a flexible tail-command like op-
eration that allows tailoring stream receiving to ac-
tual subscriber’s capabilities; moreover, Kafka in-
clude an acknowledgment mechanism to guarantee
that consumers got their data. The management of
offset positions is handled by ZooKeeper (Apache
software foundation, 2020e), a coordination service
for distributed applications part of the Apache Soft-
ware Foundation like Kafka. ZooKeeper manages the
set of servers running Kafka, preventing race condi-
tions and deadlock, and exploiting servers’ states to
redirect a client whenever its related server is down or
the connection is lost.
2.2 Elaborating Data
The next stage of log analysis is the processing of
data, carried out by the Logstash module (Elastic.co,
2020e). As soon as data comes (from Kafka in our ar-
chitecture) an event is triggered and stored in a queue,
from where a thread (one for each input source) peri-
odically fetch a set of events, process them using cus-
tom filters, delivering processed data to other mod-
ules. In the input stage, both the set size and the
number of running threads are fully configurable, and
even the queue can be set as persistent (disk rather
than in-memory) to cope with Logstash unforeseen
crashes. The filter stage is the Logstash core, where
several predefined filters are available and customiz-
able to allow data to be structured, modified, added
or discarded. Filter ranges from standard regular ex-
pressions pattern matching to string-number conver-
sion and vice-versa, check IP addresses against a list
of network blocks or convert IP to geolocalized info,
data split (e.g. from CSV format) or merging, date
conversion, parsing of unstructured event data into
fields, JSON format plug-in and many others. The
last stage of the Logstash pipeline is the output, where
processed data are sent to other modules as Elastic-
Search (as it occurs in our architecture, see fig. 1),
files, services, or tools; output plug-ins are available
to support specific connection.
2.3 Visualizing and Mining Processed
Data
The last module of the proposed architecture includes
two different tools, the former is Elasticsearch and is
used to index and search data previously processed
by Logstash module, whereas the latter (Kibana) en-
dorses an effective and fruitful visualization of pro-
cessed data. Elasticsearch (Elastic.co, 2020b) is an
engine that uses standard RESTful APIs and JSON;
it allows indexing and searching stored data coming
from Logstash.
Elasticsearch runs as a distributed, horizontally
scalable and fault-tolerant cluster of nodes; indices
can be split into shards over separate nodes to im-
prove both searching operations as well as the sys-
tem’s fault-tolerance.
Elasticsearch can be used for several purposes as:
• logs monitoring, adopting a tail -f old-style visu-
alization
• infrastructure monitoring, where either predefined
or customizable metrics can be leveraged extract
and highlight relevant information
• application performance and availability monitor-
ing
Each document inside Elasticsearch is represented as
a JSON object with a key-value pair for each field;
APIs are provided to support full CRUD operations
over documents; optimized relevance models and
support for typo-tolerance, stemming, bigrams are in-
cluded. Full-text searching is performed by leverag-
ing the Lucene engine library (Apache software foun-
dation, 2020c).
The last module of the proposed architecture is
Kibana (Elastic.co, 2020d), that allows us to visual-
ize and navigate data managed by Elasticsearch, pro-
viding a complete set of tools as histograms, line
graphs, pie charts, maps, time series, graphs, tables,
tag clouds, and others. Besides, it comes with ma-
chine learning capabilities that help e.g. in time se-
ries forecasting and anomaly detections; finally, all
ICs Manufacturing Workflow Assessment via Multiple Logs Analysis
803

such tools can be arranged together into dashboards to
provide at-a-glance view of all relevant information.
The displayed information can be easily exported as
PNG/JPG images or CSV raw data.
3 THE SYSTEM AT WORK:
IMPLEMENTATION NOTES
AND TEST SCENARIO
After the description of the general architecture in the
previous section, here we present the actual configu-
ration of the proposed system, also providing details
about the implementation and test scenario.
In particular, we run a couple of FileBeat servers,
one for Windows and another for Linux platform
since logs come from both architectures, whereas a
pair of redundant servers were used for data filter-
ing (Kafka-Logstash) and searching (Elasticsearch-
Kibana); during tests, four applications were cur-
rently involved for a total of about 50 log files.
In the production scenario, the number of manu-
facturing machines is roughly 300, driven by 50 ap-
plications generating up to 500 log files simultane-
ously. Besides, a set of specific apps fetch alarms data
from a Java Message Service (JMS)-based queue to
process and afterward store them in Oracle Databases
(not shown in fig. 1). Both log files and Oracle DB are
used as data sources, managed by the Kafka stream-
ing platform. This production scenario will however
require further evaluations to properly scale resources
needed for effective yet efficient management.
To achieve the best performances for data in-
dexing and searching, based on the most recent -
most queried principle, nodes were recent indices
are stored (hot nodes) were implemented as high-end
servers with local SSD storage, swap memory dis-
abled to improve response time and with a 12GB heap
memory size over a total of 24GB total RAM for each
node. The number of shards was set to 20 per GB
heap, i.e. 200 on a single hot node while the thread
pool size was set to 4096. Conversely, the so-called
warm nodes store long-term read-only indices, there-
fore, relaxed requirements on their performance are
needed. Data transfer from hot to warm nodes oc-
curs when indices on the hot nodes exceed the reten-
tion period we set to 90 days. Our total Elastic index
size is about 5.5GB/day, whereas our minimum sys-
tem size includes the following:
• 2 hot nodes (1 active, 1 replica): 250Gb SSD, 8Gb
RAM
• 2 warm nodes (1 active, 1 replica): 500Gb HDD,
16Gb RAM
Focusing on log files processing, their initial format
is mostly the classical text-based format, i.e. each
row having a timestamp followed by specific info
about the event being logged; another format that also
occurs in our scenario is XML-based. To logically
grouping messages, we defined several topics within
Kafka streaming platform, each featuring a specific
step of the production process (named transaction)
and defined with a set of regular expressions, one
for each log file, for instance, some files have rows
starting with a specific XML tag, whereas in others a
special character identifies the required information.
About 30 topics were defined, using the default Kafka
configuration for the number of partitions they are ar-
ranged into. As indicated above, the retention time
was set to 1.5 months.
The interface provided by Kibana to inquire into
Elasticsearch indexed data allows the definition of
dashboards, as cited in the previous section. In Fig. 2
one of such dashboard is shown, where:
• on the left the search bar is displayed; usually we
specify the name of a production machine, or the
id of a lot we are interested in, o a RegEx to match
a group of error messages
• on the upper part of the dashboard, the graph
beside the search bar is used to trace the lack
of synchronization between applications and the
software interface that manages production ma-
chines. Indeed, whenever this occurs a stop in lots
manufacturing for the next phase is automatically
activated; the analysis of logs aims at discover-
ing when, why, which lots-machine pair(s) deter-
mined that anomaly.
• the bar chart on the upper right part of Fig. 2
shows the number of messages coming from logs
and involved in the synchro lack described above,
grouped by MES (manufacturing execution sys-
tem) operations. In particular, three operations
are shown and also represented in the pie-chart
at the center of the figure; most of them concern
the ScanGo, actually related to the handheld bar-
code wireless scanner used by human operators to
identify lots manually moved from a machine to
the next one during manufacturing.
In Fig. 3 we show the co-occurrence of two anoma-
lies, the one identified with error-code 1 is raised
by a subset of manufacturing operations, whereas the
WIPFLT flat line is the stop in lots production to be re-
duced by discovering and removing triggering factors
via logs analysis; the graph helps in detecting time
instant where both anomalies occur.
Fig 4 shows an example of which type of log mes-
sages (namely, topics) are produced by applications,
ICEIS 2020 - 22nd International Conference on Enterprise Information Systems
804
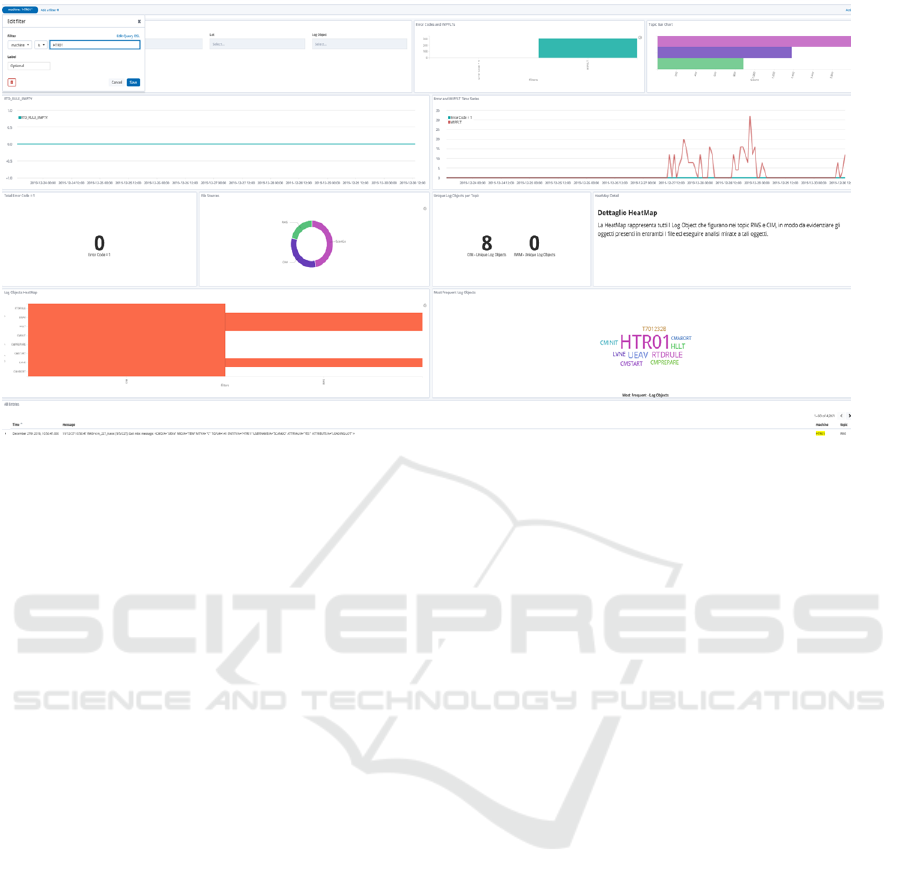
Figure 2: A dashboard defined within Kibana.
in particular, CIM (Computer Integrated Manufactur-
ing) is the software operating at a high-end, whereas
the RWS (Remote Workstream System) is the inter-
mediate layer between CMS and the MES software
driving production machines. Topics just related to
CIM but not to RWS, for instance, denote that the po-
tential anomaly occurs just at the higher level and is
not probably due to hardware related processes; two
of such topics are the RTDRULE concerning business
rules, and the CMTRASF, happening when lots are
moved from a carrier to another for further operations.
4 RELATED WORKS
This section aims to provide an overview of real-
world applications where log analysis endorses pro-
cesses’ effectiveness and/or efficiency. We believe
that a comparison attempt among the following works
and with the one presented here would probably lack
meaningfulness, because of the difference in scenar-
ios such works concern; therefore, we simply outline
each approach to show how relevant is log mining
across different industries.
In (Wang et al., 2019) authors describe a virtu-
alization platform to support their campus NetFlow
log data analysis using the Ceph storage system (The
Ceph foundation, 2020) and the same ELK Stack
we adopt in our proposal. The data rate is approx
38GB/day with more than 8TB collected.
In (Li et al., 2019) web usage log mining is
examined as the process of reconstructing sessions
from raw logs and finding interesting patterns for
purposes as ranking, query suggestion, and recom-
mendation. In this paper, authors propose a cloud-
based log-mining framework that exploits Apache
Spark (Apache software foundation, 2020d) and Elas-
ticsearch in addition to a data partition paradigm de-
signed to solve the data imbalance problem in data
parallelism.
The ELK Stack technology is still adopted in (Pur-
nachandra Rao and Nagamalleswara Rao, 2019)
to perform Hadoop (Apache software foundation,
2020a) FS logfile analysis in assisting the manage-
ment of server and/or storage failures, in particular
showing the frequency of errors by the given period
time using different forms such as trend, bar, pie and
gauge charts.
Real-time online social media data processing
is proposed in (Shah et al., 2018) to discover po-
litical trends, advertising, public health awareness
programs, and policymaking. Authors demonstrate
a solution to effectively address the challenges of
real-time analysis using a configurable Elasticsearch
search engine with a distributed database architecture
and pre-build indexing for large scale text mining.
(Yang et al., 2019) introduces a log management
system for network administrators. The proposed sys-
tem uses ELK Stack with Ceph to provide a safe
network, good Wi-Fi signal strength, and adequate
backup data mechanism, integrating both Wi-Fi log
and NetFlow log data into a single architecture.
Execution anomaly detection in large-scale sys-
tems through console log analysis is addressed
in (Bao et al., 2018). Authors’ propose to replace the
unfeasible manual log inspection first by extracting
ICs Manufacturing Workflow Assessment via Multiple Logs Analysis
805
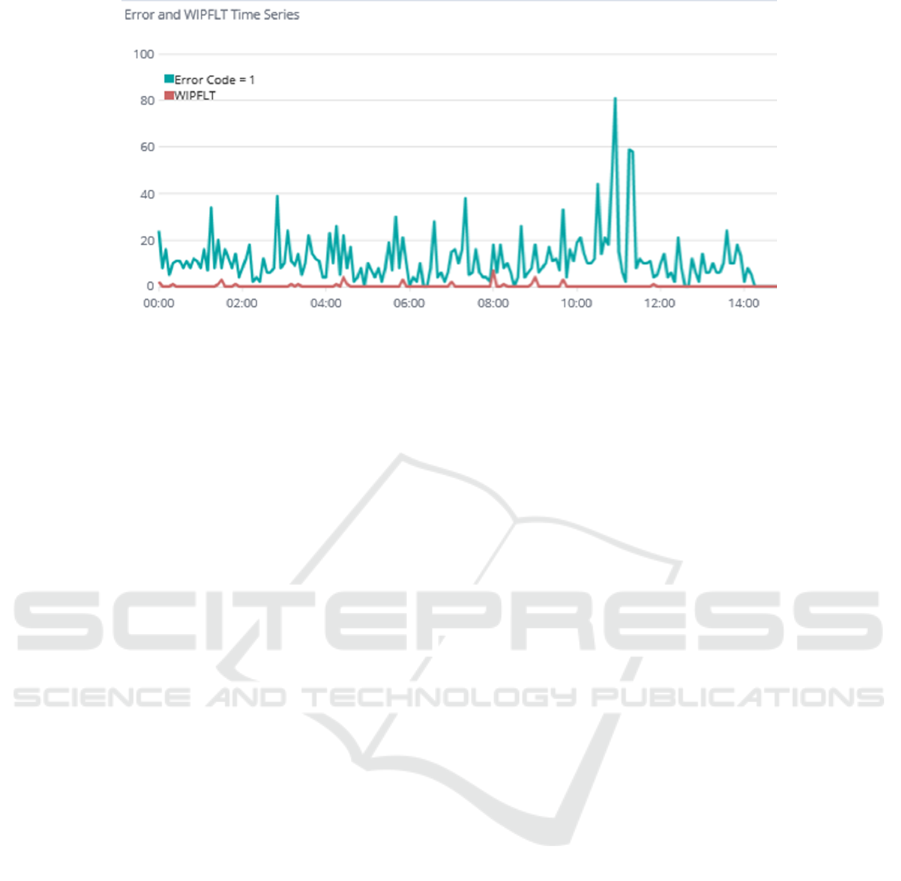
Figure 3: Two anomalies correlation graph (number of occurrences vs time).
the set of log statements in the source code, then gen-
erating the reachability graph to reveal the reachable
relations of log statements, finally exploiting informa-
tion retrieval techniques to parse log files therefore ef-
fectively detecting running anomalies.
Another work about logs mining is discussed
in (Agrawal et al., 2018), where authors introduce a
system which monitors the logs of OpenStack com-
ponents (OpenStack.org, 2020) in real-time and gen-
erates an alert for the information, debug, error, warn-
ing, and trace messages, to effective help administra-
tors in their activity.
The work introduced in (Nagdive et al., 2019)
presents a methodology to preprocess high volume
web log files to detect users’ behavior and thus
identify the potential value hidden within websites’
data, finally assisting administrators in their busi-
ness decision-making process. The proposed en-
terprise weblog analysis system is based on the
Hadoop Distributed File System (HDFS) and related
MapReduce Software Framework and Pig Latin Lan-
guage (Apache software foundation, 2020a).
In (Castro and Schots, 2018), the scenario con-
sidered is that of software development. In particu-
lar, results stored in log files during the testing phase
can be leveraged by developers to understand failures
and identify potential causes. Authors present an in-
frastructure that extracts information from several log
files and presents it in multi-perspective interactive vi-
sualizations that aim at easing and improving the de-
velopers’ analysis process.
(Hamilton et al., 2018) describes the use of Elas-
ticstack within the context of CERN (CERN, 2020),
where more than 200 control applications includ-
ing domains such as LHC magnet protection, cryo-
genics, and electrical network supervision systems
have been developed. Millions of value changes and
alarms from many devices are archived to a central-
ized database; the Elastic Stack is exploited to pro-
vide easy access to such huge data and it can be used
e.g. to detect abnormal situations and alarm miscon-
figuration.
5 CONCLUSIONS AND FUTURE
WORKS
In this paper, we presented a log mining architecture
within an ICs manufacturing context. We outlined
each component, from the gathering to filtering, in-
dexing, and searching modules; moreover, we also
detailed the setup of a real implementation to high-
light how the proposed architecture can be effectively
used as a basis to improve the production workflow
and detect anomalies/errors during the manufacturing
processes.
Further works include
• the deeper investigation, configuration and testing
of data mining algorithms on log files, being this
at a very early stage of development
• the deployment of a properly sized and configured
production environment compliant system
• the development of a complete list of filtering
rules within Elasticsearch to improve logs data
management
• the definition of dashboards set within Kibana,
one for each working group to feature different
departments with specific data they are interested
in.
• the design and implementation of an integrated
intelligent (e.g. machine-learning based) system
to provide a more powerful tool for manufactur-
ing assessment and control, e.g. automatic data-
driven recovery procedures
ICEIS 2020 - 22nd International Conference on Enterprise Information Systems
806
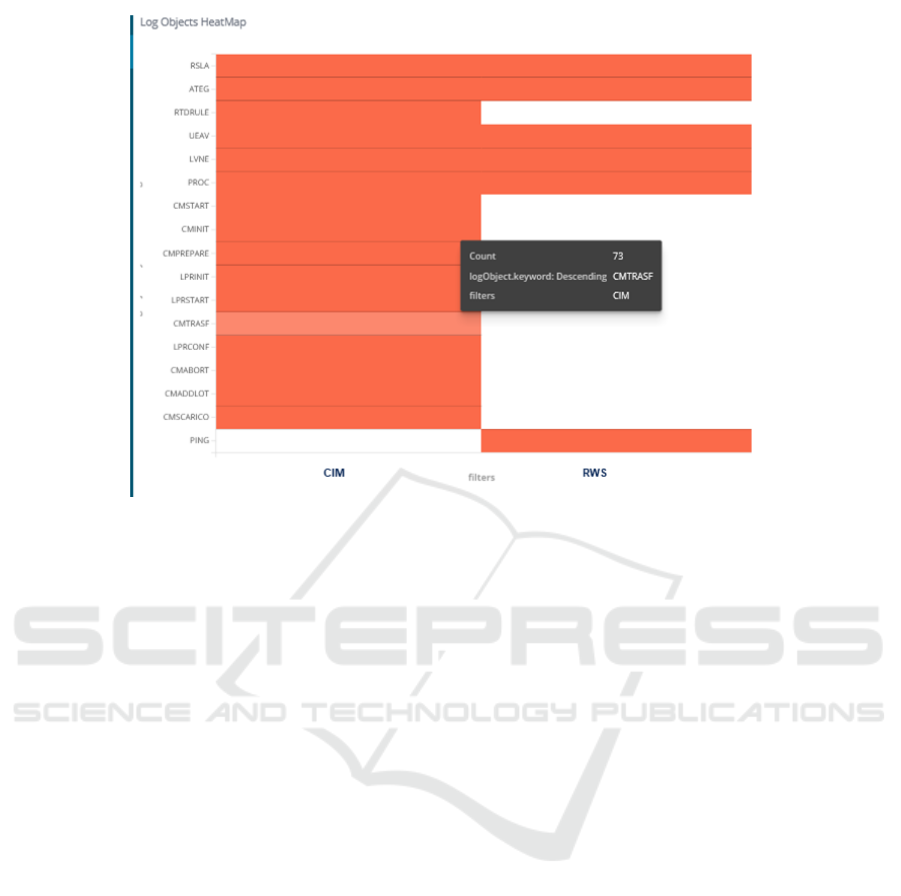
Figure 4: Heatmap showing topics (log messages occurrences) vs CIM/RWS applications.
REFERENCES
Agrawal, V., Kotia, D., Moshirian, K., and Kim, M. (2018).
Log-based cloud monitoring system for openstack.
In 2018 IEEE Fourth International Conference on
Big Data Computing Service and Applications (Big-
DataService), pages 276–281.
Apache software foundation (2020a). Apache Hadoop.
https://hadoop.apache.org/. Accessed: 2020-01-01.
Apache software foundation (2020b). Apache Kafka. https:
//kafka.apache.org/. Accessed: 2020-01-01.
Apache software foundation (2020c). Apache Lucene.
https://lucene.apache.org/. Accessed: 2020-01-01.
Apache software foundation (2020d). Apache Spark. https:
//spark.apache.org/. Accessed: 2020-01-01.
Apache software foundation (2020e). Apache ZooKeeper.
https://zookeeper.apache.org/. Accessed: 2020-01-01.
Bao, L., Li, Q., Lu, P., Lu, J., Ruan, T., and Zhang, K.
(2018). Execution anomaly detection in large-scale
systems through console log analysis. Journal of Sys-
tems and Software, 143:172 – 186.
Carchiolo, V., D’Ambra, S., Longheu, A., and Malgeri, M.
(2010). Object-oriented re-engineering of manufac-
turing models: A case study. Information Systems
Frontiers, 12(2):97–114.
Carchiolo., V., Longheu., A., di Martino., V., and Consoli.,
N. (2019). Power plants failure reports analysis for
predictive maintenance. In Proceedings of the 15th
International Conference on Web Information Systems
and Technologies - Volume 1: WEBIST,, pages 404–
410. INSTICC, SciTePress.
Castro, D. and Schots, M. (2018). Analysis of test log infor-
mation through interactive visualizations. In Proceed-
ings of the 26th Conference on Program Comprehen-
sion, ICPC ’18, pages 156–166, New York, NY, USA.
Association for Computing Machinery.
CERN (2020). CERN Accelerating science. https://home.
cern/. Accessed: 2020-01-01.
Elastic.co (2020a). Elastics. https://www.elastic.co/. Ac-
cessed: 2020-01-01.
Elastic.co (2020b). Elasticsearch. https://www.elastic.co/
products/elasticsearch. Accessed: 2020-01-01.
Elastic.co (2020c). FileBeat. https://www.elastic.co/
products/beats. Accessed: 2020-01-01.
Elastic.co (2020d). Kibana. https://www.elastic.co/
products/kibana. Accessed: 2020-01-01.
Elastic.co (2020e). Logstash. https://www.elastic.co/
products/logstash. Accessed: 2020-01-01.
Hamilton, J., Gonzalez Berges, M., Schofield, B., and
Tournier, J.-C. (2018). SCADA statistics monitor-
ing using the Elastic Stack (Elasticsearch, Logstash,
Kibana). In Proceedings, 16th International Confer-
ence on Accelerator and Large Experimental Physics
Control Systems (ICALEPCS 2017): Barcelona,
Spain, October 8-13, 2017, page TUPHA034.
IEEE.org (2018). International Roadmap for Devices and
Systems 2018 Edition. https://irds.ieee.org/. Ac-
cessed: 2020-01-01.
Katal, A., Wazid, M., and Goudar, R. H. (2013). Big
data: Issues, challenges, tools and good practices. In
2013 Sixth International Conference on Contempo-
rary Computing (IC3), pages 404–409.
Li, Y., Jiang, Y., Gu, J., Lu, M., Yu, M., Armstrong, E.,
Huang, T., Moroni, D., McGibbney, L., Frank, G., and
et al. (2019). A cloud-based framework for large-scale
ICs Manufacturing Workflow Assessment via Multiple Logs Analysis
807

log mining through apache spark and elasticsearch.
Applied Sciences, 9(6):1114.
Longheu, A., Malgeri, M., Carchiolo, V., Mangioni, G.,
Caruso, C., Sau, S., and Saccullo, G. (2009). Effec-
tive classification of enterprise reports in production
assessment. In 2009 Second International Conference
on Future Information Technology and Management
Engineering, pages 286–289.
Lu, R., Zhu, H., Liu, X., Liu, J. K., and Shao, J. (2014).
Toward efficient and privacy-preserving computing in
big data era. IEEE Network, 28(4):46–50.
Nagdive, A., Tugnayat, R., Regulwar, G., and Petkar, D.
(2019). Web server log analysis for unstructured data
using apache flume and pig. International Journal of
Computer Sciences and Engineering, 7:220–225.
OpenStack.org (2020). OpenStack. https://www.openstack.
org/. Accessed: 2020-01-01.
Purnachandra Rao, B. and Nagamalleswara Rao, N.
(2019). HDFS Logfile Analysis Using ElasticSearch,
LogStash and Kibana, pages 185–191. Springer Sin-
gapore, Singapore.
Shah, N., Willick, D., and Mago, V. (2018). A framework
for social media data analytics using elasticsearch and
kibana. Wireless Networks.
STMicroelectronics (2020). STMicroelectronics. https://st.
com/. Accessed: 2020-01-01.
The Ceph foundation (2020). Ceph. https://ceph.io/
ceph-storage/. Accessed: 2020-01-01.
Wang, Y.-T., Yang, C.-T., Kristiani, E., Liu, M.-L., Lai, C.-
H., Jiang, W.-J., and Chan, Y.-W. (2019). The imple-
mentation of netflow log system using ceph and elk
stack. In Hung, J. C., Yen, N. Y., and Hui, L., edi-
tors, Frontier Computing, pages 256–265, Singapore.
Springer Singapore.
Yang, C.-T., Kristiani, E., Wang, Y.-T., Min, G., Lai, C.-H.,
and Jiang, W.-J. (2019). On construction of a network
log management system using elk stack with ceph.
The Journal of Supercomputing.
ICEIS 2020 - 22nd International Conference on Enterprise Information Systems
808
