
Exploring Sentiments of Voters through Social Media Content: A
Case Study of 2017 Assembly Elections of Three States in India
Aman Agarwal and Veena Bansal
Indian Institute of Technology Kanpur, India
Keywords: Sentiment Analysis, Unstructured Data, Campaign Management.
Abstract: Purpose: Winning an election requires more than a good and appealing manifesto. The purpose of this paper
is to establish that content from the social media provides useful insights and can be used to manage an
election campaign provided the right content is properly analyzed. Information such as frequency of mentions,
sentiments of the mentions and demography is obtained analysis. This information provides insights into the
demography of supporters, topics that are most talked about revealing their importance to the voters,
sentiments of voters.
Design/Methodology/Approach: We analyzed 25000 documents from twitter, forums, reviews, Facebook
pages, blogs etc. over a period of 12 months in three states of India using Watson Analytics for Social Media
(WASM) of IBM. We used ETL (extract, transform and load) utility of WASM to fetch the documents for
our chosen themes, topics, dates and sources. WASM deploys deep learning to perform sentiment analysis.
Findings: We found that social media content analysis provides useful insight that goes beyond general
perception and can be used for managing a campaign.
Originality/Value: There have been many efforts where researchers are trying to predict election results
based on social media analysis. However, these efforts have been criticized as predicting election results is a
very complex problem. We, in this work, have shown that social media content can definitely help in gaining
a clear understanding of the sentiments of voters.
1 INTRODUCTION
Sentiment suggests a settled opinion that reflects
one’s feelings. If people express their true opinions
and they are available for analysis, one can analyze
them to gain insight. Sentiment analysis has been
used for classification as well as prediction.
Sentiment analysis requires opinions (data) and
natural language processing techniques. Advent of
big data and deep learning has made sentiment
analysis possible. Sentiment analysis of twitter has
been used to predict election results and number of
seats after the elections (Burnap et al, 2016,
Makazhanov, 2014, Srivastava, 2014). However,
these predictions have been critically evaluated as
predicting election results is an extremely difficult
problem that cannot be solved by analyzing tweets
(Gayo-Avello, 2012). Nevertheless, political parties
are known to use social media to their advantage
during campaign (Ceron et al, 2014, Kapoor &
Dwivedi, 2015, Singh et al, 2017). One can analyze
reviews and classify them as negative, positive and
possibly neutral. In this paper, we analyze web
content including Facebook, twitter, news etc. to gain
insight into the sentiment of voters. These insights
can be used to manage elections campaign (Ahmed et
al, 2016). We review some the relevant work in next
section, research methodology and data analysis are
presented in sections 3 and 4. We conclude our paper
with discussion in section 5.
2 LITERATURE REVIEW
Sentiment analysis is a complicated task. To begin
with, we need to specify the documents that will be
analyzed, their location and the time frame. One
popular source of text/documents has been twitter.
Tweets have been analyzed for finding out the mood
and emotions of public (Bollen et al; 2011). Tweets
over a time period have been extensively analyzed for
predicting election results (O’Connor at el, 2010;
Tumasjan et al, 2010). One can also find out if a party
is being abused on social media. Some of these
596
Agarwal, A. and Bansal, V.
Exploring Sentiments of Voters through Social Media Content: A Case Study of 2017 Assembly Elections of Three States in India.
DOI: 10.5220/0009517105960602
In Proceedings of the 22nd International Conference on Enterprise Information Systems (ICEIS 2020) - Volume 1, pages 596-602
ISBN: 978-989-758-423-7
Copyright
c
2020 by SCITEPRESS – Science and Technology Publications, Lda. All rights reserved

attempts have been critically evaluated and the
conclusion seems to be that election is a complex
phenomenon and limited social media cannot predict
the results (Gayo-Avello, 2012; Skoric et al, 2012).
For one, not everyone uses social media and not
everything that is said on social media is trustworthy
(Castillo, 2011; Eni and Panagiotis, 2010). It involves
classifying sentiments into positive, negative, neutral
or tension, depression, anger, vigor, fatigue,
confusion or a user defined category. Analyst can
provide a labeled list of words for each sentiment or
can augment the default list of the words if one exists
(Ratkiewicz, 2011). There are many such lists in
existence in public domain that come without any
guarantee of being correct and one easily find errors
in the correspondence of sentiment and the word list
(Goncalves et at, 2013). One may use sentiment
analysis to discover the sentiments of the voters if not
to predict the outcome of the elections. Such an
analysis can be done using a supervised machine
learning technique provided labeled data is available.
Machine-learning techniques complimented with real
time ETL capability (Extract, Transform, Load) can
adapt its classification model according to new data
and based on its performance (Pang and Lee, 2008).
It has been shown that combining methods gives
better performance than a single method. Watson
from IBM provides a sentiment analysis application
using its cloud-based platform including ETL
capability. Watson has deep natural language
processing capability. For example, “I am not only
happy, I am also also thrilled” will be categorized as
a positive sentiment in spite the presence of “not”
because of its deep understanding of natural
language.
With Watson (Pang and Lee, 2008), one doesn’t
have to spend time on programming or downloading
the relevant content. Instead, the focus is on defining
the problem statement, providing the required input,
analyzing results and then repeat all three steps if
required. It is a challenge to provide the required
input as knowing the relevant websites, tweet tags are
not simple. The results may also take some
exploration before one is able to make sense and
comprehend them (Pang and Lee, 2008). Sentiment
analysis falls in general category of big data analytics
as it deals with unstructured data from diverse sources
referred to as variety of the data (one of three Vs:
Volume, Velocity and Variety). Watson provides a
dash board for visualization of data in multiple ways.
In the next section, we discuss our research work in
detail.
3 RESEARCH METHODOLOGY
We had assembly elections in India in five states in
February 2017. We decided to work with three states
namely Uttar Pradesh (UP), Uttarakhand (UK) and
Goa. In India, state elections have been cast based
instead of issue based, especially in UP which is the
largest of three states. However, this time, it was not
clear if cast based campaign will work. Indian
economy has been growing at more than 6% for past
10 years now and literacy rate is over 74%. It is
possible that voters are looking beyond their casts and
leaders of their casts. There was a general perception
about the issues that were considered important and
demography of voters in support of each political
party. We had two objectives:
1. Identify if issues are important and what
issues for each state
2. Identify demography of voters
This information can be used to manage election
campaign. As mentioned in the last section, we have
used IBM Watson Analytics for Social Media
(WASM) available on cloud called Bluemix. We
created an account to get access to WASM which is
an integrated environment for extraction,
transformation, loading, analyzing and visualizing
web and social media content. WASM lets you create
various visualizations for insightful discoveries.
WASM environment requires no coding at all which
is a big-time saver. We also don’t need powerful
machines as WASM is on the cloud.
We created three projects under Social Media
Analytics tab, one for each state. The input that
WASM requires from us consists of topics, themes,
dates, languages and sources. Topics and themes
together form the criteria for selecting a document
from the specified sources if it is in the selected
language and within selected dates. In this study, the
topics are the major political parties in each state. For
example, BJP, Samajwadi Party, INC and BSP are the
topics that we specified for UP which are the names
of major political parties in UP. Likewise, we
specified major political parties for Goa and UK.
Right after specifying the topics, WASM starts
participating by making suggestions as it has huge
knowledge base and deep learning capability. WASM
suggests words related to topics including hashtags,
various other similar words for extracting data from
the Internet.
We have the option of specifying two more fields
namely Context and Exclude keywords which will
enhance extraction of relevant data and reduce
Exploring Sentiments of Voters through Social Media Content: A Case Study of 2017 Assembly Elections of Three States in India
597
extraction of irrelevant data from the specified
Internet sources. The keywords we provide for
Context and Exclude keywords are used to pick
content from the Internet. Therefore, it is important to
pick the right keywords. Natural languages,
especially English, has many polysemous words;
context and exclude keywords help in picking the
intended meaning of word. Themes are the attributes
on which Topics are classified and analyzed. We
selected themes based on our own perception. There
are certain global themes that apply to elections of all
states and there are local themes that apply only to
particular states. Some of the common themes across
all three states are: demonetization, development, beef
and casteism. Local themes for UP were electricity,
minority appeasement, Ram mandir and corruption.
We need to adjust the date to match the time frame of
the event. In this study, we have looked at sentiments
of last one year from the date of first day of election,
from 1-01-2016 to 1-02-2017 as the elections were
held in Feb 2017 to March 2017. Currently, Watson
Analytics allows extracting data in seven languages
namely, Arabic, English, French, German, Italian,
Portuguese, Spanish. There is no Indian languages as
of now.
So, we had to choose only English as the preferred
language for data extraction, which means that we can
only analyze data written in English and we will miss
data written in regional languages. Finally, we
specified the following platforms for extracting the
data: Twitter, Forums, Reviews, Facebook, Videos,
and Blogs. In the next section, we present our results
and learnings.
4 RESULTS AND DISCUSSION
Millions of data/documents were extracted,
transformed and loaded by WASM. We used free
edition of WASM that allowed only the latest 25000
documents to be analyzed in one go. WASM creates
multiple relevant visualization of the results that can
be easily analyzed to gain insights. We can find out
how many times each topic has been mentioned in the
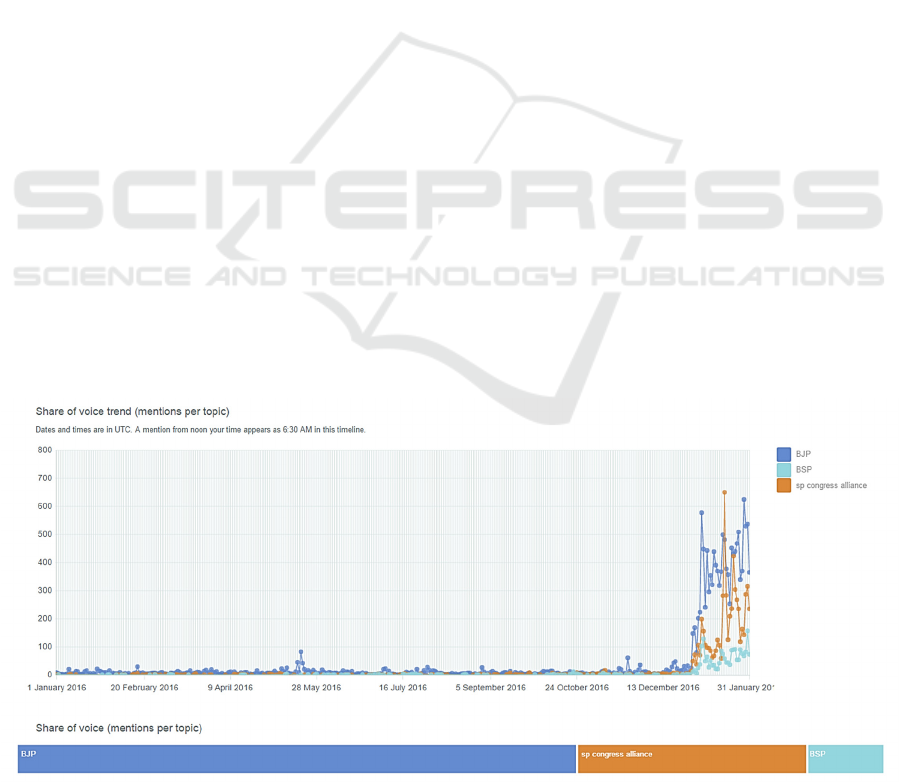
analyzed documents. A snapshot of the mentions per
topic has been shown in Figure 1. It shows that total
16,021 documents were extracted which mention our
topics 23,683 times. Out of those, BJP (topic 1) leads
the Share of Voice (mention per topic) by a good
margin closely followed SP-Congress (topic 2).
Whereas BSP (topic 3) got the least Share of Voice.
Hence, our first finding is as follows.
Finding 1: Campaign managers of BJP can be sure
that their party is being talked about whereas BSP
needs to do something to get attention of voters
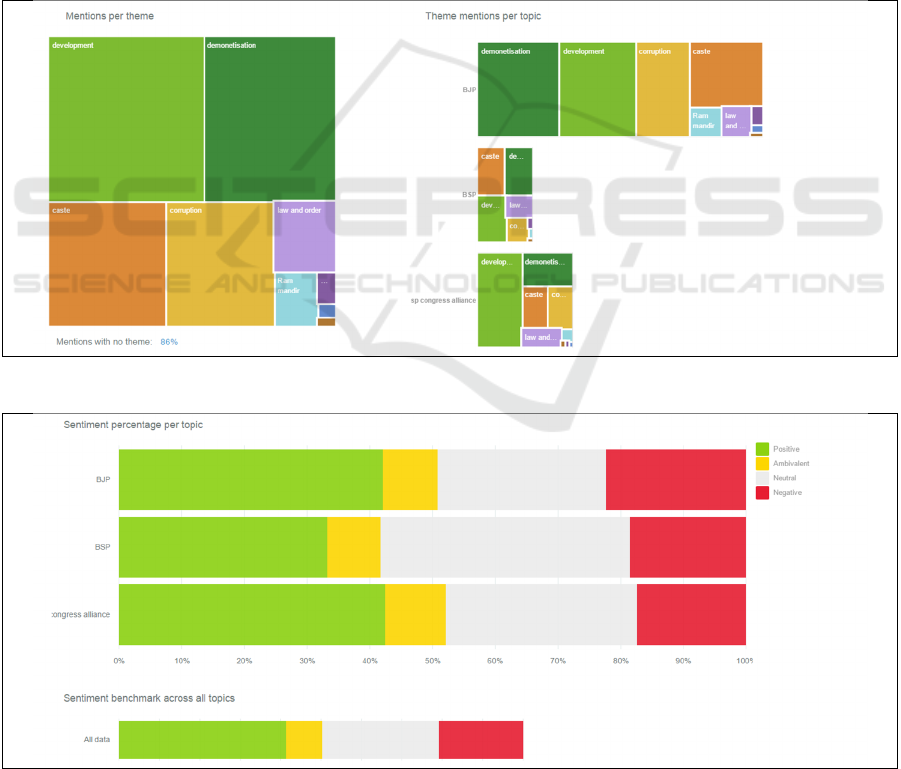
A snapshot of share of voice of each theme by each
topic is shown in Figure 2. The major themes that we
looked at for UP elections are beef, Ram mandir,
development, demonetization, electricity, caste,
corruption, law and order and minority appeasement.
Interestingly very few talked about Ram mandir and
beef issue which have been hot topic for UP in the
past. Development is the most talked about theme.
Figure 2 reveals that BJP is associated with
demonetization, development, corruption and caste.
Just to give a little background, BJP has not been
able to win elections in UP ever. This time also, no
one
was expecting BJP to win elections but they got
a
clear
majority.
When
we
started
this
work,
we
also
Figure 1: Share of voice for each topic.
ICEIS 2020 - 22nd International Conference on Enterprise Information Systems
598
had the same feelings but the analysis results changed
our perception. From this visualization, political
parties can assess what kind of association they have
with various issues in the eyes of the public. Hence
the following finding.
Finding 2. A political party may find out important
themes and association it has with various themes in
the eyes of the voters.
A natural question at this stage is: were the
mentions positive or negative? Sentiment analysis
answers this question in sufficient detail. Figure 3
shows share of positive, negative, ambivalent and
neutral sentiments for each topic. The results in
tabular form give absolute numbers (refer to Table 1).
Hence the following finding.
Finding 3. A political party may find out the nature
of sentiments associated with its mention.
One can also find out the media where topics are
mentioned, demography of the authors and the
location of these mentions as shown in Figures 4, 5
and 6.
If we look at the Twitter data in the sources tab,
we will find that it is dominated by BJP. This presents
an excellent opportunity for BJP to direct its election
campaign efforts towards Twitter and other similar
social media sites. Demography details like gender,
marital and parental status gives useful insights to the
political parties about the section of society which
supports them and make their campaigning strategy
accordingly. Hence the following findings
Finding 4. One may find out what platform is being
used by voters to express their views.
Finding 5. One may find the demography of voters
expressing their views.
Figure 2: Mentions per theme and per topic.
Figure 3: Sentiments for each topic for various themes.
Exploring Sentiments of Voters through Social Media Content: A Case Study of 2017 Assembly Elections of Three States in India
599
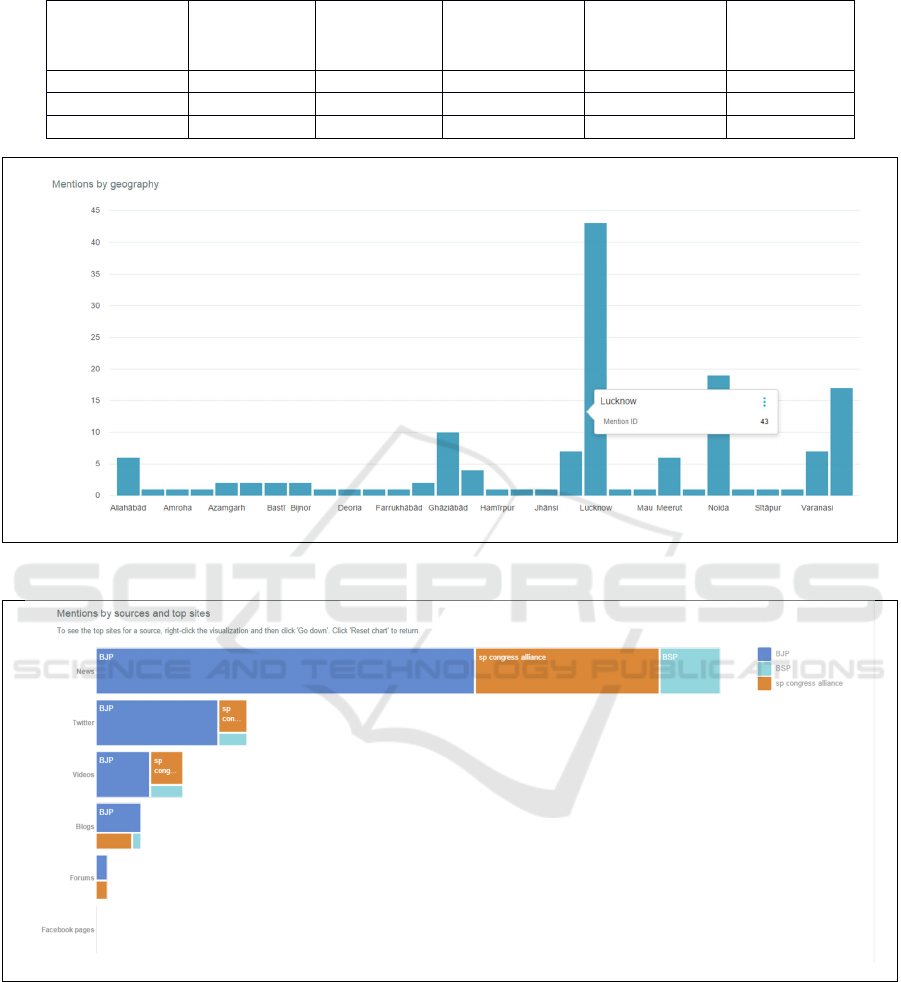
Table 1: Results of sentiment analysis for each topic.
Topic #Number of
Mentions
Positive
Sentiments
(in %)
Ambivalent
Sentiments
(in %)
Neutral
Sentiment
(in %)
Negative
Sentiment
(in %)
BJP 15323 42 9 27 22
SP-Congress 6248 42 10 30 18
BSP 2112 33 8 40 19
Figure 4: Mention of each topic by geography.
Figure 5: Sources of mention.
Findings. One may find out the location of the voters
who are vocal.
Similar analysis for Goa revealed that INC leads
the share of voice by huge margin and the sentiment
by far is positive. The local themes for GOA are Goan
identity and culture and environment. In UK, BJP
leads the share of voice and sentiment is by far
positive. These results are summarized in Table 2.
ICEIS 2020 - 22nd International Conference on Enterprise Information Systems
600

Table 2: Results of sentiment analysis for each topic across three states.
State: UP
Winning Party: BJP
State: UK
Winning Party: BJP
State: Goa
Winning Party: INC
Party (Major) % mention % positive %mention % positive %mention % positive
BJP 64 42 99 44 20 41
SP-INC alliance 26 42 - - - -
INC 1 34 69 44
5 CONCLUSION
We have been able to gain useful insight in spite of
the lack of support for popular Indian languages.
Incidentally, BJP got a clear majority in UP and UK
and INC got little less than clear majority in Goa.
Without WASM, this work would not have been
possible. It took us many trials before we got the right
set of topics, themes, context keywords and exclude
keywords. Domain knowledge plays an important
role. With Internet penetration increasing
exponentially in India, more and more people are
getting associated with social media and taking part
in online discussion. The outcomes are going to
improve further in future and various agencies might
integrate this methodology with poll survey to make
predictions. It is no surprise that campaigns are now
managed by using data and data analytics.
ACKNOWLEDGMENTS
We gratefully acknowledge contribution of IBM and
its employees who helped us in getting access to
WASM and provided initial training.
REFERENCES
Ahmed, S., Jaidka, K., & Cho, J. (2016), “The 2014 Indian
elections on twitter: A comparison of campaign
strategies of political parties”, Telematics and
Informatics, 33(4), 1071–1087.
Bollen, J., Mao, H. and Pepe, A. (2011), “Modeling Public
Mood and Emotion: Twitter Sentiment and Socio-
Economic Phenomena”, Proceedings of the Fifth
International AAAI Conference on Weblogs and Social
Media, 450-453.
Bruns, A. and Stieglitz, S. (2013). “Towards more
systematic Twitter analysis: Metrics for tweeting
activities”, International Journal of Social Research
Methodology, 16 (2), 91–108.
Burnap, P., Gibson, R., Sloan, L., Southern, R., & Williams,
M. (2016), “140 characters to victory?: Using Twitter
to predict the UK 2015 General Election”, Electoral
Studies, 41, 230–233.
Castillo,C., Mendoza, M. and Poblete, B. (2011),
“Information Credibility on Twitter”, WWW 2011,
March 28–April 1, 2011, Hyderabad, India.
Ceron, A., Curini, L., Iacus, S. M., & Porro, G. (2014),
“Every tweet counts? How sentiment analysis of social
media can improve our knowledge of citizens’ political
preferences with an application to Italy and France”,
New Media & Society, 16(2), 340–358.
O’Connor, B., Balasubramanyan, R., Routledge, B.R., and
Smith, N.A. (2010), From Tweets to Polls: Linking
Text Sentiment to Public Opinion Time Series, In
Proceedings of the Fourth International AAAI
Conference on Weblogs and Social Media.
Gayo-Avello, D. (2012), “I Wanted to Predict Elections
with Twitter and all I got was this Lousy Paper” – a
balanced survey on election prediction using Twitter
data. priprint; arXiv:12046441.
Gonçalves, P., Araújo, M., Benevenuto, F. and Cha, M.
(2013), “Comparing and Combining Sentiment
Analysis Methods”, In Proceedings of the first ACM
conference on Online social networks, 27-38, Boston,
Massachusetts, USA.
Jungherr, A. (2013, October). Tweets and votes, a special
relationship: the 2009 federal election in germany.
Proceedings of the 2nd workshop on Politics, elections
and data (pp. 5–14). ACM.
Kapoor, K. K., & Dwivedi, Y. K. (2015). Metamorphosis
of Indian electoral campaigns: Modi’s social media
experiment. International Journal of Indian Culture
and Business Management, 11(4), 496–516.
Makazhanov, A., Rafiei, D., & Waqar, M. (2014).
Predicting political preference of twitter users. Social
Network Analysis and Mining, 4(1), 193.
Mustafaraj, E. and Metaxas, P. (2010), “From Obscurity to
Prominence in Minutes: Political Speech and Real-
Time Search”, In Proceedings of the WebSci10:
Extending the Frontiers of Society On-Line, April 2010.
Pang, B. and Lee, L. (2008), “Opinion Mining and
Sentiment Analysis, Foundations and Trends”, in
Information Retrieval, 2(1–2), 1–135.
Ratkiewicz, J., Conover, M., Meiss, M., Gonçalves, B.,
Flammini, A. and Menczer, F. (2011), “Detecting and
tracking political abuse in social media”, In Proc. 5th
International AAAI Conference on Weblogs and Social
Media (ICWSM).
Exploring Sentiments of Voters through Social Media Content: A Case Study of 2017 Assembly Elections of Three States in India
601

Rob, H. (2012), “The era of cognitive systems: An inside
look at ibm watson and how it works”, IBM
Corporation, Redbooks.
Singh, P., Sawhney, R. S., & Kahlon, K. S. (2017,
November), “Forecasting the 2016 US Presidential
Elections Using Sentiment Analysis”, Conference on e-
Business, e-Services and e-Society (pp. 412–423).
Cham: Springer.
Skoric, M., Poor, N., Achananuparp, P., Lim, E-P., and
Jiang J. (2012), Tweets and Votes: A Study of the 2011
Singapore General Election, In Proceedings of the 45th
Hawaii International Conference on System Sciences,
2012.
Srivastava, R., Kumar, H., Bhatia, M. P., & Jain, S. (2015,
September). Analyzing Delhi assembly election 2015
using textual content of social network. Proceedings of
the Sixth International Conference on Computer and
Communication Technology 2015 (pp. 78–85).
Tumasjan, A., Sprenger, T.O., Sandner, P.G., and Welpe,
I.M. (2010), “Predicting Elections with Twitter: What
140 Characters Reveal about Political Sentiment”. In
Proceedings of the Fourth International AAAI
Conference on Weblogs and Social Media, 2010
ICEIS 2020 - 22nd International Conference on Enterprise Information Systems
602
