
An ICT Platform for the Understanding of the User Behaviours towards
EL-Vs
Maria Krommyda
1
, Richardos Drakoulis
1
, Fay Misichroni
1
, Nikolaos Tousert
1
,
Anna Antonakopoulou
1
, Evangelia Portouli
1
, Mandimby Ranaivo Rakotondravelona
2
,
Marwane El-Bekri
2
, Djibrilla Amadou Kountche
2
and Angelos Amditis
1
1
Institute of Communication and Computer Systems, I-SENSE Group, Athens, Greece
2
AKKA Research, Toulouse, France
maria.krommyda, richardos.drakoulis, fay.misichroni, nikolaos.tousert, anna.antonakopoulou, v.portouli,
Keywords:
Electromobility, Light Electric Vehicles, Dashboard, Data Staging, Data Management, Data Collection, User
Behavior.
Abstract:
Demonstrations of Electrified Light Vehicles (EL-Vs) are organised in six European cities to collect trip data
and users’ perceptions and experiences in order to boost the market uptake of such vehicles by the EU funded
ELVITEN project. Aiming to handle the data flow from the various ICT tools operating in each city and to al-
low data analysis and data visualisation, a fully integrated ICT platform is designed, developed and deployed.
The architecture and the design of the platform, the modules of the system as well as their relations and inter-
actions are presented in this paper. The platform has been designed to collect data generated by the services
and tools in the Demonstration Cities, consolidate the information and facilitate the retrieval, processing and
visualisation of the collected information in a uniform and consistent way among cities and tools.
1 INTRODUCTION
One of the key factors affecting an urban environment
is the mobility of people and goods. Availability of
alternative means of transport, accessibility with cars
and motorbikes, truck allowance and supply capabili-
ties in the city center impact the aesthetics, resiliency,
sustainability and economy of cities along with the
urban quality of life. In the context of smart cities,
scientists are looking for innovative mobility plans
(Chris Luebkeman and Osei, 2015), that support al-
ternative means of transport, vehicle sharing schemas,
mobility as a service, minimization of vehicle owner-
ship as well as greener mobility.
Mopeds and motorbikes, as well as all-terrain ve-
hicles and other vehicles with 3 or 4 wheels that are
significantly smaller than a passenger car are called
L-category Vehicles (LVs)
1
. Due to the reduced trip
time, fuel consumption and time needed to find a
parking place LVs account for a significant percent-
age of urban trips. Particularly motorcycles are very
common in the Mediterranean countries, for example
1
https://ec.europa.eu/transport/road safety/topics/
vehicles/vehicle categories en
in the City of Genoa there are around 24 motorcy-
cles per 100 inhabitants while there are 28,186 trips
by motorcycles in the time slot 7:30-8:30 a.m., com-
pared to 46,965 trips by car
2
. Daily commute trips
can account up to 470,000 daily trips in an urban area
with one million inhabitants
3
. According to official
statistics as they are provided by the Transport for
London
4
, in London the 1.4% of the daily trips are
performed with Light Vehicles (L-Vs).
Electrified L-category Vehicles (EL-Vs) are pro-
posed, based on the importance of the L-Vs to the ur-
ban mobility plan, as a sustainable alternative that can
support the reduction of emissions and minimize the
noise pollution while still providing reduces trip time
and easy parking. While EL-Vs can significantly im-
prove the hassle of the daily commute for urban citi-
zens their market penetration remains low. They are
still limited to less than 1% of the global fleet today
5
.
2
http://www.electraproject.eu/attachments/article/208/
Currentmobilityandnetwork GENOA.pdf
3
http://www.electraproject.eu/
4
http://www.lowcvp.org.uk/assets/presentations/
AddressingL-CategoryBarriersandOpportunities.pdf
5
https://www.iea.org/reports/tracking-transport-2019/
Krommyda, M., Drakoulis, R., Misichroni, F., Tousert, N., Antonakopoulou, A., Portouli, E., Rakotondravelona, M., El-Bekri, M., Kountche, D. and Amditis, A.
An ICT Platform for the Understanding of the User Behaviours towards EL-Vs.
DOI: 10.5220/0009472702330240
In Proceedings of the 22nd International Conference on Enterprise Information Systems (ICEIS 2020) - Volume 1, pages 233-240
ISBN: 978-989-758-423-7
Copyright
c
2020 by SCITEPRESS – Science and Technology Publications, Lda. All rights reserved
233

This is contributed to the following challenges:
• Purchase Cost. Investing in an EL-V has a sig-
nificantly higher cost than the gas operated ones.
The difference in the cost, attributed mainly to the
cost of the battery production, is compensated for
by the reduced cost per kilometer. It requires how-
ever long term commitment and many kilometers
before the use of an electrified L-V becomes prof-
itable.
• Vehicle Reliability. As with any new technological
development the EL-Vs initially were faced with
many issues, including low performance, limited
functionalities, lack of technical support, limited
autonomy and low battery life. Most users, that
do not have direct experiences with the latest up-
graded EL-v models are hesitant to invest due to
all above.
• Infrastructure Availability. The integration of EL-
Vs both the traffic but also the electricity network
is in its infancy. Most countries have limited,
if any, regulations in place regarding the traffic
laws that the users of EL-Vs should comply with.
In addition, there are very limiting parking and
charging places as there is still little known on
how such vehicles are used, what infrastructure
is required of what type and at which locations
(Santucci et al., 2016).
• Range Anxiety. The combination of lack of
knowledge regarding the autonomy that these ve-
hicles can achieve, with the lack of infrastructure
and charging stations has created to the users what
it called range Anxiety. The term is referring to
the uneasiness that the drivers have while operat-
ing an electrified vehicle about the possible need
to re-charge the vehicle during the trip.
In order to support the market penetration of the
EL-Vs in significant numbers, all the above chal-
lenges should be addressed. Advanced usage schemas
and innovative ICT tools should be designed to in-
crease the user direct experience and awareness about
EL-Vs performance. In addition, manufacturers and
market expert can benefit from usage data of EL-Vs
and users perceptions and opinions after experiencing
such vehicles in real conditions. This information is
key to the design of the new generation of such ve-
hicles and for planning and provisioning appropriate
infrastructure and policies for the optimum integra-
tion of such vehicles into Sustainable Urban Mobility
Plans (SUMPs).
Contributions. Aiming to demonstrate the po-
tential of EL-Vs in European Cities we are organis-
electric-vehicles
ing in the context of the ELVITEN
6
project long-term
demonstrations in 6 Cities which cover different Eu-
ropean regions, traffic environments and contextual
background, involving all categories of EL-Vs. This
will facilitate the creation of a big data bank of real
driving and usage data of EL-Vs enriched with user
experiences and opinions from different geographi-
cal regions. The collected information will be anal-
ysed, in order to derive guidelines towards EL-V man-
ufacturers for the new generation of EL-Vs and to-
wards Planning Authorities for the promotion of sup-
port policies and incentives and for the preparation
of the necessary transport and charge infrastructure.
The aim is to collect information from at least 84,000
trips, 26,000 questionnaires, data for the booking, the
charging points, the incentive platform and the gam-
ing ICT Tools. This process results in a rough estima-
tion of one million data objects to be stored. Given the
average size of the corresponding JSON objects the
total volume of data, along with the indices needed,
is estimated to be a few tens of GBs. To achieve this
we have designed an ICT platform that connects ser-
vices and tools available in the Demonstration Cities,
integrates them into one common data model and pro-
vides a dedicated Dashboard for their exploration.
The structure of this paper is as follows. In Sec-
tion 2 we present the overall system architecture, the
modules and data flows as well as the functionalities
that are available to the scientists. In Section 3 we
provide specific details about the technologies used
for the development of the modules.
2 SYSTEM ARCHITECTURE
The ICT platform includes the components that are
responsible for the data flow from the ICT Tools to
the Data Repository, as well as the software for data
extraction and visualisation. This section supplies an
overview of the ICT platform architecture, as shown
in Figure 1, followed by a detailed description of each
software component.
Many heterogeneous data sources, including in-
formation about trips performed using EL-Vs and an-
swers to questionnaires are integrated into the ICT
platform. All data sources provide data through the
middleware which are then forwarded to the Data
Repository. The Data Repository consists of the
Data Staging, the Data Warehouse and the Dashboard.
The Data Staging and the Data Warehouse are di-
rectly connected to the middleware and the Dash-
board. The middleware enables data collection from
6
https://www.elviten-project.eu/en/
ICEIS 2020 - 22nd International Conference on Enterprise Information Systems
234
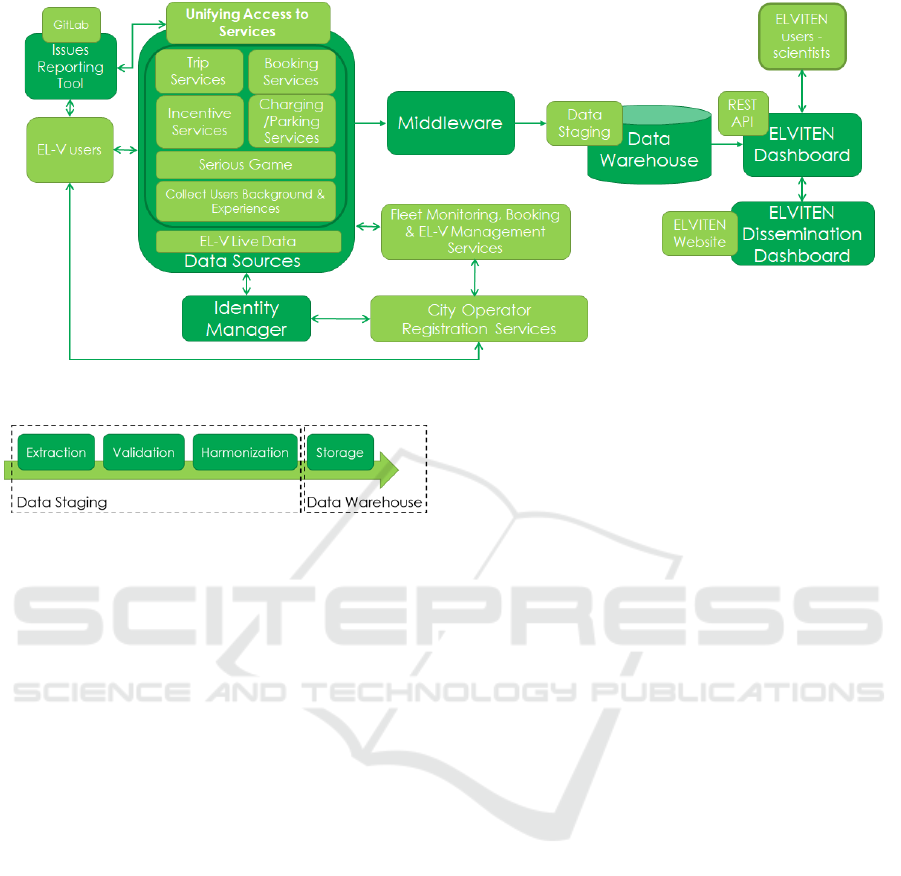
Figure 1: Data Storing Procedure.
Figure 2: Data Management Procedure.
the data sources, while the Dashboard is used to pro-
vide the data to the scientists and the public. The data
management procedure is as follows: at first, data are
extracted from the data sources, they are validated
based on their provider and their content and then they
are transformed to the proper format according to the
data harmonization rules. Finally, they are stored in
the Data Warehouse. The data management proce-
dure is presented in Figure 2.
2.1 Data Sources
The architectural design is modular allowing hetero-
geneous sources to provide their data for the platform.
The provided data should be time and space reference,
associated with a vehicle or user when applicable and
containing information that is of interest. To this end,
the data sources of the platform can be categorized as:
• Booking services for parking, charging and vehi-
cles sharing schemas. This information is of great
importance as it allows scientists to extract valu-
able knowledge about the most convenient ways
for users to share infrastructure.
• Localized gaming applications targeting users un-
familiar with EL-Vs, their capabilities and func-
tionalities. Such applications are of great impor-
tance as they can properly educate the users and
support the market penetration of the EL-Vs.
• Awards and incentives won by loyal users as well
as relevant actions such as award redemption.
Demonstration cities have chosen, in addition to
offering the EL-Vs to their citizen free of charge,
to further incentivise them by giving them awards
proportional to the usage of the EL-Vs.
• Charging information depicting the user behavior,
such as time of charging. This is a crucial infor-
mation for EL-V designer as it provides an insight
on how often and for how long people are willing
to wait for the EL-V to recharge.
• Usage information for vehicles, including time of
use and area traveled. Identifying the areas in a
urban environment that EL-Vs are used the most
can provide further insight about luck of public
transport solutions to that area and lack of acces-
sibility with cars. This can support a better urban
mobility planning through a better overall under-
standing of the city dynamic.
• City inventory for vehicles, charging and parking
spaces. Knowing the available infrastructure is
very important as it allows scientists to judge the
usage information collected through the right per-
spective.
2.2 Data Staging
The Data Warehouse stores data in a predefined way
and with a predefined structure. Due to the hetero-
geneity of the data sources, the received data have
to be converted in order to conform to the require-
ments of the Data Warehouse design. The whole pro-
cess, from the extraction of the data to their storage,
is called extract, transform, load (ETL) (Vassiliadis,
2009) and includes:
An ICT Platform for the Understanding of the User Behaviours towards EL-Vs
235

• The data extraction from homogeneous or hetero-
geneous data sources.
• The data transformation to a proper format or
structure.
• The data loading into the final target Data Ware-
house.
Considering the volume of data to be extracted
from the sources, the ETL process is likely to cause
performance problems. A buffering mechanism avail-
able at the middleware is included in the architectural
design in order to solve this kind of issues. The mid-
dleware provides a temporary storage area between
the data sources and the data storage. It is mainly
used to increase efficiency of ETL processes, ensure
data integrity and support data quality operations. In
the proposed architectural design, the role of the Data
Staging is to receive from the middleware the corre-
lated data from all the ICT Tools and transform them
to the appropriate formats to be stored in the Data
Warehouse. During data staging, the format of the
data is also validated, allowing the identification of
those that are not compliant with the data model.
There are two main challenges regarding the data
harmonization at the Data Warehouse. As the main
storage of all the ICT tools and services, the Data
Warehouse receives data objects with common fields
such as city and date, from many different sources. In
addition, the same data objects are send to the Data
Warehouse by multiple sources. To ensure data uni-
formity many actions were taken so that all common
data fields represent the same information and have
the same format.
To begin with, the enumeration to be followed by
all data providers, when providing the data objects for
the questionnaires, was specified. All data providers
follow a specific, pre-defined enumeration when pro-
viding questionnaire responses. Common examples
of answered questionnaires were provided by all tools
to ensure that the provided enumeration was properly
followed.
Moreover, to ensure date and time uniformity
among the data objects the ISO 8601 regarding ‘Data
elements and interchange formats – Information in-
terchange – Representation of dates and times’ (Wolf
and Wicksteed, 1998) is being followed by all data
providers. In addition, all timestamps are provided
in UTC (Coordinated Universal Time) to eliminate
time differentiation due to time zones. Furthermore,
a common field among most data objects is the city,
in which an action takes place. To ensure uniformity,
it has been decided that the complete names of the
cities is used, Bari, Berlin, Genoa, Malaga, Rome and
Trikala.
Finally, the latest revision of the World Geode-
tic System, the WGS 84 which was established and
maintained by the National Geospatial-Intelligence
Agency since 1984, is used to store all the spatial in-
formation. WGS 84 is the reference coordinate sys-
tem used by the Global Positioning System, available
in most portable devices as well as in the EL-Vs mon-
itored, thus facilitating the collection, integration and
provision of information in a spatially correct way.
2.3 Data Warehouse
As Data Warehouse (DW) (Devlin and Cote, 1996)
we are referring to a system used for reporting and
data analysis and can be used as a core component
of business intelligence. Data Warehouses are central
repositories of integrated data from multiple sources.
They store current and historical data and are used for
creating analytical reports and computing Key Perfor-
mance Indicators (KPIs) (Dolence and Norris, 1994).
The Data Warehouse creates a layer optimized for
and dedicated to analytics to ensure easier reporting
and analysis, it is structured to speed up queries and
make them easy, and it is optimized for efficiently
reading/retrieving large data sets and for aggregating
data. The Data Warehouse contains a number of fact
tables for each of the information types that must be
stored in the ICT platform. These information types
include the following:
• The trip data (GPS and CAN bus data) from the
EL-Vs.
• The data from the various ICT Tools.
• Data from users’ questionnaires answered during
the demonstrations.
The main requirements of the Data Warehouse,
concerning the data storage, are two. The ability to
store all relevant data in a way that allows the efficient
and consistent computation of every defined KPI and
the ability to scale to very large data sizes.
The design of the Data Warehouse is based on the
top-down model, which means that the data are stored
based on a normalized enterprise data model. The
data are stored in the Data Warehouse at the great-
est level of detail, but the repetition of the informa-
tion is eliminated. The normalized structure divides
data into entities creating several tables in a relational
database. This architecture approach has been chosen
for the Data Warehouse due to a number of advan-
tages. To begin with, this approach is straightforward
as far as the addition of information into the database
is concerned; facilitating the role of the Data Stag-
ing and its ability to scale to very large data sizes
without lag in performance. In addition, it can easily
ICEIS 2020 - 22nd International Conference on Enterprise Information Systems
236

scale horizontally to include any additional services
that may be of interest to the platform.
The main disadvantage of this approach is that,
because of the number of tables involved, it can be
difficult for users to join data from different sources
into meaningful information and to access the infor-
mation without a precise understanding of the sources
of data and of the data structure of the Data Ware-
house. This disadvantage is not materialized here
given that the tables are not heavily interconnected
and have been carefully designed to facilitate the
computation of KPIs in an efficient and meaningful
way.
2.4 Data Provision
Data Warehouse API. For this purpose, a REST-
ful API (Masse, 2011) has been selected and im-
plemented for its simplicity, performance, scalabil-
ity, and modifiability. REST stands for Representa-
tional State Transfer. It relies on a stateless, client-
server, cacheable communications protocol and, in
virtually all cases, HTTP (Hypertext Transfer Proto-
col) is used. In a REST API, data and functionality are
considered resources and are accessed using Uniform
Resource Identifiers (URIs). Resources are manipu-
lated using a fixed set of four create, read, update,
delete operations: PUT, GET, POST, and DELETE.
Any data marked as cacheable may be reused as the
response to the same subsequent request Since the
data should not be modified or deleted, only GET
operation is supported by the Data Warehouse API.
JSON has been the selected format for the returned
data The web API exposes the following resources:
• Awards and incentives (/award, /incentive, /user)
• Bookings (/booking, /bookingcharging, /booking-
parking, /bookingvehicle)
• Charging information (/charging)
• Trips (/coachdata, /trip)
• Serious game results (/seriousgame)
• City resources (/cityresources)
Dashboard. A very important requirement for the
ICT platform is the accessibility to all data stored in
the Data Warehouse for analysis purposes. Addition-
ally, it has to offer a visualisation of the KPIs in sim-
ple yet meaningful ways. To cover this need a web-
application, the Dashboard has been developed.
Through its user interface, the Dashboard presents
the resources in tables, while enabling the user to fil-
ter the contents and isolate the information of interest.
Figure 3: Booking table overview.
In Figure 3, an overview of the table with the informa-
tion for the EL-Vs booking is presented, the table can
be sorted by any of the fields, here the information is
sorted by date, and filtered by the main fields. The
visualised data can be extracted in a convenient for-
mat (CSV or JSON), to be used for further analysis.
The Dashboard’s functionality however is not limited
to raw data access. It is offering also a visualisation
of the KPIs.
Although not considered as “data”, the KPIs are
another important piece of information that needs to
be disseminated. A dedicated process that makes use
of these formulas is developed, to calculate all the
KPIs in a monthly basis. At first, all the relevant data
are retrieved from the Data Warehouse. Then, cor-
relations are performed using unique identifiers such
as the user ID and the vehicle IMEI and other crite-
ria like time filtering. Finally, the KPIs are calculated
and their values are updated and stored in a dedicated
local database.
As shown in Figure 4, a user accessing the Dash-
board is able to view the latest values for the KPIs.
Here, the calculated KPIs are related to the user sat-
isfaction with the services and performance of the
ICT tools. Common data visualizations, such as bar
charts, maps, line charts, scatter plots, pie charts,
gauges and tables are chosen according to the specific
KPI to be presented. In Figure 6 the overview of the
data collected for the city of Trikala is shown, for each
measurement the proper visualization charts has been
used to facilitate the understanding of the displayed
information.
In addition, the Dashboard incorporates an SQL
Explorer, as shown in Figure 5, that allows authenti-
cated users to run SQL SELECT queries over the data
available in the Data Warehouse. The SQL Explorer
allows the user to see the database schema.
An ICT Platform for the Understanding of the User Behaviours towards EL-Vs
237
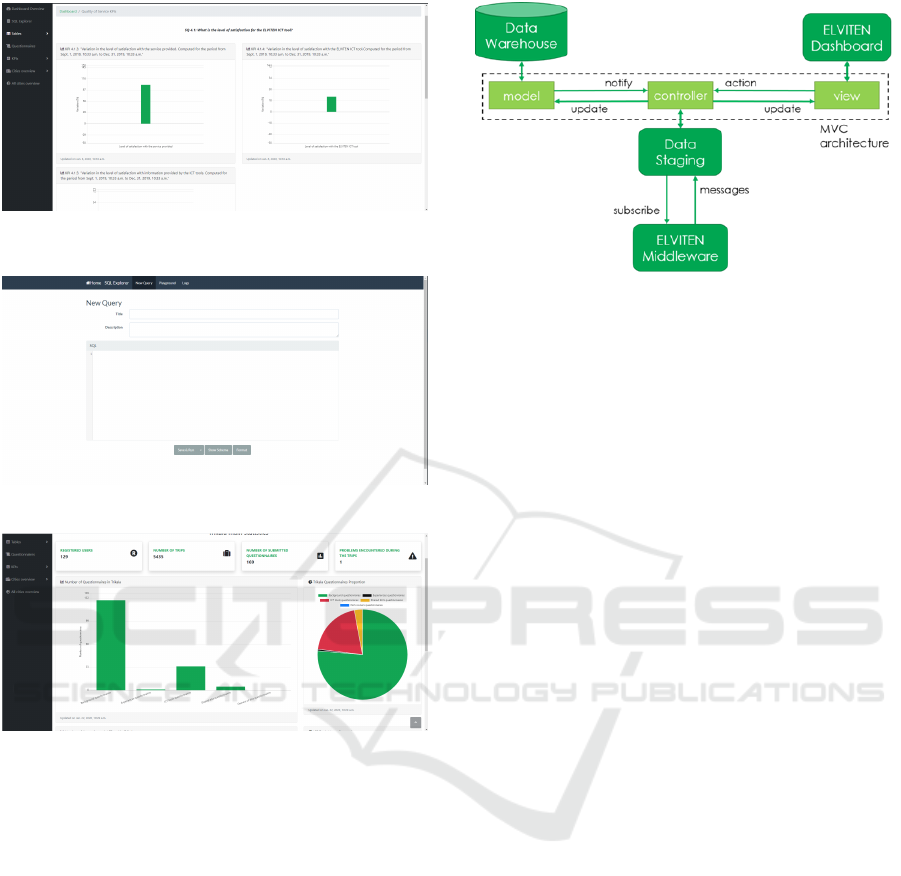
Figure 4: Visualization of the calculated KPIs regarding the
satisfaction from the ICT tools.
Figure 5: SQL Explorer overview.
Figure 6: Demonstration city statistics overview.
3 SYSTEM IMPLEMENTATION
From the implementation point of view, both the Data
Staging and the Dashboard need to be tightly cou-
pled with the Data Warehouse in order to achieve the
desired performance of their individual functionali-
ties. More specifically, they should be implemented
in a way that enables them to have direct access to
the Data Warehouse, ideally without any intermedi-
ate interface. However, all three components have to
offer interfaces for communicating with their depen-
dent components. To avoid this, the design pattern
of Model-View-Controller (MVC) (Leff and Rayfield,
2001) has been adopted to link the Data Staging, the
Data Warehouse and the Dashboard together and pro-
vide interfaces for communication with all other com-
ponents.
In the MVC pattern, an application is divided into
the following three interconnected components:
Figure 7: Model-View-Controller architecture.
• The model, which represents the knowledge. A
model could be everything from a single object to
a large structure of objects.
• The view, which is a visual representation of the
model.
• The controller, which controls the flow of infor-
mation between the model and the view.
In our case, the model represents the structure and
is responsible for managing the data in the Data Ware-
house. The view is the user interface of the Dash-
board, which is responsible to visualise the model in
a particular format. Finally, the controller handles
all communications and interactions among the Data
Staging, the Data Warehouse and the Dashboard. It
additionally offers the possibility to expose a Web
API for communication with external components.
The proposed architecture is showed in Figure 7. It
is clear that each one of the three component interacts
with only one of the MVC components.
The data model is implemented in the Data Ware-
house in a relational database that allows the defini-
tion of clear roles with appropriate rights, allowing
the Data Staging to store information and the Dash-
board to query the data. Given the purpose and role
of the Data Warehouse, and the importance of the his-
torical data to the computation of the KPIs no dele-
tion of data is allowed. The Data Staging (using the
controller) has two main responsibilities. To link the
middleware with the Data Warehouse and to validate
and convert the received data to conform to the re-
quirements of the Data Warehouse.
In order to receive messages from the middleware,
it implements a subscriber to act as a message con-
sumer. When the consumer receives the message, it
validates it, by checking for violations on used data
types and ranges, data structure or duplicate values
etc. If an error occurs, it is corrected and converted
accordingly and then it is forwarded to the Data Ware-
house for storage purposes.
ICEIS 2020 - 22nd International Conference on Enterprise Information Systems
238

Finally, the communication between the Dash-
board and the Data Warehouse is handled by the se-
lected MVC framework. The Dashboard is accessed
through a web browser and forwards all user actions
to the controller, which communicates with the Data
Warehouse and updates the view accordingly.
Data Staging Technologies. Django (Forcier et al.,
2008) has been selected as the underlying framework
to enable the functionalities and communications pre-
sented above. Therefore, the Data Staging is being
implemented in Python programming language. The
data extraction part, which is the consumer part of the
RabbitMQ architecture, uses the Pika library
7
, a pure-
Python implementation of the AMQP 0-9-1 protocol,
which is the recommended solution by the RabbitMQ
team (Boschi and Santomaggio, 2013).
To support the data validation part, the Django
framework has been enhanced with the Django REST
framework (Holovaty and Kaplan-Moss, 2009),
which offers the ability to define custom data serializ-
ers. Data validation is based on JSON schema and on
serializers’ validation functionality. Upon validation,
data are deserialized and stored directly in the Data
Warehouse using the Django mechanisms.
Data Warehouse Technologies. The Data Ware-
house is deployed as a PostgreSQL (Momjian, 2001)
database. The structured, clearly defined and unmod-
ifiable data model led to the decision of using a rela-
tional database for the data storage.
PostgreSQL offers full support for all the func-
tionalities of the Structured Query Language (SQL),
geometric data types including a point of floating
numbers necessary for the storage of the GPS coor-
dinates as well as a wide range of indices that can be
used to support the computation of the KPIs.
PostgreSQL supports GiST indexes which are not
a single kind of index, but rather an infrastructure
where many different indexing strategies can be im-
plemented. Accordingly, the operators with which a
GiST index can be used vary depending on the in-
dexing strategy (the operator class). This is very im-
portant as it allows spatial queries over several two-
dimensional geometric data types. In addition, it of-
fers GIN indices which are appropriate for data val-
ues that contain multiple component values, such as
arrays. This allows the flexibility for multiple choice
answers. Multicolumn indices and indices on expres-
sions are also used to support the computation of the
KPIs when needed.
Dashboard Technologies. The Dashboard is a web
application that accesses the data using the above-
mentioned RESTful API and it is using common web
technologies, i.e. HTML, CSS and JavaScript. For
7
https://pika.readthedocs.io/en/stable/
the KPI visualisation purposes, JavaScript libraries
such as Chart.js (Downie, 2015) and Plotly (Sievert
et al., 2017) are used.
The ICT platform is a distributed system, conse-
quently, its individual components are deployed on
separate machines which communicate to each other
using the network.
On the one hand, the data adapters are imple-
mented in the corresponding ICT Tool, in order to
enable messages transmission to the middleware. The
various copies of the message publishers are delivered
to all interested partners, along with the appropriate
credentials to access the exchange. In order to acti-
vate the API and send the JSON messages, the Data
Adaptor part needs to be created by the partner that is
responsible for the relevant ICT tool.
On the other hand, the components of the ICT
Platform, namely the middleware, the Data Staging,
the Data Warehouse and the Dashboard, are deployed
on private cloud infrastructure. In order to assure the
high availability of the provided services, a cluster of
servers is considered for each ICT Platform compo-
nent.
Load balancers can be used in order to reduce la-
tency and to ensure a fault-tolerant configuration. A
NGINX web server
8
is used to provide a load bal-
ancer and reverse proxy. It must be noted, however,
that the load on the majority of the ICT Platform com-
ponents is expected to be small so this solution will
only be implemented in case that performance issues
are identified during the demonstrations.
Multiple instances of components that are ex-
pected to have increased workload are deployed. The
instances are designed in a way that allow them to
perform their work in parallel and independently from
each other. This mechanism is applied in Data Stag-
ing in order for the data manipulation, consuming,
processing and validating data coming from the mid-
dleware, and the storage to be performed faster and
the fault tolerance of the system to be increased.
In the Data Warehouse that incorporate a database,
it must be ensured that the stored data is always avail-
able and cannot become unusable, corrupted or lost.
For this purpose, the underlying databases must be
replicated on other machines. To deal with data syn-
chronisation, a synchronous solution is being imple-
mented: a data-modifying transaction is not consid-
ered committed until all servers have committed the
transaction. This guarantees consistency after a fail-
ure.
Cybersecurity and Privact Aspects. Cybersecurity
and privacy mechanisms have been implemented in
the platform presented in this paper in order to as-
8
https://www.nginx.com/
An ICT Platform for the Understanding of the User Behaviours towards EL-Vs
239

sure confidentiality, integrity and availability of the
data and comply to the GDPR. The confidentiality of
the communications between the different entities of
the platform is assured by using TLS protocol. Ad-
ditionally, confidentiality and integrity of data is en-
sured by encryption techniques and regular backups.
Other tools such as firewalls are used in every server
hosting components of the platform as the majority of
this servers are exposed to the internet. Firewalls en-
ables the blocking of unwanted access to the servers
without disrupting its normal operation. Also, MAC
address filtering is being considered for machine to
machine communication. As most of the servers are
based on Linux operating systems hardened versions
are considered. In order to protect the privacy of the
users, no personal data is collected and stored directly
in the Data warehouse.
4 CONCLUSIONS
We presented here a fully integrated ICT platform that
allows scientists to gain insights about the user be-
haviours towards EL-Vs, extract knowledge, patterns
and additional information that can facilitate the cre-
ation of Sustainable Urban Mobility Plans and guide-
line for manufacturers and market experts.
ACKNOWLEDGEMENT
This work is a part of the ELVITEN project.
ELVITEN has received funding from the European
Union’s Horizon 2020 research & innovation pro-
gramme under grant agreement no 769926. Content
reflects only the authors’ view and European Com-
mission is not responsible for any use that may be
made of the information it contains.
REFERENCES
Boschi, S. and Santomaggio, G. (2013). RabbitMQ cook-
book. Packt Publishing Ltd.
Chris Luebkeman, William Baumgardner, J. O. R. M. K. A.
and Osei, A. (2015). Intelligent connectivity for seam-
less urban mobility. Technical report, Arup and Qual-
comm Smart Cities.
Devlin, B. and Cote, L. D. (1996). Data warehouse:
from architecture to implementation. Addison-Wesley
Longman Publishing Co., Inc.
Dolence, M. G. and Norris, D. M. (1994). Using key
performance indicators to drive strategic decision
making. New directions for institutional research,
1994(82):63–80.
Downie, N. (2015). Chart. js— open source html5 charts
for your website. Chart Js.
Forcier, J., Bissex, P., and Chun, W. J. (2008). Python web
development with Django. Addison-Wesley Profes-
sional.
Holovaty, A. and Kaplan-Moss, J. (2009). The defini-
tive guide to Django: Web development done right.
Apress.
Leff, A. and Rayfield, J. T. (2001). Web-application devel-
opment using the model/view/controller design pat-
tern. In Proceedings fifth ieee international enterprise
distributed object computing conference, pages 118–
127. IEEE.
Masse, M. (2011). REST API Design Rulebook: Design-
ing Consistent RESTful Web Service Interfaces. ”
O’Reilly Media, Inc.”.
Momjian, B. (2001). PostgreSQL: introduction and con-
cepts, volume 192. Addison-Wesley New York.
Santucci, M., Pieve, M., and Pierini, M. (2016). Electric
l-category vehicles for smart urban mobility. Trans-
portation Research Procedia, 14:3651 – 3660. Trans-
port Research Arena TRA2016.
Sievert, C., Parmer, C., Hocking, T., Chamberlain, S., Ram,
K., Corvellec, M., and Despouy, P. (2017). plotly:
Create interactive web graphics via ‘plotly. js’. R
package version, 4(1):110.
Vassiliadis, P. (2009). A survey of extract–transform–load
technology. International Journal of Data Warehous-
ing and Mining (IJDWM), 5(3):1–27.
Wolf, M. and Wicksteed, C. (1998). Date and time for-
mats. W3C NOTE NOTE-datetime-19980827, August,
page 26.
ICEIS 2020 - 22nd International Conference on Enterprise Information Systems
240
