
Assessing the Vertical Accuracy of Worldview-3 Stereo-extracted
Digital Surface Model over Olive Groves
Fran Domazetović
1a
, Ante Šiljeg
1b
, Ivan Marić
1c
and Mladen Jurišić
2d
1
University of Zadar, Department of Geography, Trg kneza Višeslava 9, 23 000 Zadar, Croatia
2
University of Osijek, Faculty of Agriculture, Vladimira Preloga 1, 31000, Osijek, Croatia
Keywords: Worldview-3 Stereo Imagery, UAV Photogrammetry, VHR DSMs, Vertical Accuracy.
Abstract: Worldview-3 stereo-extracted DSMs represent state-of-the-art products in the domain of satellite-based
digital surface modelling. Main goal of our research was to evaluate the vertical accuracy of WV-3 derived
DSMs over olive groves. Creation of high-accuracy WV-3 derived DSMs would allow efficient large scale
management and protection of this valuable agricultural resource.
Vertical accuracy of WV-3 derived DSM was evaluated at two test sites within Olive Gardens of Lun (Pag
Island, Croatia), through the comparison with reference UAV photogrammetry derived VHR DSM. Two test
sites were selected by object-based approach, established on spectral (NDVI, VARI) and height information
(digital olive models (DOMs)). While first test site covers one single, individual oldest olive tree (45 m²),
second test site covers larger area (2500 m²) with dense, unattended olive trees.
Although vertical accuracy of individual olive trees still significantly deviates from reference model (RMSE
= 3.604 m; MAE = 3.203 m), accuracy within larger test was much better (RMSE = 1.462 m; MAE = 1.127
m). This demonstrated that WV-3 stereo imagery has great potential for application in creation of DSMs over
large scale forested areas, that would be hard to cover with field geospatial techniques (e.g. LiDAR or UAV
photogrammetry).
1 INTRODUCTION
In recent years very high resolution (VHR) optical
satellite stereo imagery allowed extensive extraction
of digital surface models (DSMs) with application in
broad range of scientific fields (Aguilar et al., 2019).
With the emergence of commercial satellites (e.g.
IKONOS, Pleiades, GeoEye, Worldview), stereo
satellite imagery has become known as cost and time
effective method for creation of DSMs over large
areas (Shean et al., 2016; Goldbergs et al., 2019).
Although such DSMs lack the detail and resolution of
models created with field geospatial methods like
LiDAR or UAV photogrammetry, they require
minimal field deployment (Wang et al. 2019), thus
shortening the overall modelling process. If spatial
extent of created DSMs is considered, satellite stereo
imagery represents relatively inexpensive data
collection method, where single collected stereo-pair
a
https://orcid.org/0000-0003-3920-6703
b
https://orcid.org/0000-0001-6332-174X
c
https://orcid.org/0000-0002-9723-6778
d
https://orcid.org/0000-0002-8105-6983
image covers large swaths of Earth’s surface
(Goldbergs et al., 2019).
Development of satellites from Worldview
constellation has significantly advanced the
capabilities of capturing multispectral and stereo
satellite imagery with sub-meter ground sampling
distance (GSD) (Aguilar et al., 2013; Aguilar et al.,
2014). Currently most advanced commercial satellite
is Worldview-3 (WV-3), launched in August, 2014.
WV-3 provides highest commercially available
spatial resolution (one 0.31 m panchromatic band and
eight 1.24 m multispectral bands) of collected
satellite images, along with very large daily collection
capacity (up to the 1 200 000 km²) (Maxar
Technologies, 2019A). Stereo imagery is collected by
WV-3 on the daily basis, where images of specific
locations of interest are being collected from different
angles, along the in-track orbit, within minimal time
interval (Maxar Technologies, 2019A). Short
246
Domazetovi
´
c, F., Šiljeg, A., Mari
´
c, I. and Juriši
´
c, M.
Assessing the Vertical Accuracy of Worldview-3 Stereo-extracted Digital Surface Model over Olive Groves.
DOI: 10.5220/0009471002460253
In Proceedings of the 6th International Conference on Geographical Information Systems Theory, Applications and Management (GISTAM 2020), pages 246-253
ISBN: 978-989-758-425-1
Copyright
c
2020 by SCITEPRESS – Science and Technology Publications, Lda. All rights reserved
collection interval between two stereo images ensures
that changes (e.g. atmospheric conditions, land-cover
change, moving targets, etc.) at target location are
minimal, thus minimalizing the potential image
matching error.
As WV-3 stereo-extracted DSMs represent state-
of-the-art products in the domain of satellite-based
digital surface modelling, main goal of our research
was to evaluate the vertical accuracy of such DSMs
over olive groves. Assessment of vertical accuracy
for DSM produced from WV-3 stereo-pair image
(DSM
) was based on comparison with reference
VHR DSM (DSM
) produced with the unmanned
aerial vehicle (UAV) photogrammetry. UAV
photogrammetry was chosen for creation of reference
DSM, as practical and cost effective geospatial
method that allows creation of accurate and reliable,
high-quality VHR DSMs over terrains with
noticeable vegetation presence (Mohan et al., 2017;
Tomaštík et al., 2017; Krause et al., 2019).
Although overall quality of DSMs derived from
Worldview stereo imagery was already evaluated in
some previous researches, their main focus was
mostly on comparison with reference LiDAR data
(Shean et al., 2016; Aguilar et al., 2019; Goldbergs et
al., 2019; Nemmaoui et al., 2019; Rizeei & Pradhan,
2019) and on accuracy of extraction of various man-
made structures (e.g. buildings (Qin, R., 2014),
plastic greenhouses (Aguilar et al., 2019; Nemmaoui
et al., 2019), etc.).
In our research we have decided to concentrate on
assessment of vertical accuracy of DSM over olive
groves, as important specific land cover type, that
covers large areas of Mediterranean and serves as one
of the main agricultural sources of income and
development (Orlandi et al., 2017). Detailed DSMs of
olive groves are the basis for efficient management
and protection of this valuable agricultural resource,
as they can provide unprecedented insight into all
spatio-temporal changes that are occurring within the
groves (Jiménez-Brenes et al., 2017). Therefore,
possibility of application of WV-3 stereo imagery for
creation of high-quality DSMs would significantly
improve large scale management and protection
efforts.
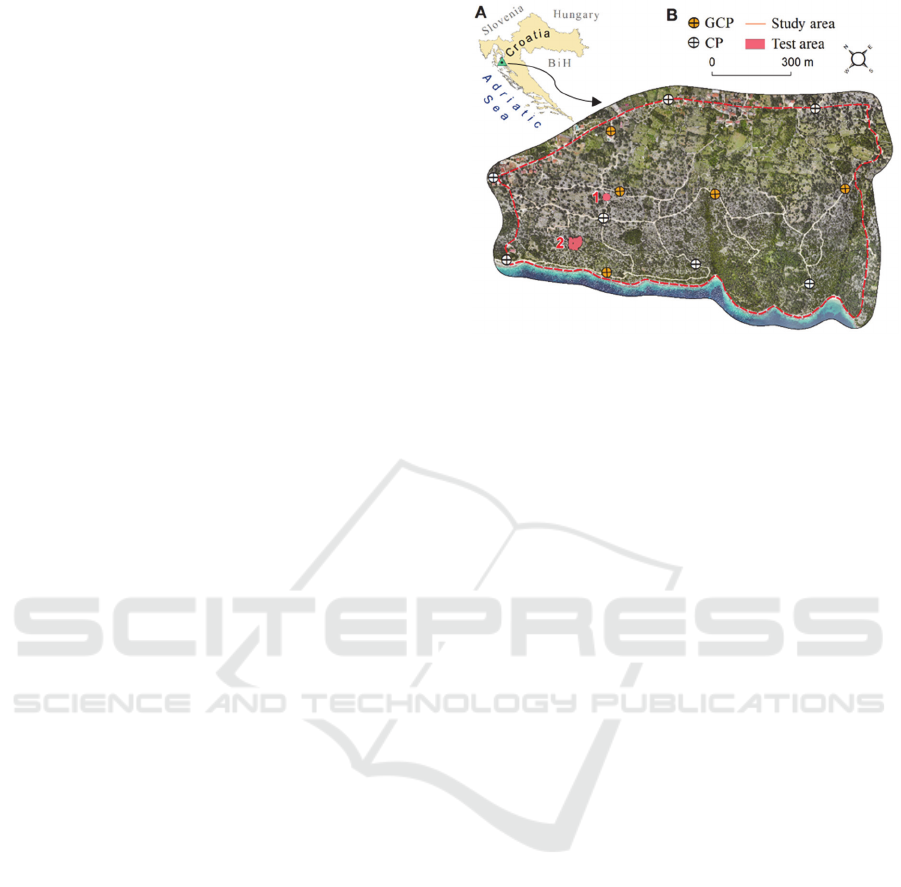
2 STUDY AREA
Quality of Worldview-3 extracted DSM was assessed
within Olive Gardens of Lun (OGL), located on Lun
peninsula at most northern part of Pag Island, Croatia
(Fig. 1A).
Figure 1: Location of study site within Croatia (A), location
of GCPs, CPs and test sites (TA1 and TA2) within the study
area (B).
OGL represents a protected olive grove that
contains some of the oldest millennial olive trees in
the World. As such it is protected as Sites of
Community Importance (SCI), under the Natura 2000
network of European nature protection areas
(European Environment Agency, 2019). Primary
quality assessment (Test site 1 (TA1)) covered one
individual olive tree, that represents oldest and largest
single tree within the study area. Secondary quality
assessment was performed within larger test site (Test
site 2 (TA2)), covered by dense, unattended olive
trees. Through primary assessment we wanted to
evaluate DSM vertical accuracy for representation of
individual trees, where we expected model quality to
be less good. In secondary assessment we wanted to
evaluate vertical accuracy of created DSM over
thicker vegetation cover with larger tree crown
surface, where we expected higher overall vertical
accuracy. Location of test sites within the study area
can be seen on Fig. 1B.
Acquisition of both WV-3 imagery and UAV
aerial imagery was conducted before the seasonal
pruning of the olive trees (Gucci, R. & Cantini, C.,
2000), so that possible human-induced changes in
height of olive trees are eliminated.
3 MATERIALS AND METHODS
3.1 Data Acquisition and Specifications
Acquisition of Worldview-3 Imagery
Worldview stereo imagery covering our study area
was collected by WV-3 satellite on December 4
th
,
Assessing the Vertical Accuracy of Worldview-3 Stereo-extracted Digital Surface Model over Olive Groves
247

2018, within the time span of 8 minutes. Stereo
images were collected at ideal conditions, with 0%
cloud cover and with optimal off-NADIR angles (<
30º) (Nemmaoui et al., 2019), thus achieving claimed
5 m CE90
1
/LE90
2
absolute horizontal accuracy
specification with 2.3 m Root Mean Square Error
(RMSE) (Maxar Technologies, 2019B).
WV-3 stereo images of study area were provided
to the Authors as OrthoReady Stereo imagery
(OR2A), through the funding of DigitalGlobe
Foundation. OR2A is radiometrically and sensor
corrected imagery, that has no terrain corrections
applied and is suitable for further analysis,
orthorectification and elevation extraction (Maxar
Technologies, 2019B). OR2A contains metadata
(.STE file) required for orientation of stereo pairs in
various photogrammetric software packages and
creation of DSMs (Maxar Technologies, 2019B).
Detailed specifications of acquired WV-3 stereo
imagery are given in table 1.
Table 1: Specifications of acquired WV-3 stereo imagery.
Image ID WV-3A WV-3B
Image type Stereo OR2A Stereo OR2A
Acquisition date 04.12.2018. 04.12.2018.
Acquisition time 14:20:46 14:28:40
Off-NADIR (º) 12.1 27.1
Cloud cover (%) 0 0
GSD (m) 0.30 0.30
Scan direction Forward Backward
Sun azimuth (º) 157.1 157.6
Sun elevation (º) 62 62.1
Product pixel
size (PAN)
0.3 m 0.3 m
Product pixel
size (MS)
1.2 m 1.2 m
Aerial Survey with UAV Photogrammetry
UAV photogrammetric survey was carried out over
study area on March 10
th
, 2019, with our newly-
developed repeat aerophotogrammetric system
(RAPS). RAPS represents advanced
aerophotogrammetric system, composed of
professional-grade DJI Matrice 600 PRO drone,
Gremsy T3 gimbal, Sony Alpha A7RII (42 MP)
DSLR camera equipped with 20 mm lens and Reach
M+ GNSS module for UAV mapping. Due to the
advanced flight capabilities and camera
characteristics RAPS allows acquisition of aerial
1
CE90 - circular error at the 90th percentile, where
minimum of 90 percent of the points measured has a
horizontal error less than the stated CE90 value.
images with very-high resolution and positioning
precision.
Parameters of carried aerial surveys (double-grid
flight profiles, GSD (cm), flight speed (m/s), side and
forward overlap (%), etc.) were planned and
automated in Universal Ground Control Software
(UgCS) according to the suggestions given in Pepe et
al., 2018. Flight height was set to 165 m above
ground, side and forward overlap were set to 80% and
GSD was 2.6 cm. Overall accuracy of DSM
created from collected aerial images was improved
with 6 fixed ground control points (GCPs) and 3
check points (CPs) distributed uniformly within the
study area. GCPs and CPs were marked before the
aerial survey with red paint and their precise
coordinates were collected with Stonex S10 Real
Time Kinematic (RTK) GPS. Survey was carried in
static mode.
3.2 Data Processing and DSM
Production
Creation of DSM from WV-3 Stereo Imagery
DSM of study area was created from WV-3 stereo
imagery in OrthoEngine 2018 suite of Geomatica
2018 software. Workflow for DSM creation within
OrthoEngine can be divided into following substeps:
math model selection (1), introduction of ground
control points (GCPs), check points (CPs) and tie
points (TPs) required for image orientation (2),
bundle adjustment (3), epipolar image creation (4)
and automatic DSM extraction (5).
First step of DSM
extraction includes the
selection of corresponding math model (1) that serves
as mathematical relationship used for correlation of
two-dimensional (2D) image pixels with correct
three-dimensional (3D) locations on the ground (X,
Y, Z) (Barazzetti et al., 2016). Optical Satellite
modeling based on provided rational polynomial
coefficients (RPC) and zero-order polynomial
adjustment was selected as one of the most commonly
used math models for DSM extraction from WV
stereo imagery (Aguilar et al., 2013; Aguilar et al.,
2019; Goldbergs et al., 2019). In order to produce
highly accurate DSM, introduction of GCPs (2) is
required for systematic compensation of RPC
induced errors and improve overall image geo-
referencing accuracy (Aguilar et al., 2013; Goldbergs
et al., 2019). Therefore, seven GCPs and five CPs
2
LE90 - 90th percentile linear error, where minimum of 90
percent of vertical errors fall within the stated LE90
value.
GISTAM 2020 - 6th International Conference on Geographical Information Systems Theory, Applications and Management
248

scattered throughout the study area and surveyed with
the Stonex S10 RTK-GPS were introduced, along
with 187 TPs automatically detected from WV-3
stereo-pair. Reported RMSE for used GCPs, CPs and
TPs is given in table 2.
Table 2: RMSE for GCPs, CPs and TPs used for creation of
WV-3 stereo-derived DSM of study area.
Point
type
𝑁
RMS
E X
(m)
RMS
E Y
(m)
RMS
E Z
(m)
MEAN
RMSE (m)
GCP
7 0.369 0.197 0.504 0.356
CP
5 0.320 0.517 0.737 0.525
TP
18
7
0.071 0.017 0.001 0.029
Introduced GCPs and TPs are then used for bundle
adjustment (3) which in combination with RPC-
derived sensor geometry calculates the exact position
of satellite at the time of image collection. Next step
covers creation of epipolar image (4), that represents
stereo-pair image, where left and right images are
reprojected to have common orientation and
matching features distributed along the common x-
axis (PCI Geomatics Enterprises, 2018).
Final step in creation of DSM
was automated
DSM extraction (5). Recent research conducted by
Goldbergs et al. (2019) demonstrated that frequently
used semi-global matching (SGM) is not suitable for
creation of DSMs over forested areas, since it
significantly underestimates tree presence and height.
Therefore, in order to produce best possible quality
DSM of our research area, we have tested both SGM
and normalized cross-correlation (NCC) technique
(both implemented within Geomatica Orthoengine
2018) for automated DSM extraction. Pixel sampling
interval was set to 1 for both NCC and SGM derived
DSMs, meaning that image correlation was
performed at full image resolution, thus enabling
extraction of fine details (e.g. bushes, trees, buildings,
etc.) in created DSMs (PCI Geomatics Enterprises,
2018).
Final created DSM
was used for
orthorectification of pansharpened 8-ban
multispectral WV-3 image of the study area with 0.3
m spatial resolution that was later used for extraction
of vegetation cover, through OBIA approach.
Creation of DSM from UAV Photogrammetry
Aerial imagery acquired by RAPS was used for
creation of VHR reference DSM of the study area in
Agisoft Metashape 1.5.1. software. This software is
currently one of the most advanced and precise
image-based 3D modelling software that uses
structure-from-motion (SfM) algorithm and multi-
view 3D reconstruction technology for creation of
high-quality models (Mancini et al., 2013). Workflow
for extraction of VHR DSM from aerial images
collected by RAPS followed the recommendations
given in James et al., 2019. Based on processing of
collected aerial imagery VHR reference DSM
with 10 cm spatial resolution and digital ortophoto
image (DOF) with 3 cm spatial resolution were
created.
3.3 Object-based Extraction of Olive
Groves
Extraction and mapping of olive groves within OGL
was performed by object-based image analysis
(OBIA) in eCognition Developer 9 software. OBIA
extraction of olive trees was based on spectral
(multispectral WV-3 image, DOF) and height
information (digital olive tree models (DOMs)).
DOMs were generated as difference between created
DSM and corresponding digital elevation model
(DEM). DEMs were created from DSM
and
DSM
with DSM2DTM algorithm in Geomatica
2018 software.
In the first step of OBIA all olive trees within
study area were extracted from the multispectral 8-
band WV-3 image and created DSM
through the
use of multiresolution segmentation algorithm (MRS)
(scale = 25, compactness = 0.9, shape = 0.5) and
threshold-based classification (meanNDVI ≥ 0.18,
meanDOMheight ≥ 0.5 m).
In second step olive trees were extracted from
DOF through the same OBIA approach. While
approach and MRS parameters (scale = 25,
compactness = 0.9, shape = 0.5) were identical,
threshold-classification had to be adjusted to different
spatial and spectral resolution of UAV
photogrammetry derived DSM and DOF. Since DOF
is composed of only visual RGB bands, threshold
classification had to be based on Visible
Atmospherically Resistant Index (VARI)
(meanVARI ≥ 0, meanDOMheight ≥ 0.5 m) instead
of NDVI.
Two datasets of extracted olive trees were then
intersected in order to derive overlapping area.
Overlapping area represents the area which is covered
by olive trees on both reference and WV-3 derived
DSMs (Fig. 2.). As such it was taken as test area for
validation of DSM
vertical accuracy.
Assessing the Vertical Accuracy of Worldview-3 Stereo-extracted Digital Surface Model over Olive Groves
249
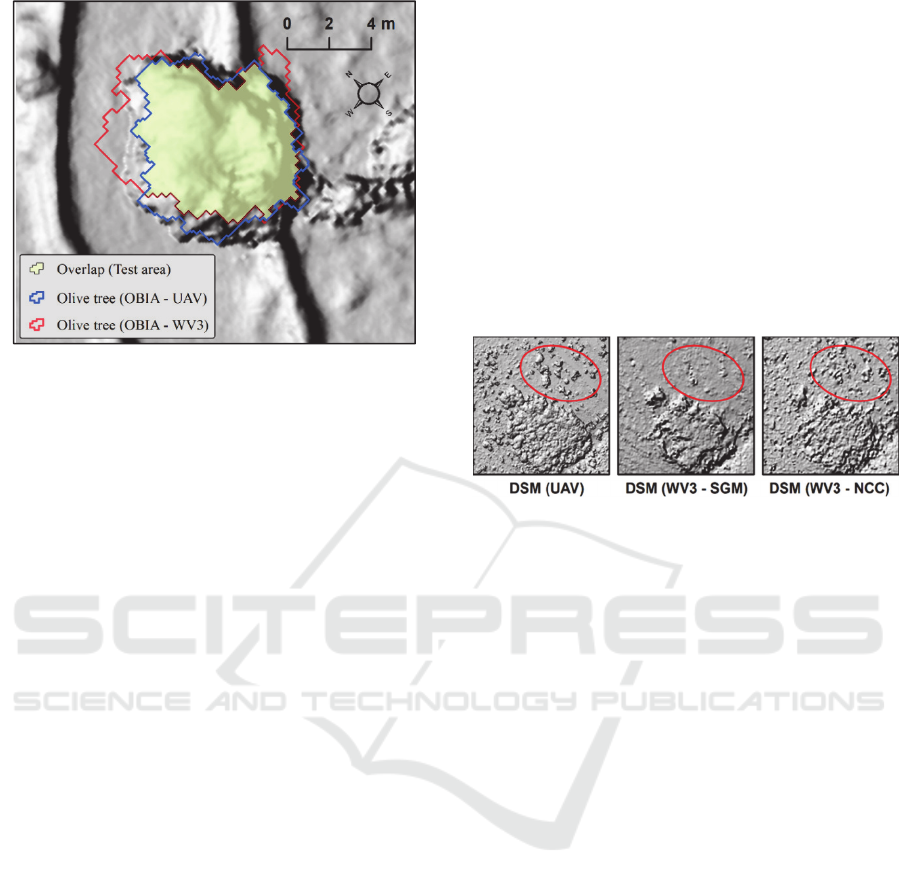
Figure 2: Test area (TA1) derived as overlap between area
representing single olive tree on WV-3 and reference data.
3.4 Model Vertical Accuracy
Assessment
Overall vertical accuracy of produced WV-3 DSM
was assessed over olive groves with VERTICAL tool,
that allows regular sampling of height values from
two defined DSMs (Domazetović, 2018).
VERTICAL tool samples height values along the
cross-sections (Cs), in intervals that can be adjusted
by the user in regard to the spatial resolution of
evaluated models. For the purpose of this research
both Cs and height sampling interval were set to 1 m.
Sampled height values are then used for automated
calculation of vertical difference (∆ℎ between two
given DSMs, according to the following formula:
∆ℎ ℎ
ℎ
(1)
Positive values of ∆ℎ indicate that DSM
exaggerates the height of certain point, in comparison
to the reference DSM
, while negative values are
indicating underestimated height values. Neutral
values (∆ℎ = 0) indicate that at that point DSM
does not deviates vertically from DSM
. Vertical
difference ( ∆ℎ ) was also used for calculation of
RMSE and Mean absolute error (MAE), as
representative measures of DSM
vertical accuracy
within test sites.
4 RESULTS AND DISCUSSION
4.1 Created WV-3 DSMs of Study Area
As spatial resolution of initial PAN WV-3 stereo
imagery was 0.3 m and pixel sampling interval for
NCC and SGM was set to 1, spatial resolution of final
created DSM
was 0.6 m.
Although NCC and SGM approaches were
based on identical input WV-3 stereo imagery and
GCPs, resulting DSMs were very dissimilar.
Significant differences between DSMs of study area
created by NCC and SGM approaches are obvious
even from basic visual comparison of created models
(Fig. 3.). DSM created by SGM approach was much
smoother and it lacks most of single, individual trees,
thus confirming what was stated by Goldbergs et al.
(2019.). On the other hand, NCC also failed to
represent all individual olive trees, but representation
was much better than with SGM approach.
Figure 3: Visual comparison of DSMs created by NCC
(right) and SGM (middle) approaches with DSM created
from UAV photogrammetry (left); red ellipse – area
covered by individual, dispersed olive trees.
While SGM was very straightforward and easy-
to-use, NCC allowed higher autonomy for adjustment
of user-defined parameters for DSM extraction to the
local characteristics of our study area. Namely, high
individual olive trees rise several meters above the
surrounding terrain, significantly rising overall
surface roughness. SGM technique neglected the high
surface roughness and created rather smooth DSM,
with very poor representation of individual olive
trees. To solve this problem, we set the smoothing
filter and terrain type parameters of NCC technique
to fill holes only and mountainous, respectively. Fill
holes only parameter interpolates all holes in created
DSM, but does not apply any additional filtering and
smoothing, which is important for preservation and
representation of individual olive trees in the created
model. Although terrain within our study area is
represented by gentle hills, we decided to set terrain
type parameter to mountainous, in order to preserve
individual trees, that would be filtered with other two
terrain type parameters (flat, hilly). As a result, DSM
produced by NCC had much better representation of
individual olive trees than DSM produced by SGM,
and thus this DSM was chosen as final DSM
.
GISTAM 2020 - 6th International Conference on Geographical Information Systems Theory, Applications and Management
250
4.2 Vertical Accuracy of WV-3 DSM
DS𝐌
𝐖𝐕𝟑
Vertical Accuracy within TA1
Within TA1 VERTICAL tool determined the vertical
difference between DSM
and reference DSM
in 140 height points, distributed within 8 cross-
sections. It can be noted that DSM
underestimates
the height of individual olive tree crown, with
negative vertical difference present in 92.857% of all
sampled points. Presence of significant height
underestimation is uniform within whole TA1 area.
This demonstrated that although produced DSM
managed to reproduce individual olive trees, vertical
accuracy of such representation is relatively low, as it
is further confirmed with RMSE and MAE values for
whole TA1 (Table 3.).
DS𝐌
𝐖𝐕𝟑
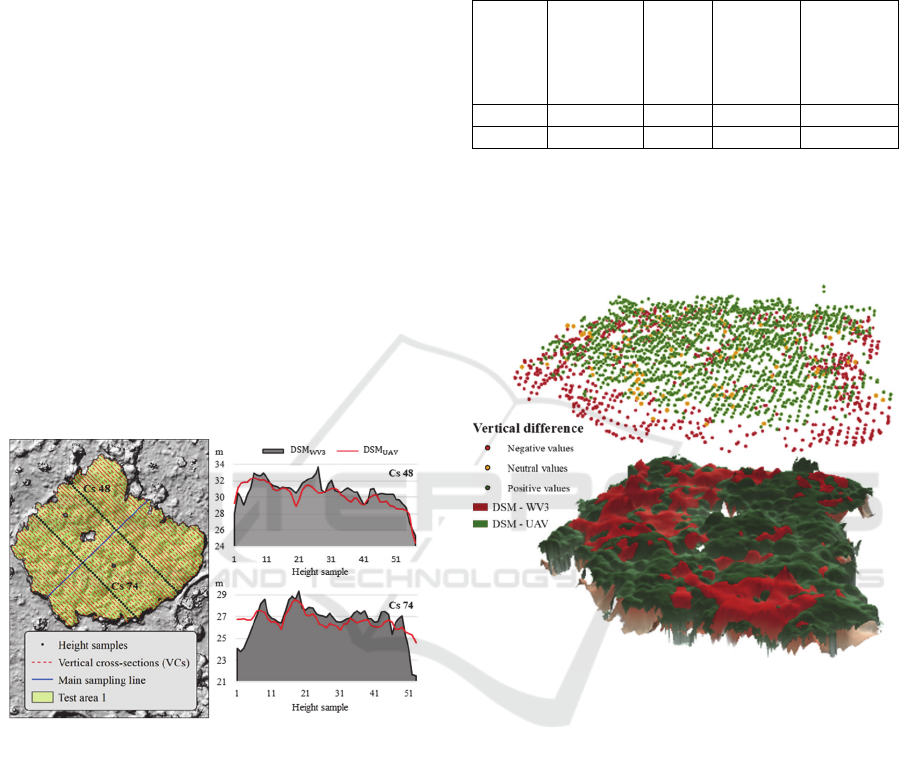
Vertical Accuracy within TA2
Within TA2 VERTICAL tool sampled 5202 height
points in total, distributed within 61 cross-sections.
Spatial distribution of sampled vertical transects and
two exemplary vertical profiles can be seen in Fig. 4.
Figure 4: Spatial distribution of 61 vertical transects
sampled within dense olive trees of TA2 (left); profiles of
two selected vertical transects (Cs 48 & Cs 74)
demonstrating visual comparison between DSM
and
reference DSM
(right).
Unlike TA1 vertical difference between
DSM
and reference DSM
is less pronounced
within TA2. Dense, unattended crowns of olive trees
within TA2 are forming relatively homogenous
surface, which is much better represented within
created DSM
, than crowns of individual olive
trees. Underestimation (31.311% of all sampled
points) and overestimation (65.569% of all sampled
points) of heights are both present in points sampled
within TA2 (Fig. 5.). However, calculated RMSE and
MAE values are demonstrating that overall vertical
accuracy within this test site is much higher than
within TA1 (Table 3.).
Table 3: RMSE and MAE as measures of DSM
vertical
accuracy within two test areas.
Test
Area
𝑁
of
height
samples
Total
area
(m²)
Root
Mean
Square
Error
(m)
Mean
absolute
error (m)
TA1 140 45 3.604 3.203
TA2 5202 2500 1.462 1.127
Better vertical accuracy within TA2 can be
attributed to the characteristic of olive trees within
this area, thus confirming our expectation that DSM
vertical accuracy will be better for olive trees with
larger and denser concentration of crowns.
Figure 5: Vertical difference between DSM
and
DSM
measured in 5202 height points sampled within
TA2 with VERTICAL tool.
5 CONCLUSION
Main aim of our study was to evaluate the vertical
accuracy and potential of WV-3 derived DSMs for
application over olive groves.
Comparison of NCC and SGM approaches has
demonstrated how image matching technique and
user-defined parameters influence the representation
of individual olive tree in produced DSMs. In overall,
NCC approach with user-defined parameters adjusted
to local characteristics of study area provided DSM
with significantly higher representation of individual
olive trees.
Assessing the Vertical Accuracy of Worldview-3 Stereo-extracted Digital Surface Model over Olive Groves
251

Although WV-3 stereo-extracted DSMs represent
state-of-the-art products for satellite-based digital
surface modelling, through our research we have
concluded that vertical accuracy and representation of
individual olive trees still significantly deviates from
our reference VHR model created with UAV
photogrammetry. However, if we consider that our
both test sites covered very small areas and that
calculated RMSE and MAE values are relatively low
(in respect to spatial resolution of DSM
and initial
WV-3 stereo imagery), we can conclude that vertical
accuracy of produced DSM
is more than
satisfactory.
As demonstrated by RMSE and MAE values
vertical accuracy was especially good over larger test
area (TA2), covered by dense, unattended olive trees.
This demonstrated that WV-3 stereo imagery has
great potential for application in creation of DSMs
over large scale forested areas, that would be (due to
high costs and terrain inaccessibility) hard to cover
with field geospatial techniques (e.g. LiDAR or UAV
photogrammetry).
ACKNOWLEDGEMENTS
This research was performed within the project UIP-
2017-05-2694 financially supported by the Croatian
Science Foundation.
Authors would like to thank DigitalGlobe
Foundation (Maxar Technologies), Hexagon
Geospatial and SPH Engineering for provided
necessary VHR Worldview satellite imagery and
software (UgCS, Erdas Imagine 2018.).
REFERENCES
Aguilar, M. A., Bianconi, F., Aguilar, F. J., & Fernández, I.
(2014). Object-based greenhouse classification from
GeoEye-1 and WorldView-2 stereo imagery. Remote
sensing, 6(5), 3554-3582.
Aguilar, M. Á., del Mar Saldaña, M., & Aguilar, F. J.
(2013). Generation and quality assessment of stereo-
extracted DSM from GeoEye-1 and WorldView-2
imagery. IEEE Transactions on Geoscience and
Remote Sensing, 52(2), 1259-1271.
Aguilar, M. A., Nemmaoui, A., Aguilar, F. J., & Qin, R.
(2019). Quality assessment of digital surface models
extracted from WorldView-2 and WorldView-3 stereo
pairs over different land covers. GIScience & remote
sensing, 56(1), 109-129.
Barazzetti, L., Roncoroni, F., Brumana, R., & Previtali, M.
(2016). Georeferencing accuracy analysis of a single
worldview-3 image collected over Milan. The
International Archives of the Photogrammetry, Remote
Sensing and Spatial Information Sciences, Volume XLI-
B1.
Domazetović, F. (2018). Quantitative analysis of gullies of
Pag island through the use of high-resolution models
(Master thesis, University of Zadar. Department of
Geography.).
European Environment Agency (2019.). Natura 2000 End
2018 – Shapefile. Retrived from https://www.eea.
europa.eu/data-and-maps/data/natura-10/natura-2000-
spatial-data/natura-2000-shapefile-1 (accessed 12
December 2019).
Goldbergs, G., Maier, S. W., Levick, S. R., & Edwards, A.
(2019). Limitations of high resolution satellite stereo
imagery for estimating canopy height in Australian
tropical savannas. International Journal of Applied
Earth Observation and Geoinformation, 75, 83-95.
Gucci, R., & Cantini, C. (2000). Pruning and training
systems for modern olive growing. Csiro Publishing.
Jiménez-Brenes, F. M., López-Granados, F., de Castro, A.
I., Torres-Sánchez, J., Serrano, N., & Peña, J. M.
(2017). Quantifying pruning impacts on olive tree
architecture and annual canopy growth by using UAV-
based 3D modelling. Plant Methods, 13(1), 55.
Krause, S., Sanders, T. G., Mund, J. P., & Greve, K. (2019).
UAV-based photogrammetric tree height measurement
for intensive forest monitoring. Remote Sensing, 11(7),
758.
Mancini, F., Dubbini, M., Gattelli, M., Stecchi, F., Fabbri,
S., & Gabbianelli, G. (2013). Using unmanned aerial
vehicles (UAV) for high-resolution reconstruction of
topography: The structure from motion approach on
coastal environments. Remote Sensing, 5(12), 6880-
6898.
Maxar Technologies (2019A.). Worldview-3 datasheet.
Retrieved from https://www.digitalglobe.com/
company/about-us (accessed 03 December 2019).
Maxar Technologies (2019A.).Stereo Imagery datasheet.
Retrieved from https://www.digitalglobe.com/
resources (accessed 03 December 2019).
Mohan, M., Silva, C. A., Klauberg, C., Jat, P., Catts, G.,
Cardil, A., ... & Dia, M. (2017). Individual tree
detection from unmanned aerial vehicle (UAV) derived
canopy height model in an open canopy mixed conifer
forest. Forests, 8(9), 340.
Nemmaoui, A., Aguilar, F. J., Aguilar, M. A., & Qin, R.
(2019). DSM and DTM generation from VHR satellite
stereo imagery over plastic covered greenhouse areas.
Computers and Electronics in Agriculture, 164,
104903.
Orlandi, F., Aguilera, F., Galan, C., Msallem, M., &
Fornaciari, M. (2017). Olive yields forecasts and oil
price trends in Mediterranean areas: a comprehensive
analysis of the last two decades. Experimental
Agriculture, 53(1), 71-83.
PCI Geomatics Enterprises (2018.). Geomatica
OrthoEngine Course Exercises. Retrieved from
https://www.pcigeomatics.com/pdf/TrainingGuide-
Geomatica-OrthoEngine.pdf (accessed 06 Jenuary
2020).
GISTAM 2020 - 6th International Conference on Geographical Information Systems Theory, Applications and Management
252

Pepe, M., Fregonese, L., & Scaioni, M. (2018). Planning
airborne photogrammetry and remote-sensing missions
with modern platforms and sensors. European Journal
of Remote Sensing, 51(1), 412-436.
Qin, R. (2014). Change detection on LOD 2 building
models with very high resolution spaceborne stereo
imagery. ISPRS journal of photogrammetry and remote
sensing, 96, 179-192.
Rizeei, H. M., & Pradhan, B. (2019). Urban mapping
accuracy enhancement in high-rise built-up areas
deployed by 3D-orthorectification correction from
WorldView-3 and LiDAR Imageries. Remote Sensing,
11(6), 692.
Shean, D. E., Alexandrov, O., Moratto, Z. M., Smith, B. E.,
Joughin, I. R., Porter, C., & Morin, P. (2016). An
automated, open-source pipeline for mass production of
digital elevation models (DEMs) from very-high-
resolution commercial stereo satellite imagery. ISPRS
Journal of Photogrammetry and Remote Sensing, 116,
101-117.
Tomaštík, J., Mokroš, M., Saloň, Š., Chudý, F., & Tunák,
D. (2017). Accuracy of photogrammetric UAV-based
point clouds under conditions of partially-open forest
canopy. Forests, 8(5), 151.
Wang, S., Ren, Z., Wu, C., Lei, Q., Gong, W., Ou, Q., ... &
Li, C. (2019). DEM generation from Worldview-2
stereo imagery and vertical accuracy assessment for its
application in active tectonics. Geomorphology, 336,
107-118.
Assessing the Vertical Accuracy of Worldview-3 Stereo-extracted Digital Surface Model over Olive Groves
253
