
Multiscale GIS based Analysis of Urban Green Spaces (UGS)
Accessibility: Case Study of Sisak (Croatia)
Silvija Šiljeg
a
, Rina Milošević
b
and Edita Vilić
University of Zadar, Department of Geography, Trg kneza Višeslava 9, 23000 Zadar, Croatia
Keywords: Urban Green Spaces (UGS), ANGst, Accessibility, Sisak.
Abstract: By the year 2050, two-thirds of the world population will live in urban areas. Therefore the quality of life in
cities has become the object of numerous research papers. One of the basic elements of satisfying the
quality of life is the accessibility of urban green spaces (UGS). In this paper accessibility of UGS for the
city of Sisak (Croatia) has been analysed. Based on the fact that Sisak is traditionally an industrial type of
town, the optimal distribution of UGS has the potential to ease the negative effects of urbanization and
industrialization. Accessibility analysis was performed according to guidelines of ANGst (Accessible
Natural Greenspace Standard) methodology. The research is conducted at a multiscale level (based on GIS
analysis). The primary spatial database of UGS for the city of Sisak was created using the supervised
classification method of Sentinel-2A images and vectorization of high-resolution digital orthophoto (DOP).
Accessibility zones were generated using the Network Analyst extension. Results show that the basic
ANGst standard of UGS accessibility is not satisfactory throughout the city. To get more detailed results we
suggest using the very high-resolution satellite imagery or aerial photogrammetry.
a
https://orcid.org/0000-0002-5473-2579
b
https://orcid.org/0000-0002-2302-7738
1 INTRODUCTION
Urbanization can be considered as a rapid converter
of natural environments to impervious surfaces
(Frick and Tervooren, 2019). City population
constantly grows and according to the United
Nations’ population projections, by the year 2050,
approximately two-thirds of the world population
will live in urban areas (UN, 2018).
As a consequence of urbanization, the quality of
life in cities has become the object of research to
numerous authors (Franklin, 2001, Amao, 2012,
Balestra et al., 2013, Pacione, 1986).
Accessibility of urban green spaces (UGS) is an
integral element of satisfying the quality of life
(Šiljeg et al., 2018). Accessibility can be defined as
“relative ease” of approach to a specific location, in
this case, UGS (Mak et al., 2017). It usually
represents the non-linear distance traveled without
using the means of transportation. According to the
European Urban Green Belt project, urban green
space is any public or private open property covered
with vegetation, directly or indirectly accessible to
users (Šiljeg et al., 2018).
Access to green areas provides the potential to
reduce health inequalities, improve well-being, and
aid in the treatment of mental illness (WHO, 2019).
WHO (World Health Organization) quotes that
physical inactivity, linked to the lack of access to
recreational zones accounts for 3,3% of global
deaths. From the environmental aspect, besides
producing oxygen, green spaces are a sufficient filter
for air pollution and have an impact on moderating
temperatures.
At the Rio+20 conference on sustainable
development (2012) is concluded that the square
meter per capita of urban green space is one of the
health indicators of sustainable cities. Studies
conducted in several cities confirmed that green
spaces are more accessible to high-income residents
(Hoffimann et al. 2017). Therefore, the lack of
green spaces in cities can be an indicator of
inequality and marginalization among the
population.
240
Šiljeg, S., Miloševi
´
c, R. and Vili
´
c, E.
Multiscale GIS based Analysis of Urban Green Spaces (UGS) Accessibility: Case Study of Sisak (Croatia).
DOI: 10.5220/0009470802400245
In Proceedings of the 6th International Conference on Geographical Information Systems Theory, Applications and Management (GISTAM 2020), pages 240-245
ISBN: 978-989-758-425-1
Copyright
c
2020 by SCITEPRESS – Science and Technology Publications, Lda. All rights reserved
All of the abovementioned contribute that
studies about UGS are becoming one of the key
elements in urban planning. Green volume data can
be used as an input for modeling (urban climate,
water balance) as well as for evaluation processes
(Frick and Tervooren, 2019).
In this research, the case study is the city of
Sisak. Sisak is a traditionally industrial city and
there are two industrial zones within the boundaries
of the settlement. The optimal spatial distribution of
UGS in the city of Sisak is important to keep the
environmental balance of the urban landscape and to
mitigate negative industrial effects.
The aim of this research is to analyse the
coverage and accessibility of green spaces according
to European standards (ANGst, WHO) at the
multiscale level. The research questions are:
Are the green spaces equally accessible to all
residents?
Are there enough green spaces unto the
population?
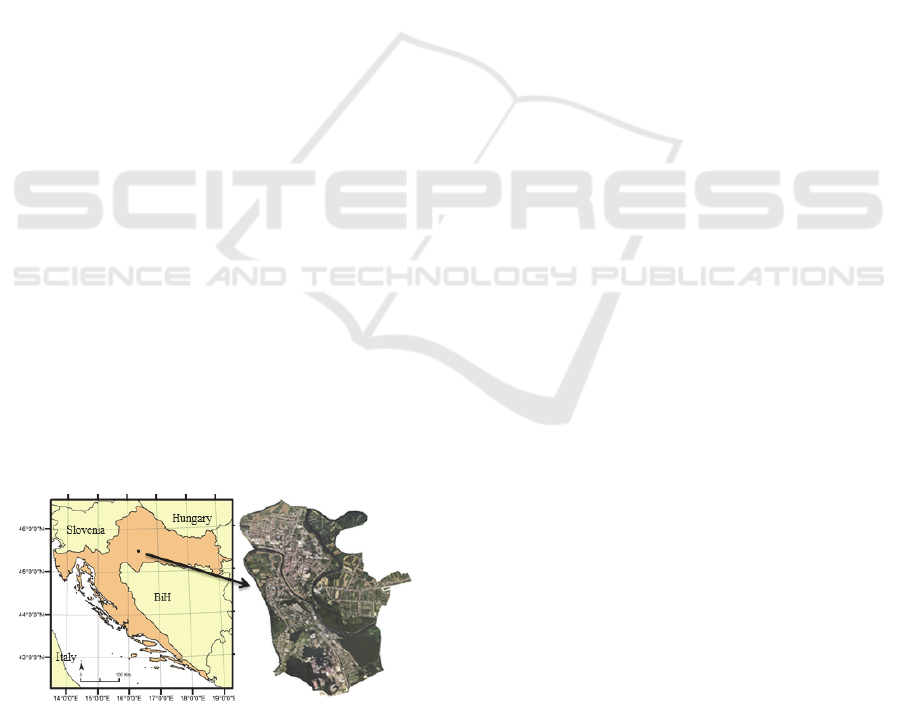
2 STUDY AREA
Sisak (32 km²) is the administrative center of the
Sisak-Moslavina county (Fig. 1.). Development of
Sisak as an industrial center started in the second
part of 20 century and it became one of the most
developed industrial cities in Croatia (Slukan - Altić,
2003). At the latest census (2011), the total
population of Sisak was 33,322 (DZS). The city of
Sisak consists of 28 statistical circles – the smallest
official statistical unit in Croatia. They were created
in 1959 and have been revised for each population
census. They represent a permanent network of
spatial units, which covers the entire mainland area
of Croatia (Šiljeg et al., 2018).
Figure 1: Study area - City of Sisak.
3 MATERIALS AND METHODS
The database of UGS was created based on the
analysis of multispectral satellite images (Earth
Explorer, 2019) and high-resolution (0,5 meters)
digital orthophoto (DOP). Analysis has been
conducted in Erdas Imagine (2018) and ESRI Arc
GIS 10.1.
3.1 Satellite Remote Sensing Data
The land cover model of Sisak is generated in Erdas
Imagine by supervised classification using the
Maximum Likelihood algorithm (pixel-based
approach). Classes of the UGS were initially derived
from Sentinel 2A satellite imageries analyses. They
were modified and corrected using the data acquired
by the manual vectorization method of high-
resolution DOP. The spatial resolution of Sentinel
2A varies from 10m to 60m depending on the
spectral band (Drusch et al., 2012).
Classification is made according to the
methodology of the Urban Green Belt project (URL
urban green belts (UB) project wpt 1 activity) and
following the ANGst standards.
3.2 ANGst Methodology and
Accessibility
Accessibility was analysed following the ANGst
methodology (English Nature, 2003), which
recommends that everyone should have access to the
natural greenspace. The main criteria followed in
this paper were:
Minimum 2 hectares in size, no more than 300
meters (5 minutes walk) from home
Accessibility model was generated based on
UGS, which are publicly accessible (with or without
entry fee) and bigger than 2 hectares. That eight
classes of UGS encompass; urban forest, public
green spaces (parks, promenades, lawns, city
gardens, greenery by the buildings and institutions,
playgrounds), green spaces by the river, abandoned
areas, sport green surfaces, green spaces by the train
rails and cemetery.
UGS accessibility zones were determinate using
the Network Analyst extension, specifically the New
Service area tool in which the following parameters
were used;
a) Default breaks 5 minutes
b) Restriction – disabled
c) Polygon type – Detailed, trim polygons 50
meters
Multiscale GIS based Analysis of Urban Green Spaces (UGS) Accessibility: Case Study of Sisak (Croatia)
241
d) Multiple facilities options – overlapping
e) Overlap type – discs
3.3 Data Quality Assessment
Topology correction was performed on the traffic
data following the rules: must not overlap, must not
intersect, must not self-overlap, must not self-
intersect, must be a single part. As a cost attributes
walking time (minutes) was calculated. Assumed
walking speed is 5 km/hour. After the topology
correction Network dataset has been created.
The classification was based on satellite imagery
with a spatial resolution of 10 meters. Accuracy of
the classification is evaluated based on the field
validation. On the public green spaces bigger than 2
hectares, 30 control points were selected.
3.4 Indicators of Green Space
Accessibility
Indicators of green space accessibility, in general,
takes into account the distribution of the population
(statistical circle, settlement) in terms of their
proximity to green space (WHO, 2019). The most
widely used indicator to assess green spaces is their
total area with respect to the total population
(m²/inhabitant) (Taylor et al., 2011; Van Herzele and
Wiedemann, 2003; Caspersen et al., 2006; Kabisch
and Haase, 2013; ISO, 2014). But this indicator is
too general and does not give us information about
the actual distribution of UGS and population
throughout the city. That is why this research is
conducted at three levels; macro, meso and micro:
• At the macro level of the research, UGS
accessibility is expressed as a percentage of the total
settlement area, which has accessible UGS.
• At the meso level of the research, UGS
accessibility is expressed as a percentage of the total
statistical circle area that has accessible UGS.
• At the micro-level of the research, UGS
accessibility is expressed as a percentage of the total
housing units within the UGS service area.
In this paper, the presented results are only for
representative statistical circles, those with the
highest percentage and with the lowest percentage.
Total housing units data are the result of fusing the
data downloaded from Geofabrik and data from the
State Geodetic Administration. Missing units were
manually vectorized using the high-resolution DOP.
The results of these indicators are relevant for
comparison with other European cities (Zadar,
Leicester, Scheffiled).
4 RESULTS AND DISCUSSION
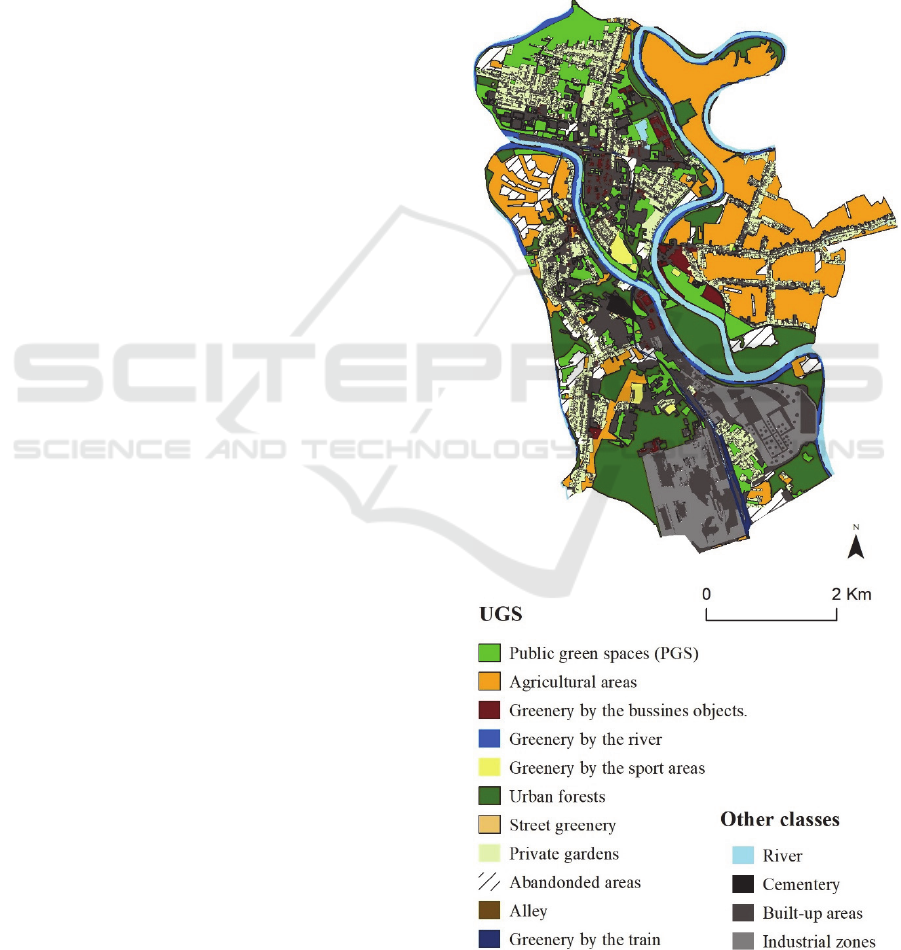
4.1 UGS Database of Sisak City
In the city of Sisak 11 distinctive classes (public and
private) of UGS were identified (Fig. 2). Excluding
the private green spaces, UGS encompasses slightly
less than 31%. Forest is the most widespread class of
UGS (bigger than 2h) with 12% in the urban area.
The second is public green spaces with 9%.
Figure 2: UGS classes (private and public) and other
classes in the city of Sisak.
GISTAM 2020 - 6th International Conference on Geographical Information Systems Theory, Applications and Management
242
4.2 Macro Level
Within 5 minutes UGS is accessible to nearly 30%
of the city area. On average there is 297m² of UGS
per capita. The optimum value suggested by the
WHO is 10 to 15 m² of UGS per capita, while the
minimum is 9 m² (Karayannis, 2014, Šiljeg et al.,
2018). Sisak with 297 UGS per m² is far beyond the
optimal distribution.
On the other hand, ANGst states that the entire
population of the city should have access to UGS.
Considering that, Sisak does not meet the standard
(Fig. 3). If we compare UGS per capita in other
towns (Zadar, Leicester), Sisak has much better
results. Each resident in the settlement of Zadar has
around 114 m² per capita of green space (Šiljeg et
al., 2018). Leicester has 30 m² per capita of UGS
(Comber et al 2008).
Figure 3: UGS accessibility map.
4.3 Meso Level
The results at meso level highlight the diversity
among statistical circles. This was expected and
corresponds with the results of other authors.
Circles located near the city centrum have
mostly more percentage of UGS accessible within
five minutes than those closer to the outskirts of
town. In the city centrum, there are a lot of green
areas intended for recreation and rest. On the
outskirt of the town, green areas are predominantly
transferred into private gardens and agricultural land
which are excluded from the analysis. Three out of
28 statistical circles do not have access to UGS.
(Fig. 4). Following the WHO suggestion (10 to 15
m² per capita), all statistical circle meets the
standard.
Figure 4: Percentage of statistical circle areas with
accessible UGS (bigger than 2 ha) within 5 minutes.
4.4 Micro Level
The result at the micro-level has shown the unequal
distribution of access to UGS. UGS is accessible
within 5 minutes to 79,9% of the housing area.
There are three statistical circles with 100%
accessibility to UGS. These circles are closer to the
city center. The six from 28 circles (20%) don’t have
access to UGS but there is not a lot of residential
buildings in these circles. For comparison, in the
Leicester city, UGS was accessible to 10,3% (Kuta
et al., 2014) of the population, in the Sheffield
36,5% (Barbosa et al., 2007) and in Zadar 38,9%
(Šiljeg et al., 2018). Therefore, Sisak with 79,9% of
housing units with accessible UGS is above
average.
Multiscale GIS based Analysis of Urban Green Spaces (UGS) Accessibility: Case Study of Sisak (Croatia)
243
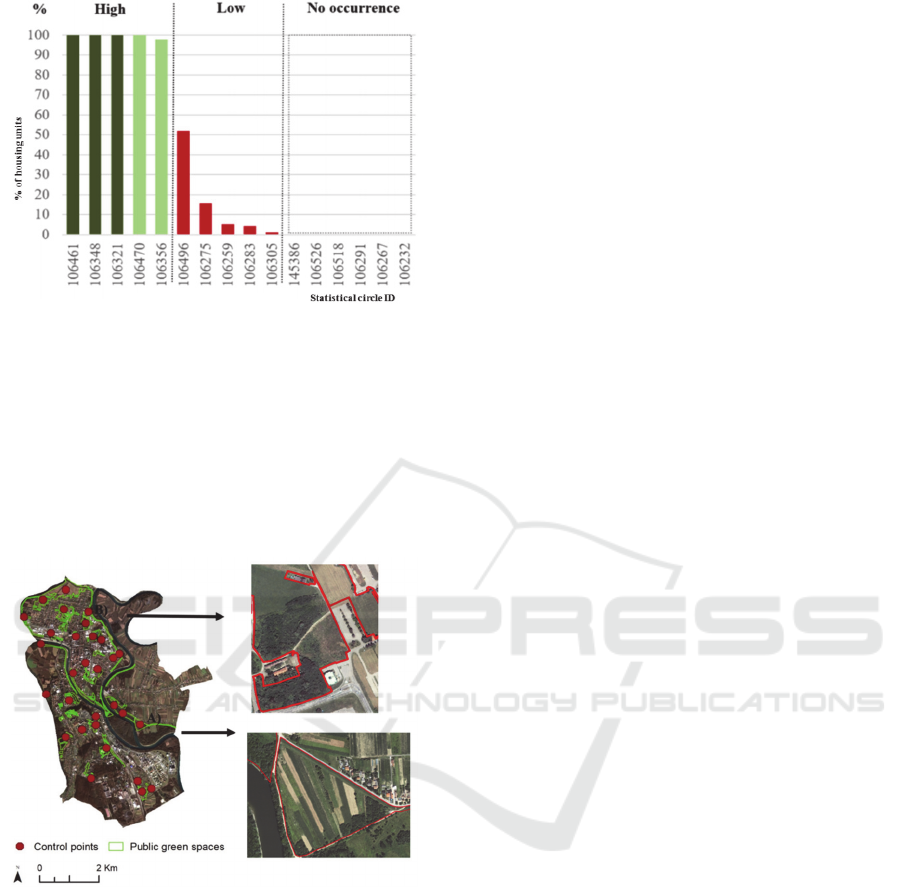
Figure 5: Percentage of housing units with accessible UGS
(bigger than 2 ha) within 5 minutes.
4.5 Data Accuracy
Data quality assessment was performed by field
validation on 30 control points. Data accuracy is
96,66%. Maximal accuracy was expected because
the object of research was areas bigger than 2
hectares.
Figure 6: Field validation of data.
5 CONCLUSION
Multiscale GIS analysis of UGS accessibility
reflected differences among results depending on the
level of research. At the macro-level (297 m² per
capita) Sisak meets the WHO standards of UGS
accessibility. On the other hand, only 30% of the
urban area meets the ANGst standard. So answers to
research questions are; there are enough m² UGS per
capita, but they are not equally accessible to all
residents. In comparison with other cities (Zadar,
Sheffield, Leicester) in which the same methodology
has been applied, Sisak has average results.
At the meso level, there are differences among
statistical areas, depending on their location in the
city. Few statistical circles are completely (100%)
within the UGS access area. However, these
statistical units are not only encompassing the
housing area but are also referring to unpopulated
areas.
Therefore, analysis of the micro-level of research
is performed. It takes into account the spatial
distribution of the housing units within statistical
circles. At the Micro level, 79,9% of the population
have five-minute access to UGS bigger than 2
hectares. The result is above average in comparison
with other towns. Possibly, there are plenty of UGS
in the city center because of industrial zones, to
make a balance in the ecology system. Still,
considering UGS benefits, every resident should
have standardized access to green spaces. As long as
some important measures don’t get applied to certain
city areas, residents may feel marginalized or
discriminated. In Sisak, a big part of UGS is
abandoned and is not reaching its full potential.
Taking care of these areas may bring equality to
certain areas in the city. Using high-resolution
multispectral images is suggested to generate a
better quality model of UGS.
ACKNOWLEDGEMENTS
This work has been supported in part by Croatian
Science Foundation under the project UIP-2017-05-
2694 and National Park „Krka“.
REFERENCES
Amao, L. F. (2012). Housing Quality in Informal
Settlements and Urban Upgrading in Ibadan, Nigeria,
Developing Country Studies 2 (10), 68-80.
Balestra, C., Sultan, J. (2013). Home Sweet Home: The
Determinants of Residential Satisfaction and its
Relation with Well-being, OECD Statistics Working
Papers, 5, 1-42.
Barbosa O., Tratalos J. A., Armsworth P. R., Davies R. G.,
Fuller R. A., Johnson, P., K. J. Gaston (2007). Who
benefits from access to green space? A case study
from Sheffield, UK, Landscape and Urban Planning
83 (2):187-195.
Caspersen, O.H., Konijnendijk, C.C., Olafsson, A.S.
(2006). Green space planning and land use: an
assessment of urban regional and green structure
GISTAM 2020 - 6th International Conference on Geographical Information Systems Theory, Applications and Management
244

planning in Greater Copenhagen. Geogr. Tidsskr.-
Dan. J. Geogr. 106 (2), 7–20.
Comber, A., Brunsdon, C., E. Green (2008). Using a GIS-
based network analysis to determine urban greenspace
accessibility for different ethnic and religious groups,
Landscape and Urban Planning 86 (1):103-114.
De la Barrera, F., Reyes-Paecke, S., and Banzhaf, E.
(2016). Indicators for green spaces in contrasting
urban settings. Ecological indicators, 62, 212-219.
Drusch, M., Del Bello, U., Carlier, S., Colin, O.,
Fernandez, V., Gascon, F. and Meygret, A. (2012).
Sentinel-2: ESA's optical high-resolution mission for
GMES operational services. Remote sensing of
Environment, 120, 25-36.
Državna geodetska uprava 2017. Digitalna ortofoto
karta – listovi naselja Sisak, Državna geodetska
uprava, Zagreb., retrived from (URL 7
https://geoportal.dgu.hr/) Accessed 05 January 2020.
Državni zavod za statisku (2011). Population data, retrived
from (URL 1 www.dzs.hr ) Accessed at 04 January
2020
Earth Explorer (2019). Satellite images, retrived from:
(URL 6 https://earthexplorer.usgs.gov/)
English Nature (2003). Providing accessible natural
greenspaces in towns and cities: a practical guide to
assessing the resources and implementing local
standards for provision, UK.
Environmental health indicators for the Rio+20 UN
Conference on Sustainable Development (2012).
Background paper for WHO/NIEHS Expert
consultation, Geneva, National Institute of
Environmental Health Sciences, 17-18 May.
Franklin, B. (2001). Discourses of Design: Perspectives on
the Meaning of Housing Quality and Good Housing
Design, Housing, Theory and Society, 18 (1-2), 79-92.
Frick, A., and Tervooren, S. (2019). A framework for the
long-term monitoring of urban green volume based on
multi-temporal and multi-sensoral remote sensing
data. Journal of Geovisualization and Spatial
Analysis, 3(1), 6.
Geofabrik (2019). retrieved from (URL 2 http://www.
geofabrik.de/) Accessed at 02 January 2020
Hoffimann, E., Barros, H., Ribeiro, A., I. (2017).
''Socioeconomic inequalities in Green Space quality
and accessibility – evidence from a Southern European
City'', Int J Environ Res Public Health, 14(8): 916.
International Standards Organization (ISO), (2014). ISO
37120: Sustainable Development of Communities –
Indicators for City Services and Quality of Life.
Kabisch, N., Haase, D., (2013). Green spaces of European
cities revisited for 1990–2006. Landsc. Urban Plan.
110, 113–122.
Karayannis, G., (2014). Dissecting ISO 37120: Why shady
planning is good for smart cities, SmartCitiesCouncil,
retrieved from ( URL 3 http://smartcitiescouncil.com/
article/dissecting-iso-37120-why-shady-planning-
good-smart-cities), Accessed at 30 March 2019.
Kuta, A. A., Odumosu, J. O., Ajayi, O. G., Zitta, N.,
Samail-Ija, H. A., E.A. Adesina (2014). Using a GIS-
Based Network Analysis to Determine Urban
Greenspace Accessibility for Different Socio-
Economic Groups, Specifically Related to Deprivation
in Leicester, UK, Civil and Environmental Research 6
(9): 12-20.
Mak, C., Scholz, M., P. James (2017): Sustainable
drainage system site assessment method using urban
ecosystem services, Urban Ecosystems 20 (2): 293-
307.
Pacione, M. (1986). Quality of life in Glasgow: an applied
geographical analysis, Environment and Planning A:
Economy and Space, 18 (11), 1499-1520.
Selmi, W., Weber, C., Riviere, E., Blond, N., Mehdi, L.,
Nowak, D. (2016). ''Air pollution removal by trees in
public green spaces in Strasbourg, France'', Urban
Forestry & Urban Greening, 17 (2016) 192–201.
Šiljeg, S., Marić I., NIkolić G., Šiljeg A. (2018): “Analiza
dostupnosti urbanih zelenih površina u naselju Zadar”,
Šumarski list, Vol. 142 No.9-10, 2018.
Slukan-Altić M. (2003.). Povijesni atlas gradova,
II.svezak; Sisak, Zagreb.
Taylor, B., Fernando, P., Bauman, A., Williamson, A.,
Craig, J., Redman, S. (2011). Measuring the quality of
public open space using Google Earth. Am. J. Prev.
Med. 40 (2), 105–112.
United Nations (2018). World population to reach 9.7
billion by 2050 - UN, retrieved from (URL 4
https://www.dw.com/en/world-population-to-reach-
97-billion-by-2050-un/a-49241728) Accessed at 02
January 2020.
Van Herzele, A., Wiedemann, T. (2003). A monitoring
tool for the provision of accessible and attractive urban
green spaces. Landsc. Urban Plan. 63, 109–126.
World Health Organization (2020). Urban green spaces,
retrieved from (URL 5 who.int/sustainable-
development/cities/health-risk/urban-green-space/en/)
Accessed at 15 January 2020.
Zadar Nova, (2016). Urban Green Belts (UGB) project
WPT 1 Activity 1.1, Common methodology for local
assessment and analysis of urban green space (UGS)
(http://www.zadra.hr/wpcontent/uploads/2016/10/Met
odologija.pdf), Accessed 25 March 2019.)
Multiscale GIS based Analysis of Urban Green Spaces (UGS) Accessibility: Case Study of Sisak (Croatia)
245
