
A Comprehensive Evaluation of Economic Vitality and Markov's
Prediction: An Empirical Study of a Major City in China
Ziqian Xia
1
, Jinquan Ye
2
and Xie Guan
3
1
Jiluan Academy, Nanchang University, No.999 Xuefu Road, Nanchang, China
2
School of Management, Nanchang University, No.999 Xuefu Road, Nanchang, China
3
Jiangxi Vocational College of Mechanical & Electrical Technology, Nanchang, China
Keywords: Economic Vitality, Markov Forecasting, Comprehensive Evaluation.
Abstract: The region's economic vitality is an important part of its competitiveness. Based on previous studies, we use
the grounded theory to perform indexing and then uses the Entropy method and Topsis evaluation methods to
conduct a comprehensive evaluation of economic vitality for a major city in China. Finally, Markov
forecasting is deployed. The forecasting method studied the trend of the vitality. Economic vitality is of great
significance to regional economic division and regional policy formulation. Our thesis uses Chinese data to
construct a model of economic vitality, filling an empirical gap in economic vitality research.
1 INTRODUCTION
Since China joined the world trade organization, the
economy has grown exponentially. Although
economic development can be perceived by the
enhancing of life quality, the evaluation of regional
economic development is still necessary. For a long
time, GDP as the index dominate the economics
evaluation in China. However, the gross domestic
product index cannot fully represent the situation of
the economy especially the vitality of the economy.
So the Economic vitality(EV) index is constructed in
this paper, which is a comprehensive index includes
the dimensions of multiple industries and can provide
support for economic policy decisions.
2 LITERATURE REVIEW
Many scholars have made contributions to the
regional economic vitality, some of which define the
economic vitality index. For foreign scholars, Human
Capital Index(HCI) indicators (Kraay A, 2018) are
often used to represent the vitality of a region (Yang
et al, 2020; Barro & Lee, 2013), or to link economic
vitality with community development (Martyniuk et
al, 2016).For Chinese scholars, after many efforts of
defining the economic vitality, there is currently no
dominant indicator for EV and there is also a lack of
functional test of indicators. Here we summarize the
definition as follows:
Table 1: Summary of literature.
Metrics Authors
Production output; Fiscal surplus;
Number of enterprises; Disposable
income; Science and technology
spending; Health and pensions etc.
Lou et al, 2005
Fiscal revenue; Education and
manpower; Income; Employment;
Innovation ability etc.
Lu et al, 2007
Urbanization; Industrialization; GDP etc. Sun et al, 2007
Economic growth; Enterprise benefit;
Social security etc.
Jin et al, 2007
The degree of opening; Quality of life;
The innovation ability etc.
Hou et al, 2015
Human resources; Private economy;
Industrial structure etc.
He et al, 2019
Government intervention; Consumption;
Infrastructure construction; The
investment structure etc.
Lu et al, 2019
It can be seen that the current research on
economic vitality has some problems, such as the
inconsistency between the definition and the selection
criteria of indicators. As for the HCI index, it is too
difficult to obtain relevant data. Therefore the
education index is often used to replace all HCI
indicators, which can only reflect only one aspect of
the region vitality and the prediction based in that
Xia, Z., Ye, J. and Guan, X.
A Comprehensive Evaluation of Economic Vitality and Markov’s Prediction: An Empirical Study of a Major City in China.
DOI: 10.5220/0009469500490054
In Proceedings of the 2nd International Conference on Finance, Economics, Management and IT Business (FEMIB 2020), pages 49-54
ISBN: 978-989-758-422-0
Copyright
c
2020 by SCITEPRESS – Science and Technology Publications, Lda. All rights reserved
49

indicator for the overall situation is not convincing.
Moreover, the economic vitality is limited to the
economic vitality of the community, which leads to
its narrow definition and is not an macroeconomic
indicator. The selection criteria of indicators are not
open and clear enough, which brings doubts on the
credibility and usefulness of indicators.
Based on the above problems, our research
refers to the development of a comprehensive
evaluation system of economic vitality from a macro
perspective, in which the data of evaluation indicators
are easy to obtain, and the effect of this index is
performed.
3 DEFINITION OF ECONOMIC
VITALITY
We will define metrics through the following criteria:
Data accessibility, Comprehensiveness, and Data
continuity. Economic activity will be measured by
following metrics:
Consumer price index(CPI)
International tourism arrivals(ITA)
Real estate investment (RI)
Industrial production(IP)
Imports and Exports(IE)
Transport(T)
The data come from the Shanghai bureau of
statistics.
4 COMPREHENSIVE
EVALUATION
4.1 Entropy Method
a. First, we establish the decision-making matrix of
the indicators. In the matrix, each row is matched with
a time node and the column refers to the indicators.
Then we using the concept of entropy information to
determine the weight of the indicators:
11 12 1
21 22 2
12
s
s
tt ts
x
xx
x
xx
X=
x
xx
(1)
where
ij
x
represents the value of the
j
indicator
of the time node
i
.
After normalized:
1
ij
ij
t
ij
i
x
r
x
(2)
b. So we can find the information entropy of the
indicators:
1
ln
ln
t
ij ij
i
j
rr
e
t
(3)
c. Calculating weight vectors:
1
1
(1 )
j
j
s
j
j
e
w
e
(4)
4.2 Topsis Evaluation
After the entropy method is deployed, Topsis
evaluation method is used to calculate the overall
performance score of the various indicators of each
time node, and it finally returns a column with Topsis
value between 0 to 1.
Here we note that the information utility value of
an indicator depends on the difference coefficient of
the indicator, its value directly affects the size of the
weight, the greater the information utility, the
greater the importance to the evaluation,and the
greater the weight.
a. Calculate the normal matrix:
2
1
ij
ij
n
ij
j
a
a
a
(5)
b. Recalculate the normalized matrix after
weighting:
ij ij j
Va
(6)
c. Then find the ideal optimal solution and the
ideal worst solution to the index. Here we define that
if the indicator is considered beneficial to economic
vitality then the optimal solution will be the
maximum value of all the observation concerning the
weight for this indicator. And vice the unhelpful
indicator takes the minimum value. The worst
solution and the optimal solution value is opposite to
each other, and obviously, here only the CPI is a non-
FEMIB 2020 - 2nd International Conference on Finance, Economics, Management and IT Business
50
beneficial indicator which we always expect to be at
a appropriate interval.
i. Calculates the ideal optimal solution of the
Euclid distance.
2
1
()
n
iijj
j
SVV
(7)
j. Calculating the ideal worst solution of the Euclid
distance of the standardized matrix.
2
1
()
n
iijj
j
SVV
(8)
k. Finally get performance ratings for each time
nodes.
i
i
ii
S
E
SS
(9)
4.3 Inspection of the Result Data
After we get the economic vitality, we need to further
analyze the general trend of Shanghai's economic
vitality.
We will use the ' Moving horizon estimation' to fit
the general trend of economic vitality in Shanghai.
The process is as follows. We assume that the
prediction of a value in the future depends on the
average of the 'n' number in front of it. The predicted
value of target, the mathematical expression is:
1
0
1
ˆ
k
ttn
n
yy
k
(10)
In fact, this also has the effect of smoothing the
original time series data to find the changing trend of
the data.
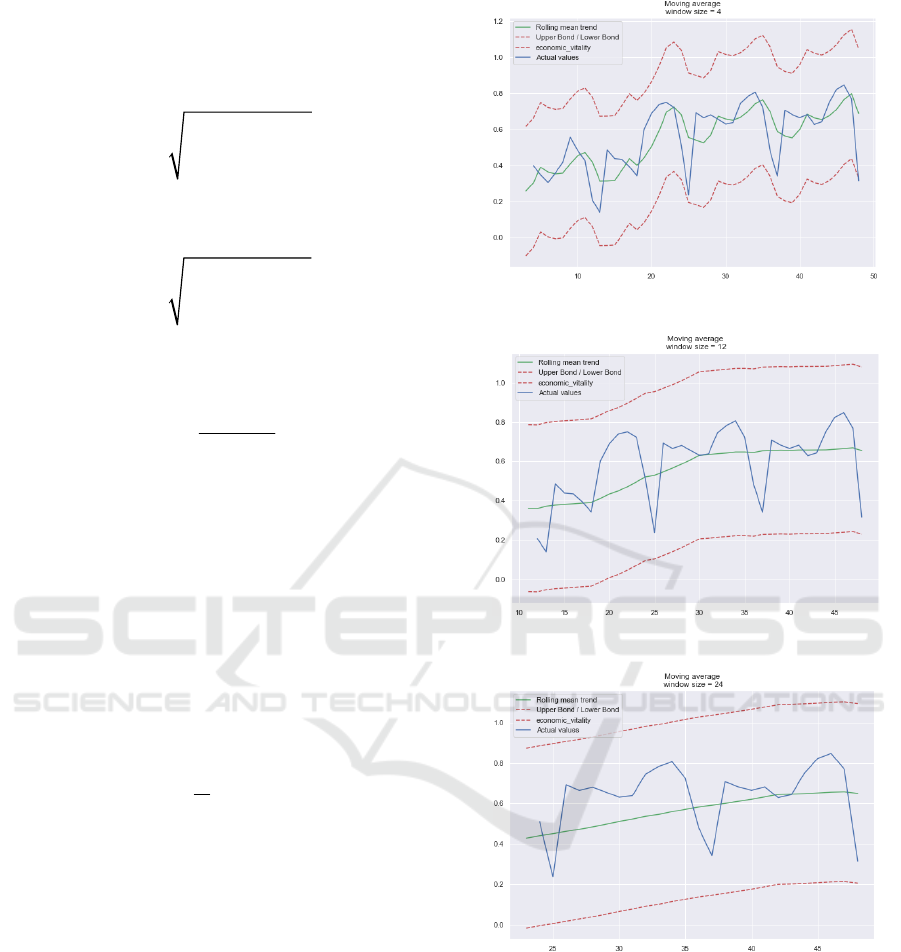
We made a smooth data graph with sliding
window values of 4(month), 12(month) and
24(month). The results are shown in the following
figure.
From the graph, we can see that all of the data in
these three images are within the confidence interval.
Moreover, these smoothing results indicate that the
economic vitality of Shanghai is rising steadily,
which is the most obvious among the smoothing
results with a sliding window value of 24 months.
This is consistent with the actual situation and reflects
the rationality and accuracy of the index.
Figure 1: Moving average size=4.
Figure 2: Moving average size=12.
Figure 3: Moving average size=24.
5 MARKOV PREDICTION
5.1 Markov Prediction Model
By defining economic vitality index, we use Topsis
and entropy method to get the weight of each
economic vitality index. After determining the index
weight, the specific value of the economic vitality of
each month in Shanghai is obtained. By observing the
A Comprehensive Evaluation of Economic Vitality and Markov’s Prediction: An Empirical Study of a Major City in China
51

time series diagram, it is concluded that the economic
vitality growth rate of Shanghai defined by various
indicators has periodic fluctuation in time. Based on
this property, 'Markov' model can be used to analyze
and predict the growth rate of Shanghai's economic
vitality in the coming months. And compared with the
actual results, the difference between the actual
results and the predicted results was analyzed.
Summarize the reasons and make further assumptions.
5.2 Model Calculation
a. Establishment of decision matrix:
11 12 1
21 22 2
12
f
f
ee ef
hh h
hh h
H
hh h
(11)
b. The value NEY
i
is the monthly economic vitality
c. Calculate the monthly growth rate of economic
activity:
1
1
ii
i
i
NEY NEY
gr
NEY
(12)
d. In our study, we found that the quarter digit,
median digit and three-quarters digit of the economic
vitality growth rate of Shanghai were about -0.15,
0,0.15 respectively.
We define the probability matrix of state transition.
Firstly, C
1
can be defined as grade a, C
2
as grade b ,
C
3
as grade c and C
4
as grade d. As shown in the
following table.
Table 2: Transition Table.
Rank A B C D
Economic
vitality
growth rate
rating
(-∞,-0.15) [-0.15,0) [0,0.15) [0.15,+ ∞)
Then, according to the definition of conditional
probability, The state transition probability P(C
i
C
j
) from state C
i
to C
j
is the conditional probability
P(C
j
| C
i
), as:
()(|)
ij i j j i
STP P C C =P C C
(13)
So we get the transition probability matrix:
11 12 1
21 22 2
12
f
f
ff ff
STP STP STP
STP STP STP
STP
STP STP STP
(14)
It is obvious that:
1
01
1
ij
f
ij
j
STP
STP
(15)
e. Markov prediction method is used to predict the
probability of state occurrence in the process of time
development. The state probability is represented by
the symbol
j
(
k
), and
k
is the transfer times:
1
() 1
f
j
j
k
(16)
Then according to markov process's no aftereffect
and Bayes conditional probability formula, we can
get:
1
() ( 1)
f
jiji
i
kSTPk
(17)
We have the row vector
12
() [ () () ()]
f
kkk k
(18)
and we use that to get the vector iteration formula:
() ( 1) (0)( )
k
kkSTP STP
(19)
5.3 Prediction Result
The predicted results are shown in the following
Table 3: The results of the Markov.
Year.Month Rank Probability
2020.2
A
0.428571
B 0
C 0
D 0.571429
2020.3
A
0.183673
B 0.28514
C 0.171429
D 0.359184
FEMIB 2020 - 2nd International Conference on Finance, Economics, Management and IT Business
52

Table 3: The results of the Markov. (cont.)
Year.Month Rank Probability
2020.4
A
0.153153
B 0.386359
C 0.225048
D 0.23544
2020.5
A
0.16573
B 0.394502
C 0.226987
D 0.212781
N month
(steady state)
A
0.172996
B 0.387838
C 0.22255
D 0.216617
5.4 Prediction Result Analysis
Through the analysis of the above table, it can be seen
that February 2020 presents A polarized form, and the
probability of economic vitality growth rate grade A
is' 0.428571 ', while the probability of economic
vitality growth rate grade D is' 0.571429 '.This shows
that according to the historical data of the last four
years, January 2020 is in the trough of cyclical
fluctuations in the growth rate of economic vitality.
Therefore, based on the historical data, it is
predicted that the possibility of a continuous decline
in the economic vitality growth rate in '2020.2' is'
0.408571 '. This is because of the particularity of the
Chinese year cycle, and there is such a long holiday
as the Spring Festival in China. In Holiday people
will reduce a variety of normal economic activities;
The date of the Spring Festival is determined by the
lunar calendar, which usually falls in January or
February. So this form of polarization makes sense,
and it fits the reality.
6 INSIGHTS ADVICE TO THE
GOVERNMENT
Markov forecast allows us to have a comprehensive
grasp of the future economic situation, so that the
government can adjust economic policies in time. For
the current Markov results, Shanghai, as China's
economic center city, has maintained a stable growth
of economic vitality. In some months, such as the
months of Chinese Spring Festival, we can clearly see
that the economic vitality reaches a local maximum.
But in the long run, it is more and more difficult
to maintain high economic vitality with the increase
of economic volume. At present, China's economic
growth is slowing down. As a prior indicator of
economic development, economic vitality can
effectively show the current and future economic
level of a region.
This paper suggests that the government can use
the following methods to maintain economic vitality:
Carrying out industrial reform, using welfare fiscal
policies, improving the level of international opening-
up, speeding up the regional integration development
strategy and forming regional growth poles.
7 FUTURE WORK
Due to the current situation of COVID-19
pneumonia, China's economy and even the world
economy have been disrupted by the sudden
epidemic. In the context of blocking cities, reducing
international exchanges and suppressing
agglomeration, the economy has suffered huge losses.
The next work can assess the economic loss of the
epidemic through the economic vitality determined in
this paper, and provide theoretical support for the
economic recovery.
REFERENCES
Kraay, A. (2018). Methodology for a World Bank human
capital index. The World Bank.
Yang, Z., & Pan, Y. (2020). Are cities losing their vitality?
Exploring human capital in Chinese cities. Habitat
International, 96, 102104.
Barro, R. J., & Lee, J. W. (2013). A new data set of
educational attainment in the world, 1950–2010.
Journal of development economics, 104, 184-198.
Martyniuk-Peczek, J., Parteka, T., & Peczek, G. (2016).
Territorial Aspects of Entrepreneurial Activity in Polish
Suburban Zones. Procedia engineering, 161, 1639-
1646.
Lou haimiao, & sun qiubi. (2005). Evaluation of economic
vitality of Chinese provinces based on factor analysis.
Journal of fuzhou university (philosophy and social
sciences) (03), 33-36.
Lu xiaoli, & guo wanshan. (2007). Comprehensive
evaluation index system of urban economic vitality.
Statistics and decision-making, 2007 (11), 77-78.
Sun faping, ma hongbo, & wang lanying. Research on
strengthening economic vitality of qinghai. Qinghai
ethnic studies (3), 92-98.
Jin yan-jie. Evaluation of urban economic vitality in China.
Geography science (1), 11-18.
Hou rongtao. Construction of economic vitality evaluation
system and empirical analysis of futian district [J].
Economist (6) : 148-150.
A Comprehensive Evaluation of Economic Vitality and Markov’s Prediction: An Empirical Study of a Major City in China
53

He Ruqun. (2019). The pearl river, west river economic belt
urban economic dynamism evaluation research.
(Doctoral dissertation, guangxi normal university).
Lu jin, & wang xiaofei. (2019). Fixed asset investment,
aging and economic vitality - a study based on the
provincial perspective. Journal of population (5).
FEMIB 2020 - 2nd International Conference on Finance, Economics, Management and IT Business
54
