
Spatial Characteristics of Communication in Urban Vehicular System
Antal Ily
´
es, Tomaj Kov
´
acs, Gr
´
eta Tisza and Imre Varga
a
Department of IT Systems and Networks, University of Debrecen, Kassai str. 26, Debrecen, Hungary
Keywords:
Traffic, VANET, Information Spreading, ABM, Radius of Gyration, Bounding Box.
Abstract:
We propose a model of information spreading based on urban traffic, where smart vehicles can carry data of
sensor measurements and share them by short-range wireless communication. The spreading of information
can be quite fast and widespread without central control within this ad hoc network. In this position paper,
we want to characterize some spatial aspects of the spreading process. We planned to analyze the radius
of gyration and the bounding box of the 2D positions of informed agents and communication events. First
simulation results show a crossover in the time evolution of the system.
1 INTRODUCTION
Over the last decade, we have witnessed many re-
search efforts that have investigated various aspects
of Vehicular Ad hoc NETworks (VANET). Due to the
equipped On Board Units (OBU) of modern smart
vehicles they can continuously perform Vehicle-to-
Vehicle (V2V) communication. Besides, vehicles
can also exchange information with Road Side Units
(RSU) via Vehicle-to-Infrastructure (V2I) communi-
cation. Messages related to traffic information, road
conditions, local utility information are carried and
forwarded by vehicles, thus the key component of the
infotainment services in VANETs is the data dissem-
ination. It is the base of several applications, such
as adaptive navigation, vehicle safety, traffic manage-
ment or different location-based services.
These systems attract industrial and scientific in-
terest as the number of research papers shows. The
traffic flow was analyzed and simulated in different
scenarios (Fiore et al., 2007; Zeadally et al., 2012;
Meignan et al., 2006). Wireless communication pro-
tocols (e.g. IEEE 802.11p) were developed and their
performance were measured (Malla and Sahu, 2013;
Ramakrishna, 2012; Sanguesa et al., 2016). Af-
ter the communication is available within an urban
system the topology of this network was also in-
vestigated (Zhang and Le, 2015; Kocsis and Varga,
2019). In intelligent transportation systems, vehicles
can play the role of routers, not just simple senders
or receivers. Thus special routing protocols were de-
veloped and introduced (Mtech and Malhotra, 2016;
a
https://orcid.org/0000-0003-3921-2521
Malla and Sahu, 2013; Rehman et al., 2013; Ramakr-
ishna, 2012) as well. The statistical physics of the
information spreading processes was also published
(Varga et al., 2018).
In this work, we would like to find the answers
to further open questions. Where are the vehicles
carrying information packets? How large is the area
concerned by the dissemination? How does its size
change in time? What is the shape of the affected
area? Does it have almost circular symmetry or elon-
gated prolate shape due to primary roads? Is the den-
sity of informed vehicles constant or are they spatially
centralized? Is communication only on the perimeter
of the area?
The rest of the paper is organized as follows. Sec-
tion 2 provides our own model of urban traffic and the
spreading of information. Section 3 presents the spa-
tial characteristics we interested in and our hypothe-
ses. Some preliminary results are in section 4. Fi-
nally, we conclude the paper.
2 MODEL
In order to study the spreading of information
in VANET, an agent-based model (ABM) is pro-
posed describing both the urban traffic and the self-
organized communication of vehicles.
2.1 Traffic
An urban road map can be modeled by straight road
segments, where a connection between two neighbor-
108
Ilyés, A., Kovács, T., Tisza, G. and Varga, I.
Spatial Characteristics of Communication in Urban Vehicular System.
DOI: 10.5220/0009464001080112
In Proceedings of the 5th International Conference on Complexity, Future Information Systems and Risk (COMPLEXIS 2020), pages 108-112
ISBN: 978-989-758-427-5
Copyright
c
2020 by SCITEPRESS – Science and Technology Publications, Lda. All rights reserved

Figure 1: The urban road map of Debrecen (left) was con-
verted to a weighted graph connecting real geographical
locations with different kinds of straight road segments
(right).
ing crossroads can be represented as a concatenated
segment list. Thus the road map of Debrecen (Open-
StreetMap, 2019) was converted to a graph, where
the nodes are planar geographical locations, the end-
points of straight road segments as it is illustrated in
Figure 1. The length of a link is defined by the dis-
tance of the nodes connected by the given link. The
links also differ in other sense because the average
speed of vehicles varies on different types of roads
(primary route, living street, highway, etc.). In our
model we assume that point-like vehicles move with
a constant velocity determined by only the road type.
In this way, it is a mesoscale approach of the traf-
fic, where microscale objects (e.g. traffic lights, junc-
tions, pedestrian crossing, etc.) are taken into account
only by the average speed.
Each vehicle have a randomly selected departure
and arrival location within the city and between them
they proceed along the shortest travel time routes.
They derive from the lengths of links and the average
speed on them using the Dijkstra’s algorithm (Dijk-
stra, 1959). The amount of vehicles in the model is
constant since the simulated time intervals are short
(circa 10 minutes) compared to the duration of the
different phases of the daily life periods of the ur-
ban traffic. Thus rush-hours or off-peak periods can
be modeled only separately. If a vehicle arrives at
its destination, a new one will be launched, just for
simplicity. The left side of Figure 2 demonstrates the
motion of three vehicles using discrete timescale for
computer simulation.
This model is quite similar to the model intro-
duced by Varga et al. (2018), but there is a huge differ-
ence. The recent model is based on the real geograph-
ical locations contrary to the former model which was
a simplified model ignoring the shape of roads and fo-
cusing on only the connections of crossroads. There
the Cartesian coordinates of vehicles were not man-
aged just the distances from the two neighboring junc-
Figure 2: (Left) Colored circles illustrate the positions of
3 vehicles in different discrete-time moments along their
routes during the time evolution. Distinct distances between
consecutive circles show the various average speed on dif-
ferent ranked road segments. (right) A time moment of the
system, where the communication ranges R of agents are
presented by green areas. Blue and red circles refer unin-
formed and informed agent, respectively, while the newly
informed agents have gradient color.
tions. In the recent work, there are nodes with degree
k = 2 along bent roads between junctions. Thus the
number of nodes is much higher resulting in more
computational effort but makes us able to study the
geographical properties of spreading.
2.2 Information Spreading
Vehicles can be equipped with smart on-board units.
Their sensors can perform different measurements
and then they are able to share this information via
short-range wireless communication. After the mea-
surement, the given car can carry the information and
in the vicinity of other vehicles, it is shared. In this
way, the source of information packets are the ve-
hicles themselves, there are no road-side units just
vehicle-to-vehicle communication. Thus useful infor-
mation (e.g. traffic or weather alerts) can spread in
this complex system. For the sake of simplicity in this
work we consider only one measurement and follow
the spreading of this information packet.
Vehicles are the agents of this ABM, having only
two states. Initially, all the agents are in an unin-
formed state denoted by S
i
= 0 because they have not
received information yet. Due to the sensor measure-
ment, one of the agents becomes informed (S
i
= 1).
It is the T = 0 time moment of the simulation. Since
agents are moving they can meet. If the uniformed
agent j is within the R communication range of the in-
formed agent i, then j becomes informed S
j
= 1. Thus
both of them can carry and share the information later.
See the right side of the Figure 2. There is only one
state change in this model similar to the Susceptible-
Infected epidemic model (Newman, 2010).
Spatial Characteristics of Communication in Urban Vehicular System
109
3 SPATIAL FEATURES
In order to capture the geographical features of the
spreading process, we planned to study the spatial dis-
tribution of three different location sets.
• Recent locations of informed agents,
• Spots of all the information exchanges in the past,
• Spots of information exchanges in the recent time
moment.
All of them mean a set of 2D points, which are in the
focus of our analysis to describe the spreading pro-
cess. We are going to calculate four quantities of the
above-mentioned position sets:
• Radius of gyration (R
g
),
• Area of the bounding box (A),
• Ratio of the side lengths of the bounding box
(L/W ),
• Largest distance between an informed agent and
the information source (d
max
).
The radius of gyration R
g
is mathematically the
root mean square distance of the points from the cen-
ter of mass at ~r
c
(assuming unit mass for all points).
Formally it defined as
R
2
g
=
1
N
N
∑
i=1
(~r
i
−~r
c
), (1)
where N is the number of points and ~r
i
is the posi-
tion of location i. It can be interpreted as an average
coverage of the set of points. Additionally, in poly-
mer physics is it used to describe the shape. When
the radius of gyration is proportional to the number of
points it refers to linear shape, while if R
g
∝ N
2
we
have a planar structure.
A minimal bounding box of planar structure can
be defined as the smallest rectangular area, where the
longer line of symmetry is parallel to the line segment
connecting the two furthermost points. In Figure 3,
the length and width of this rectangular is denoted by
L and W , respectively. The area of the bounding box
is A = L × W . The A denotes the planar size of the
system (similar to R
2
g
) and the L/W ratio of the side
lengths refers to the shape.
The location of the sensor measures, where the
initial source agent starts to share the information
packet can be far from later informed agents, which
get the packet via multiple information exchanges.
The recent distance of agent i from the source is de-
noted by d
i
(t). The distance of the furthermost agent
d
max
≥ d
i
can be also an interesting characteristic of
the system.
0
10
20
30
40
50
60
70
80
90
100
0 10 20 30 40 50 60 70 80 90 100
0
10
20
30
40
50
60
70
80
90
100
y
0 10 20 30 40 50 60 70 80 90 100
x
R
g
L
W
R
g
=40.0
L/W=1.00
A=6400
a)
0
10
20
30
40
50
60
70
80
90
100
0 10 20 30 40 50 60 70 80 90 100
0
10
20
30
40
50
60
70
80
90
100
y
0 10 20 30 40 50 60 70 80 90 100
x
R
g
L
W
R
g
=27.4
L/W=1.15
A=5540
b)
0
10
20
30
40
50
60
70
80
90
100
0 10 20 30 40 50 60 70 80 90 100
0
10
20
30
40
50
60
70
80
90
100
y
0 10 20 30 40 50 60 70 80 90 100
x
R
g
L
W
R
g
=30.7
L/W=1.00
A=6400
c)
0
10
20
30
40
50
60
70
80
90
100
0 10 20 30 40 50 60 70 80 90 100
0
10
20
30
40
50
60
70
80
90
100
y
0 10 20 30 40 50 60 70 80 90 100
x
R
g
L
W
R
g
=24.0
L/W=5.50
A=1164
d)
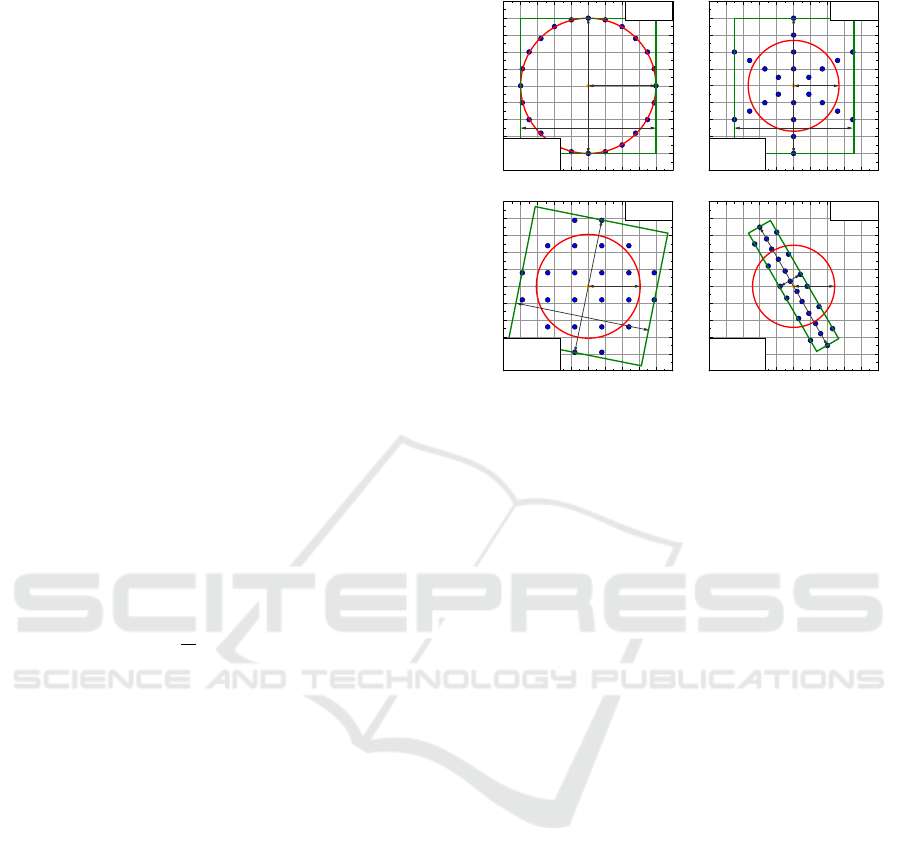
Figure 3: Regular arrangements of 24 planar points to illus-
trate various spacial properties. a) A circular structure with
large radius of gyration. b) Radial structure with square-like
bounding box (L/W ≈ 1) and lower R
g
. c) A square grid
structure where the uniform distribution results in lower R
g
then in case of circular structure nevertheless the value of
A is the same. d) A prolate structure, which is dense (low
value of R
g
and A) and longish (high value of L/W ).
By these quantities, we can capture differences be-
tween the structures in Figure 3, although all of them
contain the same amount of points. The small value
of R
g
refers to a dense structure. (Compare Figure 3a
and Figure 3b.) Similarly, a smaller value of A can
be found in a more concentrated structure. (Compare
Figure 3c and Figure 3d.) The large L/R ratio can
be observed in Figure 3d because the shape is linear
rather than planar.
3.1 Hypotheses
The number of informed agents increasing very inten-
sively and quickly reach a saturation. Sooner or later
the majority of agents will be in informed states. The
information spans the whole city within a short time
interval.
At a given time moment the communication takes
place not only at the peripheral region of the area
covered by the informed agent because there are uni-
formed agents within this area, so the area is not com-
pact.
We suppose that at the beginning of the spreading
process, the informed agents are within a linear area
due to the relatively straight road segments. However
later it still remains linear for intervals longer than
distances between junctions due to the neighboring
priority roads, which have precedence in case of long
COMPLEXIS 2020 - 5th International Conference on Complexity, Future Information Systems and Risk
110
rides. After a long time of dissemination, the bound-
ing box of the affected area starts to be square-like.
Thus there will be a crossover between the linear and
planar phase.
4 FIRST RESULTS
Our self-developed agent-based software is over the
tests. We plan to carry out a lot of simulations in or-
der to discover the parameter space. We are at the be-
ginning of this long process, but some interesting fea-
tures of the system have been already reported. The
following results are obtained by the simulation of a
few ten-thousand vehicles and using a communication
range covering a few meters wide area.
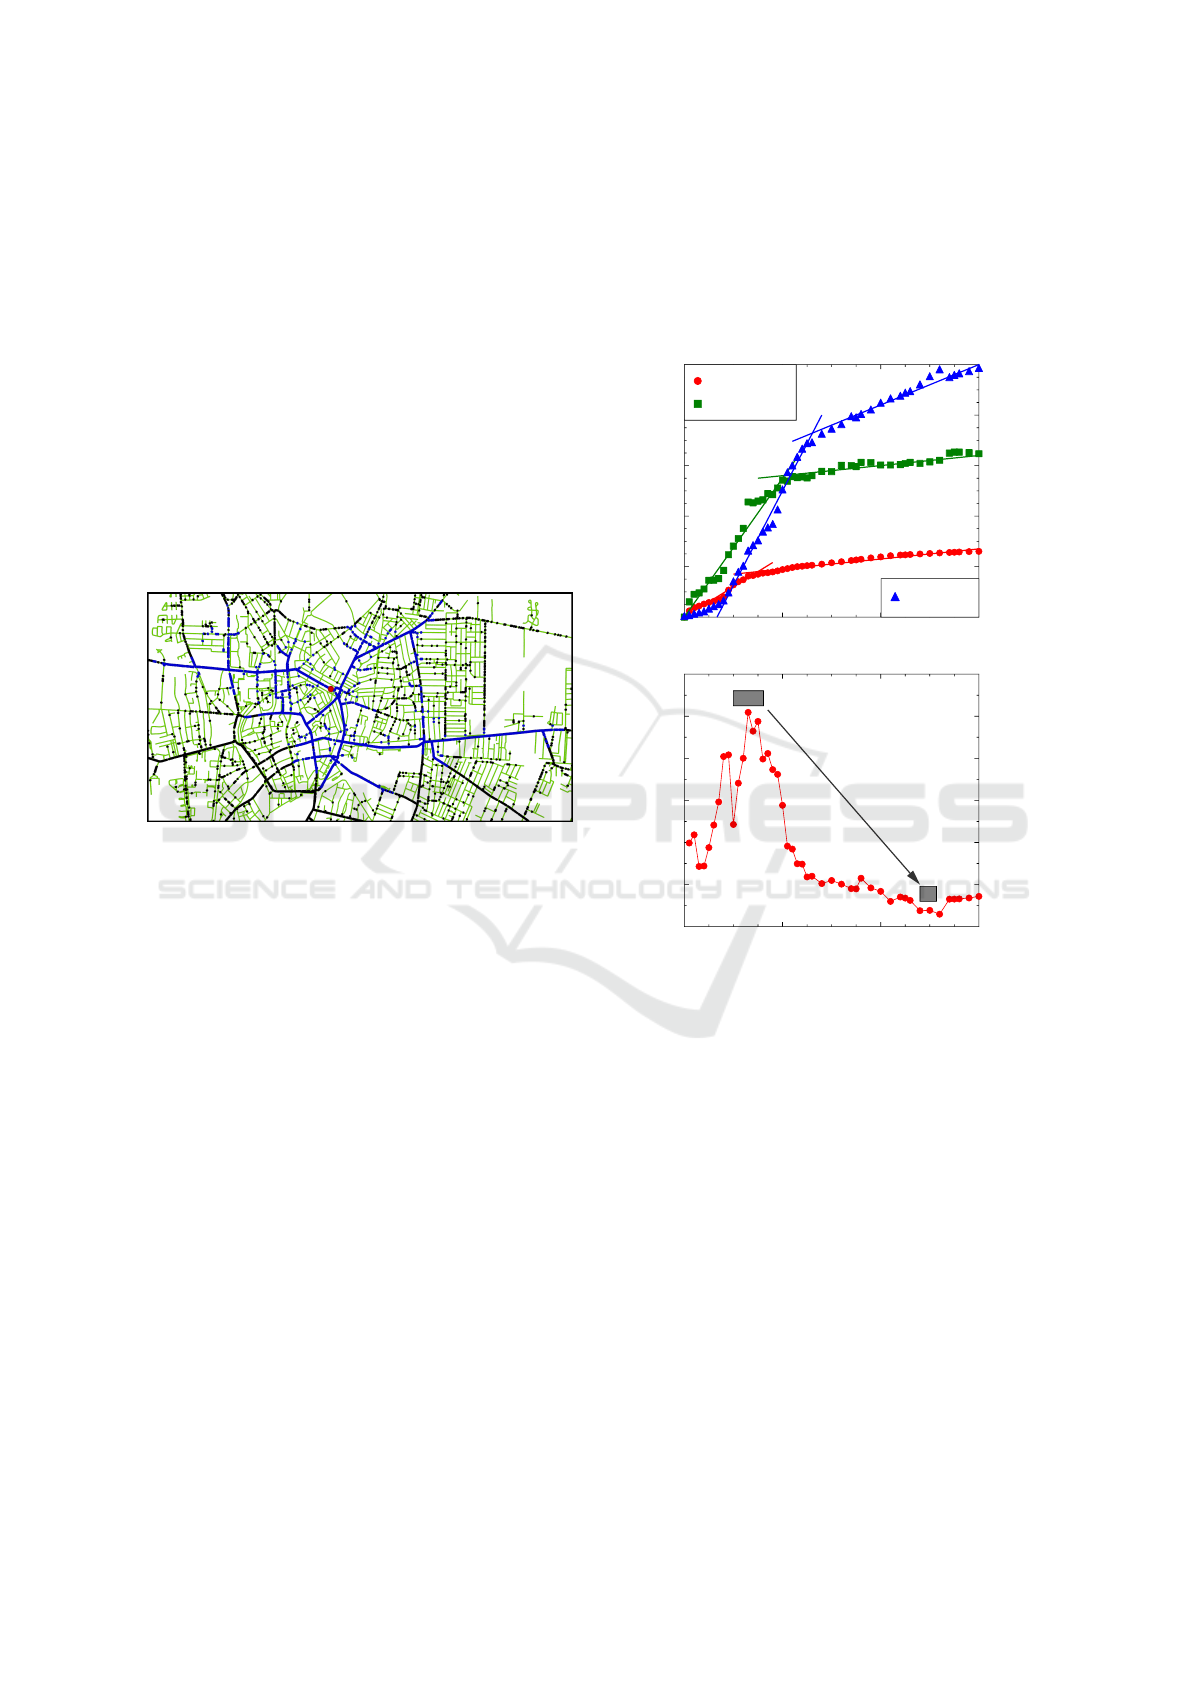
Figure 4: A snapshot of the system covering just the central
part of Debrecen. The black and blue spots represent the
uninformed and informed vehicles, respectively. The red
circle in the middle marks the location of the information
source when it triggered off the spreading process. As one
can see the main roads are very crowded while residential
ones have low loads. The information dissemination is more
dominant along the primary roads.
At first sight, the general behavior of the system is
very realistic even though the model is quite simple.
However real-life measurements and statistics are not
available, the distribution of vehicles is very similar to
the traffic, we experience every day as local drivers.
After an agent starts to share information as an ini-
tial source neighboring agents receive and forward it.
Thus more and more agents become informed until
we reach saturation, where almost all the smart vehi-
cles are informed within a few minutes. A snapshot
of the spreading process is shown in Figure 4.
All the studied quantities have two distinct phases.
At first, the linear spreading dominates the system.
The radius of gyration and the maximal distance of in-
formed agents from the source are increasing rapidly.
The length L and the width W of the minimal bound-
ing box are definitely different. Later, as more agents
carry the information all over the city the slopes of
the R
g
(t), A(t) and the d
max
(t) are decreasing signif-
icantly and the bounding box becomes more square-
like (see Figure 5). The reason for this can be the
local topology. In the former phase, the affected area
covers only one almost straight main road. Contrary
later the informed agents mainly proceed on several
primary roads in different directions of the 2D plane.
0
2
4
6
8
10
distances [km]
0
20
40
60
80
100
area [km
2
]
0 100 200 300
t [s]
R
g
[km]
d
max
[km]
A [km
2
]
a)
1.0
1.2
1.4
1.6
1.8
2.0
2.2
L / W
0 100 200 300
t [s]
b)
Figure 5: A) A crossover can be observed in several quanti-
ties. Both the radius of gyration, the maximal distance from
the source and the area of the bounding box changes quali-
tatively in time. The presented curves are obtained from the
recent locations of informed vehicles. b) The shape of the
bounding box is gradually changing from rectangular form
to square-like form as the L/W ratio is converging to a value
close to 1.
5 CONCLUSIONS
Our self-developed software implements a simple but
efficient mesoscopic model of urban traffic. Based on
this, one can observe an ad hoc communication net-
work of moving devices, which can accomplish infor-
mation dissemination. We would like to analyze the
spatial features of the spreading process observing the
sets of different locations.
We found empirical correspondence of the sim-
ulations and the real observations. A lot of simula-
Spatial Characteristics of Communication in Urban Vehicular System
111

tions and the evaluation of their results are ahead of
us. However we are just at the beginning of a long,
detailed analysis, some interesting features of the sys-
tem have already been found. The spreading process
is not uniform, one can observe two distinct phases
of the time evolution of the spreading caused by the
local urban topology.
ACKNOWLEDGEMENTS
This work was supported by the construction EFOP-
3.6.3-VEKOP-16-2017-00002. The project was sup-
ported by the European Union, co-financed by the Eu-
ropean Social Fund.
Map data copyrighted OpenStreetMap contributors
and available from https://www.openstreetmap.org.
REFERENCES
Dijkstra, E. W. (1959). A note on two problems in connex-
ion with graphs. Numerische mathematik, 1(1):269–
271.
Fiore, M., Harri, J., Filali, F., and Bonnet, C. (2007). Ve-
hicular mobility simulation for vanets. In 40th An-
nual Simulation Symposium ANSS ’07., pages 301–
309. IEEE.
Kocsis, G. and Varga, I. (2019). The effect of moving agents
on the network formation in smart-city applications.
Computer Modelling and New Technologies, 23:44–
49.
Malla, A. M. and Sahu, R. K. (2013). A review on vehicle
to vehicle communication protocols in vanets. Inter-
national Journal of Advanced Research in Computer
Science and Software Engineering, 3(2):409–414.
Meignan, D., Simonin, O., and Koukam, A. (2006). Multi-
agent approach for simulation and evaluation of urban
bus networks. In Autonomous Agents and Multiagent
Systems (AAMAS 2006).
Mtech, N. and Malhotra, D. (2016). Vehicular ad hoc net-
works (vanet). International Journal of Advanced Re-
search in Electronics and Communication Engineer-
ing, 5(4):1003–1008.
Newman, M. E. J. (2010). Networks - An introduction. Ox-
ford University Press.
OpenStreetMap (2019). https://www.openstreetmap.org.
Ramakrishna, M. (2012). Dbr: Distance based routing pro-
tocol for vanets. International Journal of Information
and Electronics Engineering, 2(2):228–232.
Rehman, S., Khan, M. A., Zia, T. A., and Zheng, L. (2013).
Vehicular ad-hoc networks (vanets) - an overview and
challenges. Journal of Wireless Networking and Com-
munications, 3(3):29–38.
Sanguesa, J. A., Fogue, M., Garrido, P., Martinez, F. J.,
Cano, J.-C., and Calafate, C. T. (2016). A survey and
comparative study of broadcast warning message dis-
semination schemes for vanets. Mobile Information
Systems, 2016:8714142.
Varga, I., N
´
emethy, A., and Kocsis, G. (2018). Cellular Au-
tomata, volume 11115 of Lecture Notes in Computer
Science, chapter Agent-Based Simulation of Informa-
tion Spreading in VANET, pages 166–174. Springer
Nature Switzerland.
Zeadally, S., Hunt, R., Chen, Y.-S., Irwin, A., and Hassan,
A. (2012). Vehicular ad hoc networks (vanets): status,
results, and challenges. Telecommunication Systems,
50(4):217–241.
Zhang, H. and Le, J. (2015). Modeling and dynamical
topology properties of vanet based on complex net-
works theory. AIP ADVANCES, 5:017150.
COMPLEXIS 2020 - 5th International Conference on Complexity, Future Information Systems and Risk
112
