
Scenario-based Evolvability Analysis of Service-oriented Systems:
A Lightweight and Tool-supported Method
Justus Bogner
1,2 a
, Stefan Wagner
1 b
and Alfred Zimmermann
2
1
University of Stuttgart, Institute of Software Technology, Software Engineering Group, Germany
2
University of Applied Sciences Reutlingen, Herman Hollerith Center, Germany
Keywords:
Evolvability, Modifiability, Scenario-based Evaluation, Evolution Scenarios, Service-based Systems,
Microservices.
Abstract:
Scenario-based analysis is a comprehensive technique to evaluate software quality and can provide more de-
tailed insights than e.g. maintainability metrics. Since such methods typically require significant manual
effort, we designed a lightweight scenario-based evolvability evaluation method. To increase efficiency and
to limit assumptions, the method exclusively targets service- and microservice-based systems. Additionally,
we implemented web-based tool support for each step. Method and tool were also evaluated with a survey
(N=40) that focused on change effort estimation techniques and hands-on interviews (N=7) that focused on
usability. Based on the evaluation results, we improved method and tool support further. To increase reuse and
transparency, the web-based application as well as all survey and interview artifacts are publicly available on
GitHub. In its current state, the tool-supported method is ready for first industry case studies.
1 INTRODUCTION
Quantitative software quality assessment with met-
rics is very common in today’s software development
practice. It can often be automated with tools and is
therefore fast and reliable. However, finding practi-
cal and effective metrics is far from trivial (Bouwers
et al., 2012). Especially in the area of maintainability,
metrics are a structural proxy for how effective and
efficient software can be modified. While this relies
on the nature of the selected modification, common
maintainability metrics cannot take this into account.
The selection and interpretation of suitable maintain-
ability metrics have therefore been – and arguably still
are – challenging tasks (Heitlager et al., 2007; Ostberg
and Wagner, 2014).
A promising qualitative alternative or complement
is therefore scenario-based analysis, which focuses
on the architecture of a system. Kazman et al. (1996)
describe scenarios as “brief narratives of expected or
anticipated use of a system from both development
and end-user viewpoints”. Several methods have been
proposed for this (see Section 2), most notably the Ar-
chitecture Tradeoff Analysis Method (ATAM) (Kaz-
a
https://orcid.org/0000-0001-5788-0991
b
https://orcid.org/0000-0002-5256-8429
man et al., 2000). While such methods are well suited
to evaluate the impact of specific changes, they re-
quire significant manual effort and the presence of
several system stakeholders.
Since the two service-based architectural styles
service-oriented architecture (SOA) (Erl, 2005) and
microservices (Newman, 2015) place strong empha-
sis on architecture quality and sustainable evolution,
they are fitting candidates for such evaluation meth-
ods. The architectural properties of service orienta-
tion (Papazoglou, 2003), such as the usage of services
as top-level distributed components or the separation
of service interface and implementation, provide a
convenient conceptual framing to reason about these
systems. Moreover, tool support for the metric-based
analysis of service- and microservice-based systems
is lacking (Bogner et al., 2019a, 2020), which makes
alternative evaluation approaches even more impor-
tant.
In this paper, we therefore propose a lightweight
scenario-based method explicitly designed for the
evolvability analysis of service-based systems. Prop-
erties like service independence and encapsulation as
well as tool support are leveraged to decrease man-
ual efforts usually associated with qualitative analy-
sis. In the remainder of this paper, we first thoroughly
introduce the background of scenario-based analysis
204
Bogner, J., Wagner, S. and Zimmermann, A.
Scenario-based Evolvability Analysis of Service-oriented Systems: A Lightweight and Tool-supported Method.
DOI: 10.5220/0009463902040215
In Proceedings of the 15th International Conference on Evaluation of Novel Approaches to Software Engineering (ENASE 2020), pages 204-215
ISBN: 978-989-758-421-3
Copyright
c
2020 by SCITEPRESS – Science and Technology Publications, Lda. All rights reserved

(Section 2) and also present more recent related work
(Section 3). Afterwards, we explain the details of our
approach and also illustrate it with a running example
(Section 4). We then describe the evaluation of the
tool-supported method with a survey and with hands-
on interviews (Section 5). Finally, we discuss threats
to validity (Section 6) and close with a summary and
outlook on future work (Section 7).
2 SCENARIO-BASED ANALYSIS
While scenarios can be used during requirements en-
gineering or for the documentation of functionality,
qualitative scenario-based analysis is also a compre-
hensive approach to evaluate software quality (Kaz-
man et al., 1996). During such a method, differ-
ent scenarios for the future evolution of the system
are collected and documented (scenario elicitation).
Elicitation takes place as a group effort with various
stakeholders, such as developers, architects, opera-
tors, or end-users. Scenario documentation often hap-
pens according to a standardized scenario template
and can include various aspects of software architec-
ture change characterization (Williams and Carver,
2010). Afterwards, the system’s capacity to accom-
modate the elicited scenarios is evaluated, which may
help in identifying architectural issues. Table 1 shows
a concrete example of such an evolution scenario. The
used template is an adapted version of the template
from Bass et al. (2012).
Several scenario-based methods have been pro-
posed so far. An early literature survey by Dobrica
and Niemela (2002) discussed eight notable architec-
ture analysis methods, from which six rely on scenar-
ios. One of the earliest approaches in this area were
change cases from Ecklund et al. (1996). By adapting
use cases from object-oriented analysis, they created
a concept to identify and document potential future
changes of the system. Change cases were then used
to improve the existing system design. A more promi-
nent and influential method was the Software Archi-
tecture Analysis Method (SAAM) from Kazman et al.
(1996). It can target several quality attributes, but is
usually focused on modifiability. SAAM consists of
the following steps:
1. Describe Candidate Architecture: architecture
documentation is created or collected as the foun-
dation for the analysis.
2. Develop Scenarios: scenarios are collected and
documented. They should cover diverse functions
and roles of the system.
3. Perform Scenario Evaluations: for each sce-
Table 1: Evolution scenario example (Bass et al., 2012).
Scenario Attribute Scenario Value
Title: Add GitHub as a new login
option
Description: To provide a more conve-
nient login and account man-
agement experience for most
users, a single sign-on option
with a GitHub account should
be implemented.
Attribute: Evolvability
Stimulus: End-users request new login
option
Affected artifacts: LoginComponent, UserInter-
faceComponent, UserMan-
agementComponent
Environment: Design time
Response: Modifications are imple-
mented, automatic tests are
created, components are
deployed
Expected effort: 8 hours
nario, the technical stakeholders determine and
document if the architecture is able to accommo-
date the scenario directly or if changes are neces-
sary (indirect scenario). Change details and cost
estimations are documented, too.
4. Reveal Scenario Interaction: as an indicator for
appropriate separation of concerns, stakeholders
determine the degree to which several different
scenarios impact the same component. Few sce-
nario conflicts are beneficial.
5. Overall Evaluation: scenarios are weighted
based on their importance, which supports com-
ing to a final evaluation verdict.
SAAM served as inspiration or predecessor for sev-
eral other scenario-based methods, most notably the
Architecture Tradeoff Analysis Method (ATAM) that
was conceived at the Software Engineering Institute
(SEI) in Pittsburgh (Kazman et al., 2000). ATAM is
a very structured and comprehensive method which is
not only focused on the analysis of how well a sys-
tem fulfills its diverse quality requirements, but also
– as the name suggests – on trade-offs and interplay
between quality attribute goals. Similar to SAAM,
two types of scenarios are used within ATAM: a) use
case scenarios that describe the current usage of the
system and b) change scenarios that try to describe
the anticipated system usage in the future. The lat-
ter are further subdivided into near-term and probable
growth scenarios and more extreme and stressful ex-
ploratory scenarios. ATAM’s process comprises nine
Scenario-based Evolvability Analysis of Service-oriented Systems: A Lightweight and Tool-supported Method
205

steps:
1. Present the ATAM: the method is explained to
the various stakeholders.
2. Present Business Drivers: the system’s business
goals are explained to clarify the most important
architectural drivers.
3. Present Architecture: the system’s architecture
is described and set in relation to its business
drivers.
4. Identify Architectural Approaches: important
architectural knowledge for the system (e.g. ex-
isting patterns or architectural styles) is collected
and documented.
5. Generate Quality Attribute Utility Tree: the
system’s most important quality attribute goals
are refined as a prioritized utility tree.
6. Analyze Architectural Approaches: the col-
lected architectural approaches are analyzed w.r.t.
their impact on quality attribute goals. This
includes looking for weaknesses or sensitivity
points.
7. Brainstorm and Prioritize Scenarios: stake-
holders collect, document, and prioritize (e.g. via
voting) use case and change scenarios (scenario
elicitation step).
8. Analyze Architectural Approaches: as a reitera-
tion of step 6, each prioritized scenario is mapped
onto existing architectural approaches that have
an impact on it.
9. Present Results: all information and results doc-
umented during the ATAM are summarized and
presented back to the stakeholders.
While such methods provide very rich insights and are
well suited to evaluate the impact of specific changes,
they require significant manual effort and the presence
of several system stakeholders, often in a workshop-
like fashion over several days. This large amount of
effort with e.g. ATAM led to the creation of more fo-
cused and lightweight methods (see also Section 3).
One notable example is the Architecture-Level Modi-
fiability Analysis (ALMA) (Bengtsson et al., 2004),
which exclusively targets modifiability as a quality
attribute. It also places strong emphasis on change
propagation (“ripple effects”) and change cost or im-
pact estimation. ALMA served as inspiration for
many other methods, including the one presented in
this paper.
3 RELATED WORK
Another example for such a lightweight architecture
evaluation method is the Tiny Architectural Review
Approach (TARA) from Woods (2011) that relies on
a combination of expert judgment and metrics. While
Woods acknowledges that the research community
highly values scenarios, he sees their elicitation as too
time-consuming.
Koziolek et al. (2012) proposed another
lightweight method called MORPHOSIS. In ad-
dition to analyzing the architecture in terms of
future development scenarios, MORPHOSIS relies
on a reporting framework with several architectural
metrics. Its scenario analysis is based on an extended
version of ALMA and uses an ordinal scale for
scenario effort estimation.
Rostami et al. (2015) created a tool-supported
analysis approach for change propagation called
Karlsruhe Architectural Maintainability Prediction
(KAMP). With KAMP, the initial architecture is mod-
eled with annotated context information and then
compared to the target architecture for the change re-
quest. The tool calculates differences between the two
models to judge the change impact.
While no scenario-based methods for service-
based systems have been proposed, several publica-
tions touch related topics. Sabir et al. (2018) ana-
lyzed the specifics of the maintenance and evolution
of service-based systems. They pointed out key dif-
ferences and significant research challenges, such as
dependency and impact analysis or service-oriented
evolution patterns.
Wang et al. (2010) described an approach for
change impact analysis in service-based business pro-
cesses. Changes are applied to a model of the system
with a process and a service layer and subsequently
classified based on their impact.
Andrikopoulos (2010) conceptualized a theoreti-
cal framework based on formal modeling to support
SOA evolution in a non-breaking fashion. He focused
on shallow changes, i.e. changes which are local to
a service but may lead to ripple effects to consumers.
The framework provides models for versioned service
interfaces and compatible contract-based evolution.
Lastly, Wang et al. (2014) proposed a similar
model where a set of changes are applied to a service,
which may result in potential transitions to service
consumers. Using this model, the authors also define
service evolution patterns like the Compatibility Pat-
tern for changes without propagation or the Transition
Pattern for changes with ripple effects.
While several lightweight scenario-based methods
have been proposed and there is a large body of lit-
ENASE 2020 - 15th International Conference on Evaluation of Novel Approaches to Software Engineering
206
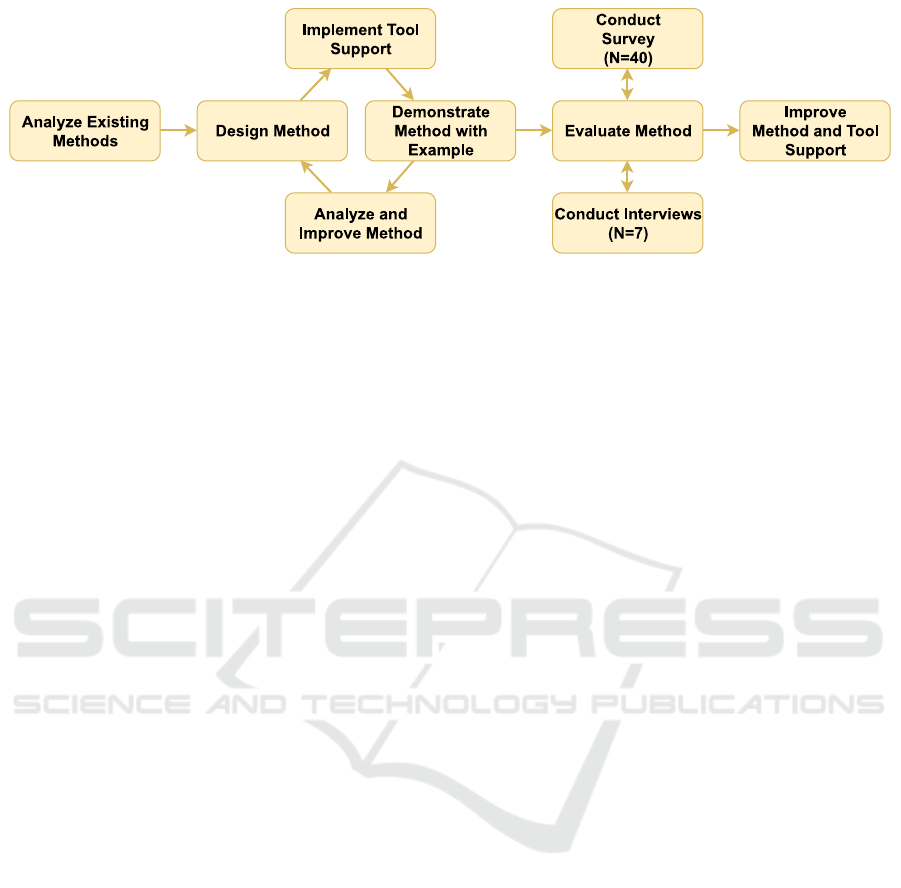
Figure 1: Research process for creating the scenario-based method.
erature on service-oriented change impact analysis or
service evolution patterns, no concrete scenario-based
method has been designed for service orientation. We
aim to address this gap by combining the two fields
and proposing such a specific method. Our goal with
this approach is to enable the efficient qualitative ar-
chitecture evaluation of service- and microservice-
based systems.
4 PROPOSED APPROACH
Our approach is explicitly designed to evaluate evolv-
ability (Rowe et al., 1998; Rajlich, 2018), i.e. the abil-
ity of a software system to efficiently accommodate
changes and extensions to its functional and cross-
functional requirements. Moreover, we specifically
target systems based on service orientation. By fo-
cusing on these limited system types and one qual-
ity attribute, we can rely on a more precise termi-
nology and change categorization. Furthermore, we
can assume a decent degree of service independence
as well as a clean separation of service interface and
implementation. Changes that do not modify a ser-
vice interface usually do not propagate to service con-
sumers. Lastly, we also tried to keep the method
lightweight by focusing on simplicity and tool sup-
port. The method is influenced by ALMA (Bengtsson
et al., 2004), but also by service-based change impact
analysis such as in Wang et al. (2010) and change cat-
egorization and patterns such as in Wang et al. (2014).
4.1 Research Process
The design of our proposed method took place in the
following way (see also Figure 1). First, we ana-
lyzed existing scenario-based methods like SAAM,
ATAM, and ALMA, but also specifically searched
for lightweight or service-based approaches (see Sec-
tion 3). Based on these results, we iteratively de-
signed our method. A design candidate for the
method was implemented in a web-based tool and
demonstrated by applying it to an example system.
We then analyzed method and tool for possible im-
provements, which we incorporated into the method.
Afterwards, the next iteration started. Once method
and tool reached a mature state, we evaluated this ver-
sion with an online survey as well as hands-on inter-
views (see Section 5). We then used these evalua-
tion results to improve method and tool for a second
time. In the following subsections, we present this
improved version.
4.2 Conceptual Model
Foundation for the method is a metamodel with five
different entities (see Figure 2). The analysis target
is a System that consists of at least one Service.
Optionally, dependencies between Services can be
modeled. The potential evolution of the System (e.g.
a service-based webshop) is described by coarse-
grained Scenarios (e.g. the addition of a new pay-
ment method). A Scenario consists of at least one
Change. A Change always targets a single Service
and may be of different Types, namely addition
(adding a new Service), modification (changing
an existing Service), or deletion (removing an ex-
isting Service). Additionally, a Change may also
ripple to other Services, especially if it modifies a
service interface. Previously specified service depen-
dencies are used to suggest potential ripple effects.
Changes also have associated Effort as a measure
for their implementation duration or complexity. Cur-
rently, we support the estimation techniques hours,
ordinal scale (1 to 10, with 10 being the most time
consuming / complex), COSMIC function points, and
story points.
Based on the created Scenarios, an evolvability
Evaluation for the System is synthesized. Effort
is aggregated to the Scenario level and then used
to compile various system evaluation metrics. In
general, information and metrics provided through
Scenario-based Evolvability Analysis of Service-oriented Systems: A Lightweight and Tool-supported Method
207
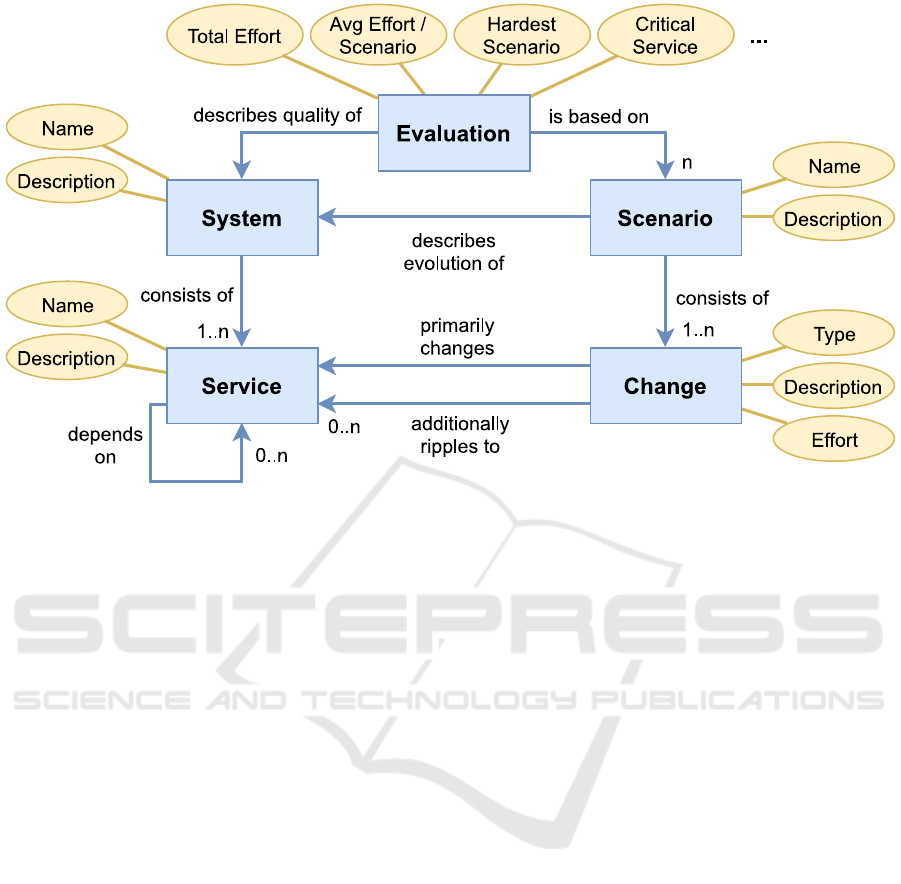
Figure 2: Simplified conceptual model of the method (rectangles represent entities, ellipses represent attributes, arrows with-
out cardinality represent 1-to-1 relations).
an Evaluation should support the estimation of the
system’s evolution qualities and the identification of
weak spots in the architecture. An Evaluation is
based on the list of Scenarios and relies on the fol-
lowing metrics:
• Metrics per Scenario:
– Number of Changes: the number of Changes
this Scenario consists of
– Scenario Effort: the total estimated Effort for
this Scenario, i.e. the summed up Effort of
all its Changes
– Number of Affected Services: the number of
Services that are impacted by this Scenario
– Most Impactful Change: the Change that rip-
ples to the largest number of Services
• Metrics per System:
– Total Effort per System: the total estimated
Effort for this System, i.e. its summed up
Scenario Efforts
– Average Effort per Scenario: the average Sce-
nario Effort for this System
– Hardest Scenario: the Scenario associated
with the highest Effort
– Most Impactful Scenario: the Scenario that
affects the largest number of Services
– Critical Service based on Changes: the
Service that is impacted by the largest num-
ber of Changes
– Critical Service based on Effort: the Service
that is associated with the highest combined
Change Efforts
– Service with Lowest Effort: the Service that
is associated with the lowest combined Change
Efforts
4.3 Method
The model presented above is the foundation for the
four different process steps of the method. We de-
signed them to also produce reasonable results with
only very few users, but the quality of the results will
increase if various stakeholders with both technical
and business roles are involved. Work within differ-
ent steps can also be distributed and performed inde-
pendently with a later synchronization meeting.
1. Describe the System Architecture: a list of
Services with a short description and (option-
ally) dependencies between them is created. This
step has to be performed by technical stakehold-
ers like developers or architects. If the System is
very large, a subset can be modeled instead, e.g. a
domain or subsystem.
2. Elicit Evolution Scenarios: possible future evo-
lution Scenarios are collected and documented.
Fitting candidates are cases likely to happen or
cases intuitively posing a high risk for the System.
ENASE 2020 - 15th International Conference on Evaluation of Novel Approaches to Software Engineering
208
For a broad range of Scenarios, business and do-
main experts should be included in this step.
3. Specify and Estimate Changes for Each Sce-
nario: the details and impact of the identified
Scenarios are now worked out by documenting
the concrete Changes. This step again requires
technical stakeholders.
(a) Specify and Estimate Initial Changes: the
initial set of Changes (one per affected
Service) is defined and the Effort for each
Change is estimated. Stakeholders should
agree on a single estimation technique, e.g.
hours. If work in this step is distributed, stake-
holders should first calibrate their estimation
with some example Changes.
(b) Identify Ripple Effects: for each Change,
potential ripple effects to other Services are
identified and documented as new Changes.
Service interface Changes are especially im-
portant for this step.
4. Evaluate Results: created Scenarios are an-
alyzed, estimated Effort is aggregated, and
Evaluation metrics are calculated. Based on
this, System evolvability is interpreted, weak
spots are identified, and architecture improve-
ments are derived. This step should be a synchro-
nized group activity.
4.4 Tool Support
To reduce manual efforts and to enable faster and
more reliable Evaluation, we developed a simple
web-based application that supports all steps of the
described process. Users can create and manage all
entities of the model via various forms, i.e. they
can model a System with Services and then cre-
ate Scenarios with Changes for this System. Af-
ter having created all Scenarios, they can navigate
to the Evaluation view, where Effort is automati-
cally aggregated and the described metrics are calcu-
lated. Additionally, pie charts are provided to illus-
trate the distribution of Efforts and Ripples. Con-
venient filtering and sorting can be used to explore
the created list of Scenarios. The prototype consists
of a RESTful API implemented in Node.js using the
Express framework. Data is persisted in MongoDB.
User access is possible via a web UI implemented
with Vue.js. Components can be easily deployed us-
ing Docker containers. We present the architecture of
this tool in Figure 3. The tool is available on GitHub
1
.
1
https://github.com/xJREB/ms-scenario-evaluation
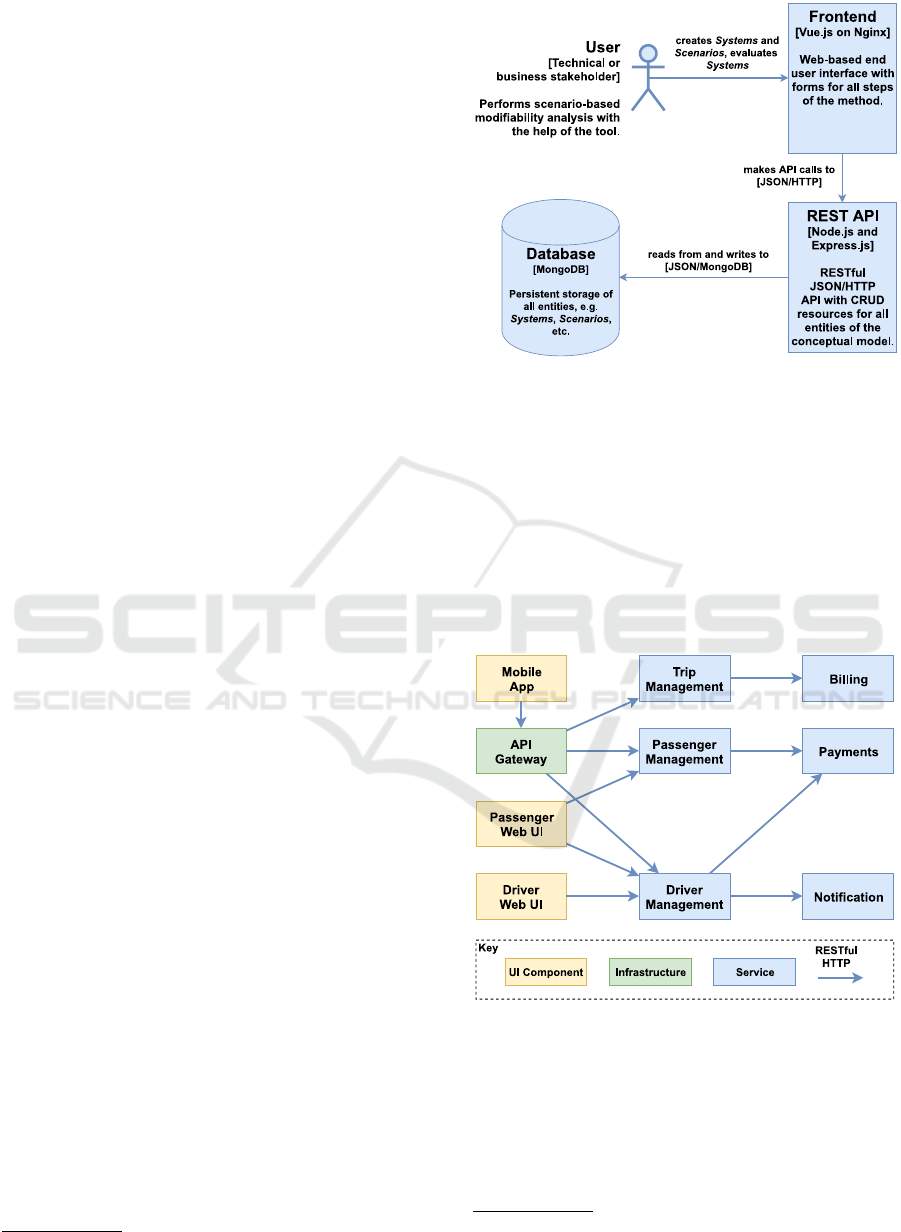
Figure 3: Architecture of the prototypical tool support.
4.5 Exemplary Demonstration
To demonstrate the application of the described
method, we present some concrete scenarios as well
as the aggregated Evaluation metrics. We use the
microservice architecture of a peer-to-peer rideshar-
ing platform as a running example
2
. A simplified
architecture diagram of this platform is presented in
Figure 4.
Figure 4: Simplified architecture of the example system.
For this System, we can then elicit Scenarios. We
present three simplified Scenario examples, two
business-driven ones with ripple effects (see Figure 5
and 6) and a technical one with local scope (see Fig-
ure 7). If we now perform an exemplary Evaluation
with these Scenarios via the tool, the described set
2
See https://dzone.com/articles/microservice-architectu
re-learn-build-and-deploy-a
Scenario-based Evolvability Analysis of Service-oriented Systems: A Lightweight and Tool-supported Method
209

Name: Add Bitcoin as new payment method
Description: To give users more flexibility, add
Bitcoin as a new payment method in the system.
Drivers can configure if they accept this option.
Changes:
• Add Bitcoin payment option to Payments
– Change type: modification
– Change effort: 80 hours
– Ripples to: Passenger Management,
Driver Management, Mobile App,
Passenger Web UI, Driver Web UI
• Add Bitcoin payment functionality to
Passenger Management
– Change type: modification
– Change effort: 20 hours
• Add Bitcoin payment functionality to Driver
Management
– Change type: modification
– Change effort: 30 hours
• Add Bitcoin payment UI elements to Mobile
App
– Change type: modification
– Change effort: 30 hours
• Add Bitcoin payment UI elements to
Passenger Web UI
– Change type: modification
– Change effort: 20 hours
• Add Bitcoin payment UI elements to Driver
Web UI
– Change type: modification
– Change effort: 30 hours
Figure 5: Scenario 1: add Bitcoin as new payment method.
of metrics will be calculated automatically. A list of
Scenarios will be shown in the tool’s Evaluation
view with all metrics on the Scenario level (illus-
trated in Table 2).
Additionally, the System-level metrics will be
calculated. The Total Effort per System is 540
hours, while the Average Effort per Scenario is 180
hours. The Rider Music introducing Scenario 2
is the Hardest Scenario with most Effort. Most
Impactful Scenario on the other hand is the Bit-
coin payment Scenario 1, since it affects the most
Services. Since Trip Management and the three UI
components are impacted by the most Changes, they
comprise the Critical Services Based on Changes.
With 120 hours, Trip Management is also the Crit-
ical Service Based on Effort (even though Music
Management is associated with 150 hours, it is cur-
rently not part of the System, as it is a hypothetical
Name: Add the Rider Music feature
Description: To allow passengers to play their fa-
vorite music, add functionality to integrate music
streaming services and to select playlists for a ride.
Drivers can configure if they support this feature.
Changes:
• Create a new Music Management service with
the basic functionality for the Rider Music fea-
ture. This service also includes a database to
persist associated data.
– Change type: addition
– Change effort: 150 hours
– Ripples to: Trip Management, Mobile
App, Passenger Web UI, Driver Web UI
• Add functionality for configuring a ride
playlist to Trip Management
– Change type: modification
– Change effort: 40 hours
• Add Rider Music UI elements to Mobile App
– Change type: modification
– Change effort: 30 hours
• Add Rider Music UI elements to Passenger
Web UI
– Change type: modification
– Change effort: 20 hours
• Add Rider Music UI elements to Driver Web
UI
– Change type: modification
– Change effort: 10 hours
Figure 6: Scenario 2: add the “Rider Music” feature.
Name: Replace database of Trip Management
Description: To improve the performance of
trip matching and searches, the current relational
database of the Trip Management should be re-
placed with Elasticsearch.
Changes:
• Replace the database of Trip Management
with Elasticsearch
– Change type: modification
– Change effort: 80 hours
– Ripples to: /
Figure 7: Scenario 3: replace the Trip Management
database.
new Service). Lastly, the Service with Lowest Effort
is Passenger Management with 20 hours.
ENASE 2020 - 15th International Conference on Evaluation of Novel Approaches to Software Engineering
210

Table 2: Scenario evaluation: list of scenarios with metrics.
Scenario ID # of Changes Scenario Effort Affected Services Most Impactful Change
1 6 210 hours 6 / 9 Add Bitcoin payment option to Payments
2 5 250 hours 4 / 9 Create new Music Management service
3 1 80 hours 1 / 9 Replace the Trip Management database
5 EVALUATION: SURVEY AND
INTERVIEWS
As a first indication for the usefulness and usability of
our tool-supported method, we conducted a two-fold
evaluation study, namely a web-based survey and per-
sonal hands-on interviews
3
. The survey primarily had
the goal to get expert opinions on different Effort
estimation techniques and our proposed Evaluation
metrics, which is expressed through the following re-
search questions:
RQ1: Which Change effort estimation techniques
do software professionals see as useful in the context
of our proposed method?
RQ2: Which of our proposed metrics do software
professionals see as useful in the Evaluation step of
our method?
It consisted of 17 questions and was hosted on
Google Forms for four weeks during April and May
2019. We distributed the survey via social media,
mailing lists, personal contacts, and platforms like
Surveycircle or Xing. In the end, we received 40
valid responses that we subsequently analyzed with
descriptive statistics and exploratory correlation anal-
ysis.
Of our 40 participants, 14 were active in industry,
13 in academia, and 13 in both fields. Participants had
a median of 8 years of professional experience (mean:
∼11 years). On a scale from 1 (“not familiar”) to 5
(“very familiar”), the median of their indicated famil-
iarity with service- and microservice-based systems
was 4 (mean: 4.1), while the median for familiar-
ity with scenario-based methods was 3 (mean: 2.8).
Exactly 50% (20) had already used a scenario-based
method for a real-world project.
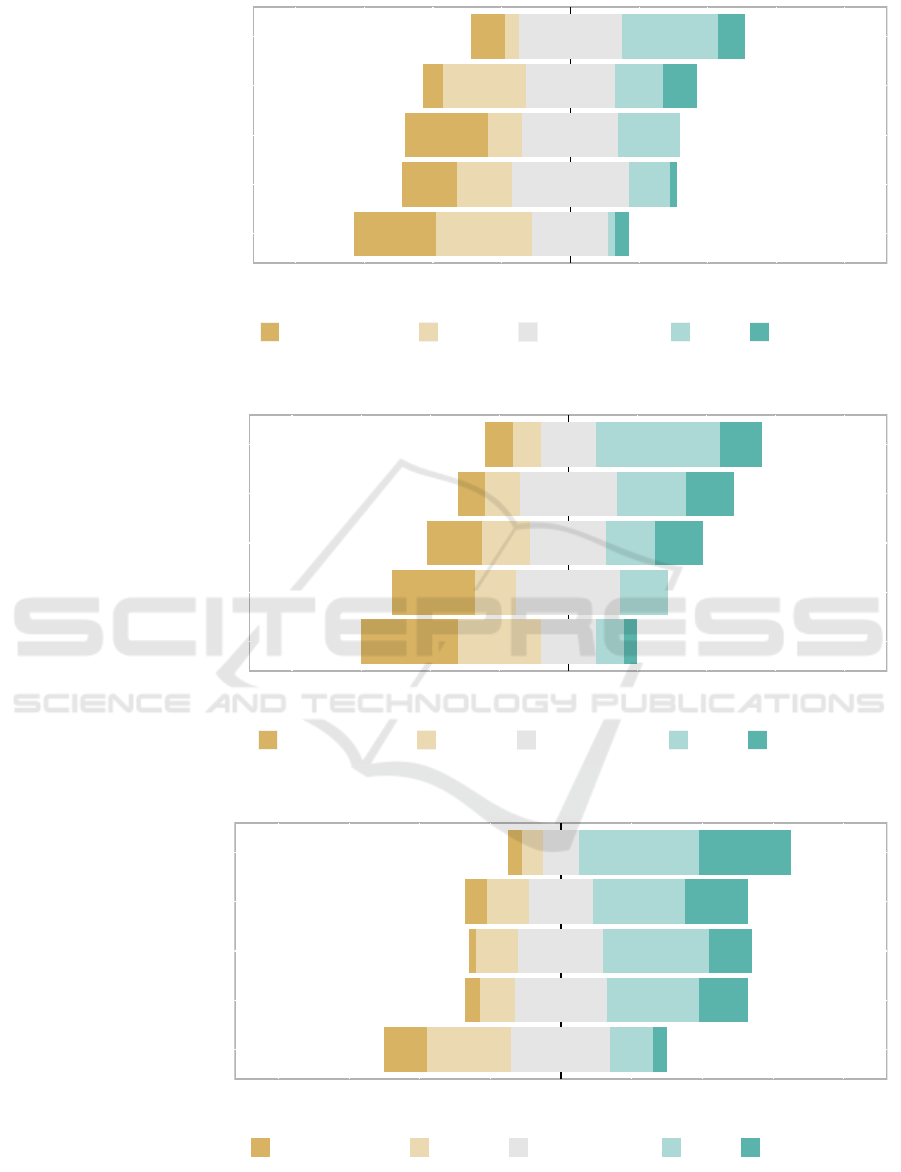
In the first part, participants were presented
with five different effort estimation techniques for
Changes, namely hours, lines of code, an ordinal
scale (1-10), COSMIC function points, and story
points. For each of these, they had to use a 5-point
Likert scale to rate how precise the technique is and
how applicable the technique is for such a method.
The results indicate that our participants favored story
points and hours for both precision (see Figure 8) and
3
We shared all study data and artifacts in the GitHub
repository ( docs/evaluation).
applicability (see Figure 9). The ordinal scale was
seen as somewhat neutral, while COSMIC function
points and especially lines of code received negative
ratings. As a consequence, we removed LOC estima-
tion from our tool.
In the second part of the survey, participants were
presented with screenshots from our Evaluation
view (see Figure 11 and 12) and were asked to rate
the perceived usefulness of five Evaluation met-
rics with a 5-point Likert scale (see Figure 10). The
best-rated metric was # of Affected Services / Sce-
nario (75% agreement). Participants saw the metrics
Most Modified Service, Service with Highest Effort,
and Change Impacting Most Services as moderately
useful (around 50% agreement with 20-30% neutral).
Only AVG Effort / Scenario was rated negatively (45%
disagreement, 35% neutral).
The interviews had the primary goal to evaluate
the efficiency and usability of the tool, which was
guided by the following two research questions:
RQ3: Can software professionals understand and
use our tool-supported method easily?
RQ4: How can the efficiency and usability of our
tool-supported method be improved further?
Participants first read a hand-out with task de-
scriptions that served as a step-by-step guide for ap-
plying the method to an example system, i.e. mod-
eling the described System with Services, creating
Scenarios with Changes, and lastly, coming to an
Evaluation. They then used the tool to work on
these tasks while the moderator observed and some-
times asked questions about their rationale. After
each step, the moderator asked some retrospective
questions about the perceived complexity and sugges-
tions for improvements. For the Evaluation view,
the hand-out also contained some comprehension
questions about the results. Afterwards, we created
a small case description for each interview. These
descriptions were later analyzed and improvements
were derived from them. Seven PhD candidates par-
ticipated in hands-on interviews (see Table 3). They
had a median of 6 years of professional experience
(mean: 9.3), a median familiarity with service-based
systems (1 to 5) of 2 (mean: 2.4), and a median fa-
miliarity with scenario-based methods (1 to 5) of 3
(mean: 2.9). They were not as experienced as the sur-
Scenario-based Evolvability Analysis of Service-oriented Systems: A Lightweight and Tool-supported Method
211
18%
38%
42%
40%
65%
45%
30%
22%
18%
8%
38%
32%
35%
42%
28%
Estimating with hours is
precise
Estimating with LOC is
precise
Estimating with an ordinal
scale (1−10) is precise
Estimating with Cosmic FP is
precise
Estimating with story points
is precise
100 50 0 50 100
Percentage
Response
strongly disagree (1) disagree (2) somewhat agree (3) agree (4) strongly agree (5)
Figure 8: Precision ratings for effort estimation techniques (survey).
20%
22%
38%
45%
65%
60%
42%
35%
18%
15%
20%
35%
28%
38%
20%
Hours are applicable for the
method
LOC are applicable for the
method
An ordinal scale (1−10) is
applicable for the method
Cosmic FP are applicable for
the method
Story Points are applicable
for the method
100 50 0 50 100
Percentage
Response
strongly disagree (1) disagree (2) somewhat agree (3) agree (4) strongly agree (5)
Figure 9: Applicability ratings for effort estimation techniques (survey).
12%
22%
18%
18%
45%
75%
55%
52%
50%
20%
12%
22%
30%
32%
35%
Most Modified Service is a
useful metric
Service with Highest Effort
is a useful metric
AVG Effort / Scenario is a
useful metric
Change Impacting Most
Services is a useful metric
# of Affected Services /
Scenario is a useful metric
100 50 0 50 100
Percentage
Response
strongly disagree (1) disagree (2) somewhat agree (3) agree (4) strongly agree (5)
Figure 10: Usefulness ratings for scenario evaluation metrics (survey).
ENASE 2020 - 15th International Conference on Evaluation of Novel Approaches to Software Engineering
212
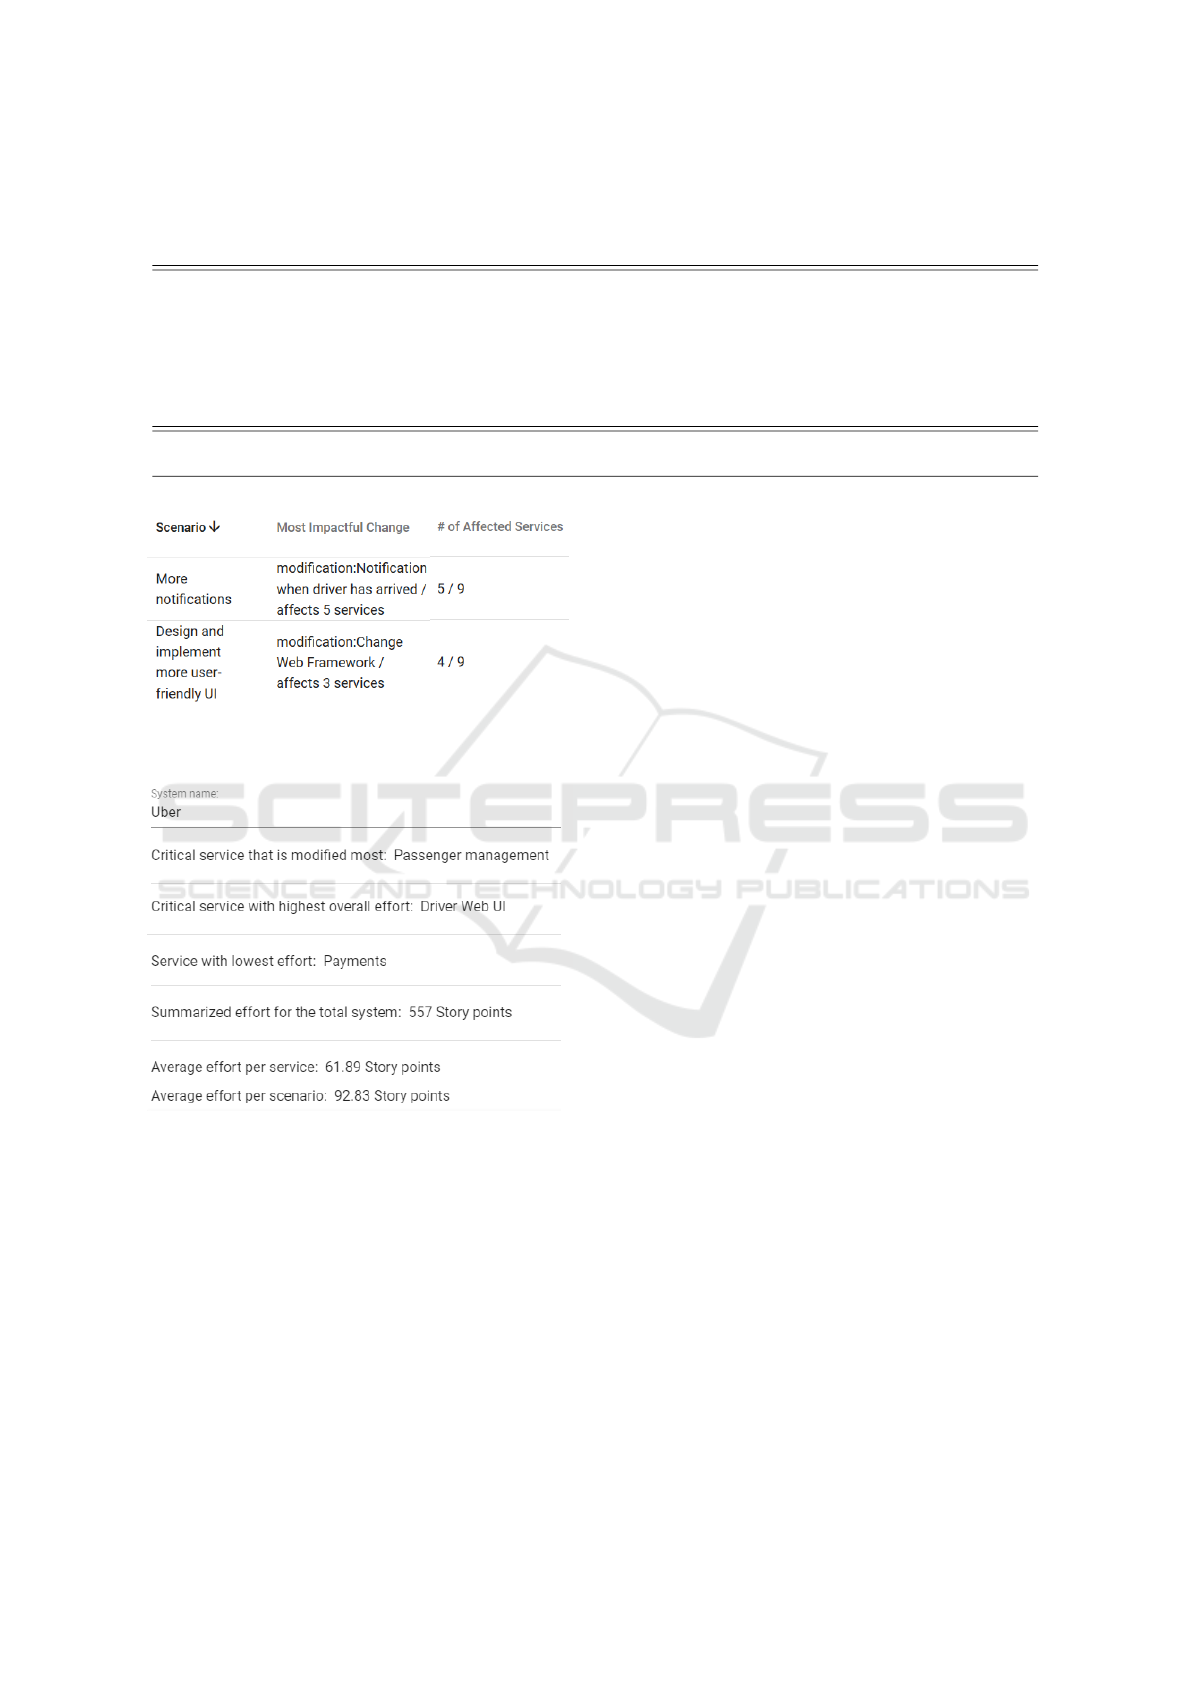
Table 3: Interviews: participant demographics and ratings.
ID Experience Familiarity with
Scenarios (1-5)
Familiarity with
Services (1-5)
Complexity of System
Creation (1-5)
Helpfulness of
Evaluation View (1-5)
1 19 years 3 2 2 4
2 17 years 4 3 2 4
3 6 years 2 3 1 4
4 8 years 4 2 1 5
5 6 years 2 2 1 4
6 6 years 1 3 1 4
7 3 years 4 2 1 4
Median: 6 years 3 2 1 4
Mean: 9.3 years 2.9 2.4 1.3 4.1
Figure 11: Scenario-Level metrics from the evaluation view
(tool screenshot for survey).
Figure 12: System-Level metrics from the evaluation view
(tool screenshot for survey).
vey participants, but since usability was the focus, this
was not problematic.
The interview results indicate that the tool is gen-
erally easy and convenient to use, e.g. participants
rated the complexity of the System creation step (1
to 5) with a median of 1 (mean: 1.3) or the helpful-
ness of the Evaluation view (1 to 5) with a median
of 4 (mean: 4.1). However, they also had many sug-
gestions to improve clarity and ease of use, especially
w.r.t. to the Scenario creation step. In total, we im-
plemented 15 of these improvements, such as mak-
ing suggested ripples clickable to automatically se-
lect them, refining the Scenario creation UI flow, or
adding a graphical System representation.
6 THREATS TO VALIDITY
While our two empirical studies indeed led to fur-
ther improvements for method and tool support, these
small evaluation steps are not sufficient. The effec-
tiveness of the method can only be reliably assessed
in an industrial setting with potentially larger sys-
tems and experienced stakeholders. Moreover, survey
and interview results may have suffered from typical
survey-based threats to validity. Even though we de-
fined all important concepts, participants may have
misunderstood or misinterpreted questions. For the
survey, participants also had no direct access to the
tool, but had to answer based on descriptions and
screenshots, which made it more difficult for them
to judge the usefulness of proposals. Another limi-
tation may be the participants’ self-reported experi-
ence. While the general experience level for the sur-
vey looks sufficient, participants may have overesti-
mated their qualifications. Lastly, we must be care-
ful to generalize from a sample size of 40 survey and
seven interview participants.
7 CONCLUSION
To provide means for efficient qualitative analy-
sis, we designed a lightweight scenario-based evolv-
ability evaluation method that targets service- and
microservice-based systems. We implemented web-
based tool support to ease manual efforts. Method and
tool were incrementally improved and finally eval-
uated with a survey (N=40) and interviews (N=7).
While our participants generally perceived the use-
fulness and usability of method and tool as positive,
Scenario-based Evolvability Analysis of Service-oriented Systems: A Lightweight and Tool-supported Method
213

these evaluations led to the implementation of 15
additional improvements. Even though the method
is certainly more time-consuming than metric-based
evaluation, the approach is very comprehensive and
able to evaluate specific evolution scenarios, e.g. the
most likely ones or the (presumably) most risky ones,
whereas metrics are oblivious to this. Moreover, it
incorporates the valuable knowledge of system stake-
holders into the analysis and therefore provides a
more human-centric evaluation. Lastly, our prototyp-
ical tool support can mitigate manual efforts. For con-
venient reuse and transparency, we published the tool
and all evaluation artifacts on GitHub
4
.
In conclusion, the method is now ready for first
industrial case studies, from which we expect fur-
ther refinements. As future work, industry evalu-
ations are therefore the most important line of re-
search. The method can only be reliably judged and
improved based on its application with diverse real-
world systems and stakeholders. Moreover, a system-
atic combination of this method with a metric-based
approach (Engel et al., 2018; Bogner et al., 2019b)
could lead to promising evaluation synergies. As an
example, structural maintainability metrics could sup-
port stakeholders during scenario effort prediction or
for the final evaluation.
ACKNOWLEDGEMENTS
We kindly thank Patrick Koss for his support with
the empirical studies and implementation work. Sim-
ilarly, we thank Gerhard Breul for his support with
method design and tool implementation. This re-
search was partially funded by the Ministry of Sci-
ence of Baden-W
¨
urttemberg, Germany, for the doc-
toral program Services Computing
5
.
REFERENCES
Andrikopoulos, V. (2010). A theory and model for the evo-
lution of software services. PhD thesis, Tilburg Uni-
versity.
Bass, L., Clements, P., and Kazman, R. (2012). Soft-
ware Architecture in Practice. Addison-Wesley Pro-
fessional, Westford, MA, USA, 3rd edition.
Bengtsson, P., Lassing, N., Bosch, J., and van Vliet,
H. (2004). Architecture-level modifiability analysis
(ALMA). Journal of Systems and Software, 69(1-
2):129–147.
4
https://github.com/xJREB/ms-scenario-evaluation
5
https://www.services-computing.de/?lang=en
Bogner, J., Fritzsch, J., Wagner, S., and Zimmermann,
A. (2019a). Assuring the Evolvability of Microser-
vices: Insights into Industry Practices and Challenges.
In 2019 IEEE International Conference on Software
Maintenance and Evolution (ICSME), pages 546–556,
Cleveland, Ohio, USA. IEEE.
Bogner, J., Schlinger, S., Wagner, S., and Zimmermann, A.
(2019b). A Modular Approach to Calculate Service-
Based Maintainability Metrics from Runtime Data
of Microservices. In 20th International Conference
on Product-Focused Software Process Improvement
(PROFES’19), pages 489–496. Springer Berlin Hei-
delberg, Barcelona, Spain.
Bogner, J., Weller, A., Wagner, S., and Zimmermann, A.
(2020). Exploring Maintainability Assurance Re-
search for Service- and Microservice-Based Systems:
Directions and Differences. In Cruz-Filipe, L., Gial-
lorenzo, S., Montesi, F., Peressotti, M., Rademacher,
F., and Sachweh, S., editors, Joint Post-proceedings
of the First and Second International Conference on
Microservices (Microservices2017/2019), volume 78,
pages 3:1–3:22, Dagstuhl, Germany. Schloss Dagstuhl
- Leibniz-Zentrum fuer Informatik.
Bouwers, E., Visser, J., and Van Deursen, A. (2012). Get-
ting What You Measure. Queue, 10(5):50.
Dobrica, L. and Niemela, E. (2002). A survey on software
architecture analysis methods. IEEE Transactions on
Software Engineering, 28(7):638–653.
Ecklund, E. F., Delcambre, L. M. L., and Freiling, M. J.
(1996). Change cases. In Proceedings of the 11th
ACM SIGPLAN conference on Object-oriented pro-
gramming, systems, languages, and applications -
OOPSLA ’96, pages 342–358, New York, New York,
USA. ACM Press.
Engel, T., Langermeier, M., Bauer, B., and Hofmann, A.
(2018). Evaluation of Microservice Architectures: A
Metric and Tool-Based Approach. In Mendling, J.
and Mouratidis, H., editors, Lecture Notes in Busi-
ness Information Processing, volume 317 of Lecture
Notes in Business Information Processing, pages 74–
89. Springer International Publishing, Cham.
Erl, T. (2005). Service-Oriented Architecture: Concepts,
Technology, and Design. Prentice Hall PTR, Upper
Saddle River, NJ, USA.
Heitlager, I., Kuipers, T., and Visser, J. (2007). A Practical
Model for Measuring Maintainability. In 6th Interna-
tional Conference on the Quality of Information and
Communications Technology (QUATIC 2007), pages
30–39. IEEE.
Kazman, R., Abowd, G., Bass, L., and Clements, P.
(1996). Scenario-based analysis of software architec-
ture. IEEE Software, 13(6):47–55.
Kazman, R., Klein, M., and Clements, P. (2000). ATAM:
Method for Architecture Evaluation. Technical Re-
port August, Software Engineering Institute, Carnegie
Mellon University, Pittsburgh, PA.
Koziolek, H., Domis, D., Goldschmidt, T., Vorst, P., and
Weiss, R. J. (2012). MORPHOSIS: A Lightweight
Method Facilitating Sustainable Software Architec-
tures. In 2012 Joint Working IEEE/IFIP Conference
on Software Architecture and European Conference
on Software Architecture, pages 253–257. IEEE.
ENASE 2020 - 15th International Conference on Evaluation of Novel Approaches to Software Engineering
214

Newman, S. (2015). Building Microservices: Designing
Fine-Grained Systems. O’Reilly Media, Sebastopol,
CA, USA, 1st edition.
Ostberg, J.-P. and Wagner, S. (2014). On Automati-
cally Collectable Metrics for Software Maintainabil-
ity Evaluation. In 2014 Joint Conference of the In-
ternational Workshop on Software Measurement and
the International Conference on Software Process and
Product Measurement, pages 32–37. IEEE.
Papazoglou, M. (2003). Service-oriented computing: con-
cepts, characteristics and directions. In Proceedings
of the 4th International Conference on Web Informa-
tion Systems Engineering (WISE’03), page 10, Rome,
Italy. IEEE Comput. Soc.
Rajlich, V. (2018). Five recommendations for software
evolvability. Journal of Software: Evolution and Pro-
cess, 30(9):e1949.
Rostami, K., Stammel, J., Heinrich, R., and Reussner, R.
(2015). Architecture-based Assessment and Planning
of Change Requests. In Proceedings of the 11th In-
ternational ACM SIGSOFT Conference on Quality of
Software Architectures - QoSA ’15, pages 21–30, New
York, New York, USA. ACM Press.
Rowe, D., Leaney, J., and Lowe, D. (1998). Defining sys-
tems architecture evolvability - a taxonomy of change.
In International Conference on the Engineering of
Computer-Based Systems, pages 45–52. IEEE.
Sabir, B., Perveen, N., Qamar, U., and Muzaffar, A. W.
(2018). Impact Analysis on Evolution Patterns of Ser-
vice Oriented Systems. In International Conference
on Engineering, Computing & Information Technol-
ogy (ICECIT 2017), pages 61–67.
Wang, S., Higashino, W. A., Hayes, M., and Capretz,
M. A. M. (2014). Service Evolution Patterns. In
2014 IEEE International Conference on Web Services,
pages 201–208. IEEE.
Wang, Y., Yang, J., and Zhao, W. (2010). Change im-
pact analysis for service based business processes.
In 2010 IEEE International Conference on Service-
Oriented Computing and Applications (SOCA), pages
1–8. IEEE.
Williams, B. J. and Carver, J. C. (2010). Characterizing
software architecture changes: A systematic review.
Information and Software Technology, 52(1):31–51.
Woods, E. (2011). Industrial Architectural Assessment Us-
ing TARA. In 2011 Ninth Working IEEE/IFIP Con-
ference on Software Architecture, number November,
pages 56–65. IEEE.
Scenario-based Evolvability Analysis of Service-oriented Systems: A Lightweight and Tool-supported Method
215
