
Prototype Proposal for Profiling and Identification of TV Viewers
using Watching Patterns
Aldis Erglis
1
, Gundars Berzins
1
, Irina Arhipova
1a
, Artis Alksnis
2
and Evija Ansonska
1
1
Faculty of Business, Management and Economics, University of Latvia, Aspazijas Boulevard 5, Riga, LV-1050, Latvia
2
Department of Mathematics, University of Latvia, Jelgavas street 3, Riga, LV- 1004, Latvia
Keywords: Clustering, Recommender, Social Profiles, Virtual Users.
Abstract: Content based recommendation systems have widely been used for recommendations in ecommerce and in
TV content recommendations for a long period of time. Such recommendation systems could help multimedia
content providers separate content on individual level of TV viewers and offer better advertising options for
media agencies and advertisers. One of the greatest challenges for providing individual TV content is
identification of distinct TV viewers in household and link them with social economic and demographic
metrics individually. From a technical point of view Machine Learning ensemble model should be created
with several separate models for each need. In this study a prototype for a content-based recommendation
system was created that can fulfil content targeting and watched content efficiency using real time watching
data. The solution prototype covers all important parts of the model including data filtering, cleaning and
transformation. The technical prototype allows to test efficiency of Machine Learning techniques used for
prediction of household composition and social profiles assigned to an individual inhabitant of the household.
1 INTRODUCTION
Due to the rapid development of TV services and the
increasing popularity of video content, members of
one household often have difficulty in finding and
choosing the most appropriate content, as well as
negotiating what to watch on what device. At the
same time, interactive TV offers the viewer the option
of choosing the content viewer want and viewing it
anytime and anywhere, consciously avoiding stale
content, such as inappropriate or uninteresting ads.
Tet Ltd. is the leading technology and
entertainment company in Latvia, offering interactive
TV, video on demand, and optic Internet services to
private customers as well as innovative technological
and big data-based solutions to business. The
interactive TV operates with a brand Helio TV and
offers more than 100 TV channels, as well as top
Latvia and worldwide movies and TV series, which
viewers are watching on TV and smart devices. To
offer personalized TV content and targeted ads, the
company cooperates with universities and scientific
institutes.
a
https://orcid.org/0000-0003-1036-2024
In order to help users (viewers) easily find the TV
content that really interests them, as well as to adapt
relevant advertising (Tet ads and advertisers), it is
necessary to develop a real-time Tet viewer profiling
and matching content targeting tool (Gomez-Uribe
and Hunt, 2015).
The main challenge in developing the TV
recommendations (advertising) system is to identify
individual users who are viewing TV content in the
household. Since the recommendations (advertising)
made for standard devices (TV sets, computers,
tablets, or mobile phones), which include viewing
habits of two or more different users, may not match
any of the user's interests. Consequently, the use of
multiple devices of one TV subscriber used by
different users creates a variety of personalized
requirements, providing different content at a time.
The study aims to identify individual groups of
TV service subscribers (households) and users of
standard equipment by a personal profile or a
lifestyle. In order to achieve the objective of the
study, we are proposing three tasks (Veras et al.,
2015).
Erglis, A., Berzins, G., Arhipova, I., Alksnis, A. and Ansonska, E.
Prototype Proposal for Profiling and Identification of TV Viewers using Watching Patterns.
DOI: 10.5220/0009458805710578
In Proceedings of the 22nd International Conference on Enterprise Information Systems (ICEIS 2020) - Volume 1, pages 571-578
ISBN: 978-989-758-423-7
Copyright
c
2020 by SCITEPRESS – Science and Technology Publications, Lda. All rights reserved
571
The first task is to identify different groups of
households based on TV viewing patterns, using
viewing time (daily, working, and holiday) and genre
criteria:
Determine the proportion of households of
different groups.
Determine the TV viewing pattern time and
genre meta-data.
The second task is to detect TV service respondent
groups by a personality profile or a lifestyle (D'Mello
and Kory, 2015):
Survey 1 (small quota) and Survey 2 (large
quota).
Grouping of respondents based on a personal
profile or lifestyle responses (cluster analysis).
Description of respondent groups by a personal
profile or a lifestyle.
The third task is to identify groups of individual
anonymous users of TV service subscribers
(households):
Identify individual anonymous users of
subscribers (households) for each household.
Combine individual anonymous users into
homogenous groups following TV viewing
patterns.
2 SOCIAL ECONOMIC
PROFILES OF THE TV
VIEWERS AND THEIR
WATCHING PATTERNS
To build a prediction model and the solution
prototype for prediction, what kind of viewer with
what interests and lifestyle will watch what content
and when, we used real viewing data to extract
viewing patterns and group them in viewing profiles
– groups. We are using the Tet Helio viewing data set
for the period from 01/03/2019 – 31/10/2019 to
perform the study and to train the prediction model.
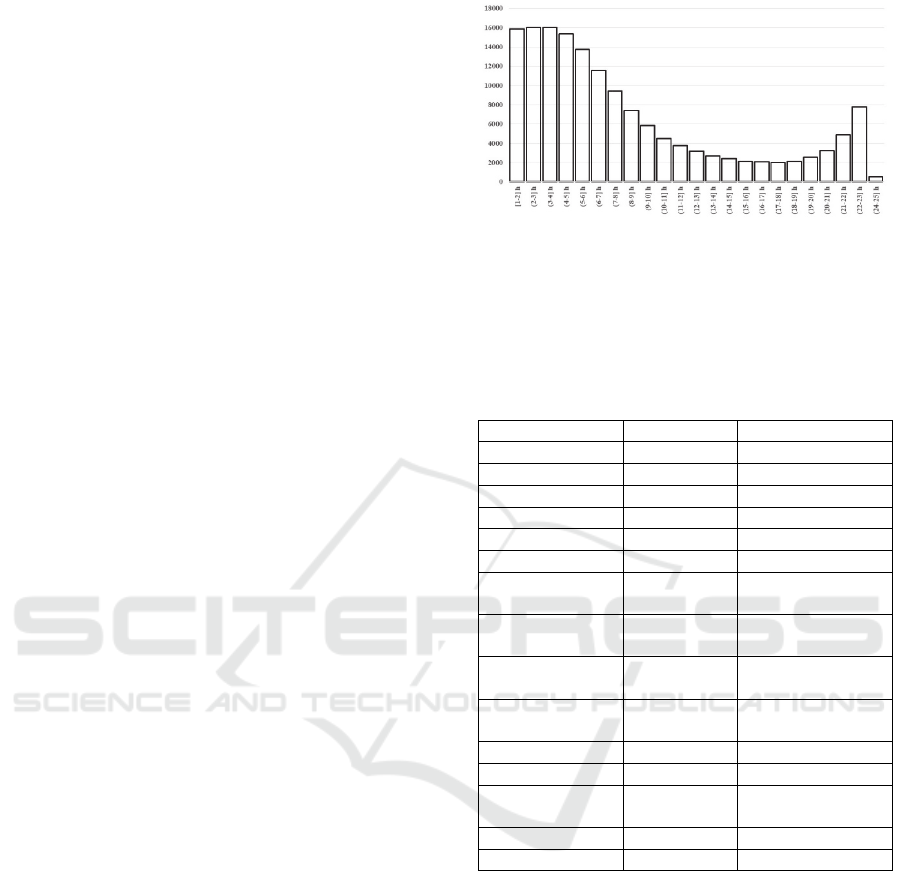
The average daily viewing time per decoder
indicates not only how actual subscribers watch TV
but also indicates the quality of exit data.
Often, the distribution of viewing times can
directly indicate whether the data is correct and
whether they can be used without additional
processing and special data cleaning to create a
forecasting model. In this case, the distribution of
viewing times looks intuitively correct (Fig. 1).
In this research, all decoders have been excluded
with a viewing duration of more than 16 hours a day
on average.
Figure 1: The number of household distribution depending
on daily average viewing length in hour per one TV
decoder.
Table 1 shows the fields, that are used from the
Tet data source during the study.
Table 1: Used data structure for real time viewing data.
Column name Data Type Description
ID Number Record ID
Account Text Account ID
TV Subtype Text Viewing Type
Decoder Text Decoder ID
Channel Text Channel Name
Title Text Program Name
Genre L1 Text Genre Level 1
classificatory
Genre L2 Text Genre Level 2
classificatory
Genre L3 Text Genre Level 3
classificatory
StartTime Datetime Viewing start
time
EndTime Datetime Viewing end time
Viewing Length Number Viewing duration
GenreNew Text Genre
classificatory
Month Number Month number
ChannelNr Number Channel Number
For building viewing patterns based on viewing
genres, a blended genre classificatory created using
Level 1, Level 2, and Level 3 genres. For a more
straightforward interpretation of viewing patterns,
114 genre combinations mapped to 41 business
genres classificatory.
If real-time viewing data used for identifying
viewing patterns, then a survey conducted to collect
data about interests, the lifestyle of individual
members of a household.
The data about a sample of households with
31 000 individual members was collected using an
identifiable survey (Fig. 2).
ICEIS 2020 - 22nd International Conference on Enterprise Information Systems
572
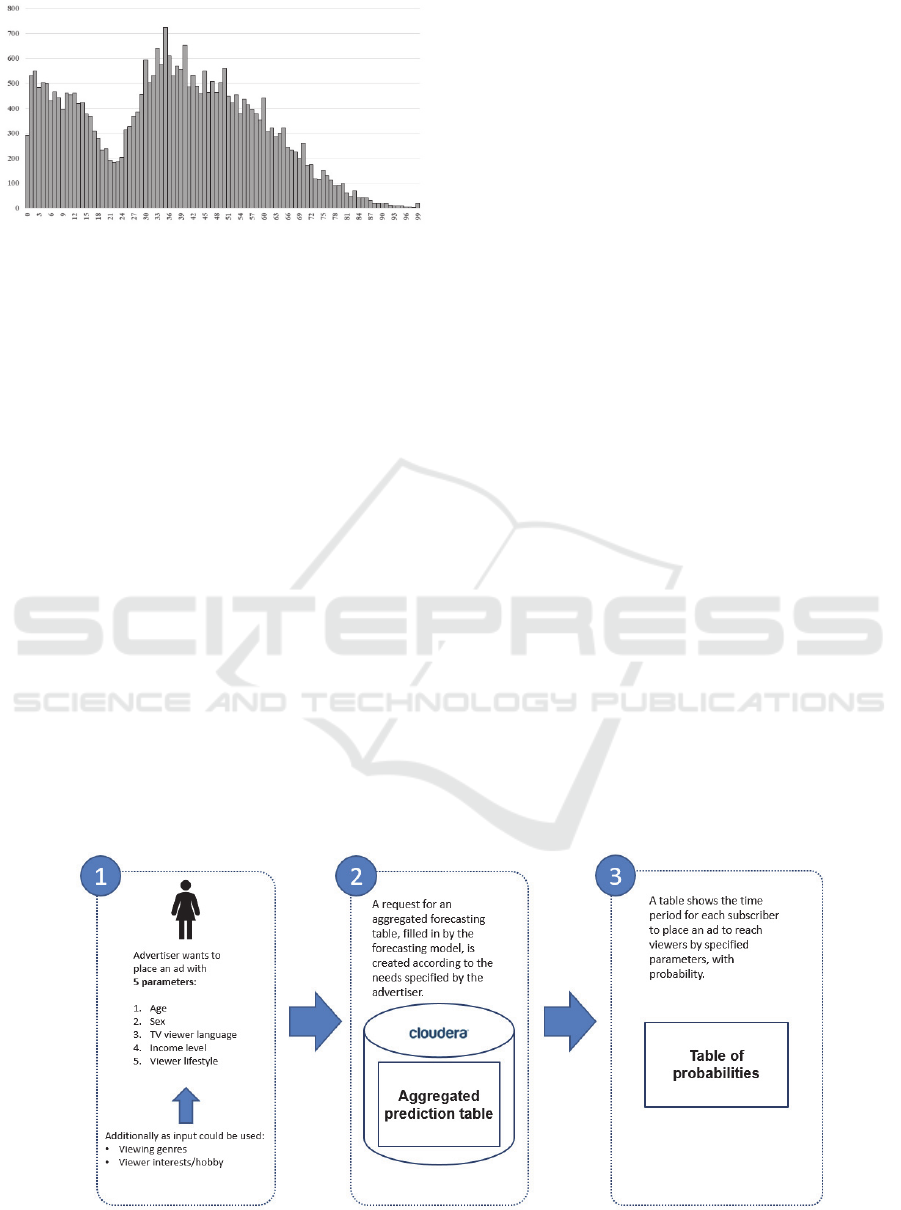
Figure 2: Individual household member distribution by age
in years.
Data collected about households and individual
users allow to link households real-time viewing data
with households participated in the survey; therefore,
the link viewing patterns with data is also available in
the survey about lifestyle.
For example, it is possible to build a model for
household age and sex composition, knowing the
number of individual members and their demographic
data from the survey.
Also, interests, like classical music, pop music,
food, restaurants, sport, fine art, photography, home,
garden, animals, travel, outdoor activities, literature,
fashion, science, health, education, beauty,
spirituality, business, politics are collecting in the
survey for every individual household member
(Vyncke, 2002).
3 PREDICTIVE MODEL
PROTOTYPES FOR
PROFILING AND
IDENTIFICATION OF TV
VIEWERS
During the study, a functional technical prototype
created that provides the prediction of viewing
content by viewing profiles. The prediction solution
prototype provides the results based on the input
parameters and existing current viewing data up to
one-minute accuracy (Fig. 3).
The solution conceptual architecture consists of
three steps that correspond to the way the algorithm
can be applied. Given that the practical purpose of the
solution is to be able to predict the TV subscriber
profile, it is necessary to specify specific input
parameters.
The following input parameters used to operate
the particular model: age, gender, TV viewer
language, income level, viewer lifestyle, genres,
viewer interests, or hobby. After specifying these
parameters in a previously stored and generated table,
select these parameters and return the subscriber
identifier and the period corresponding to the input
parameters specified, resulting directly from the
subscribers with a certain probability to watch TV
during these periods.
The predictive algorithm result table contains
information on the probability with which the
following values apply to a subscriber during a
specified viewing period: gender, age, genre, interest,
income, viewing language. Information from the
result table is used for calculation of age and gender
group for each viewing period (Fig. 4).
Figure 3: Prototype solution conceptual diagram.
Prototype Proposal for Profiling and Identification of TV Viewers using Watching Patterns
573
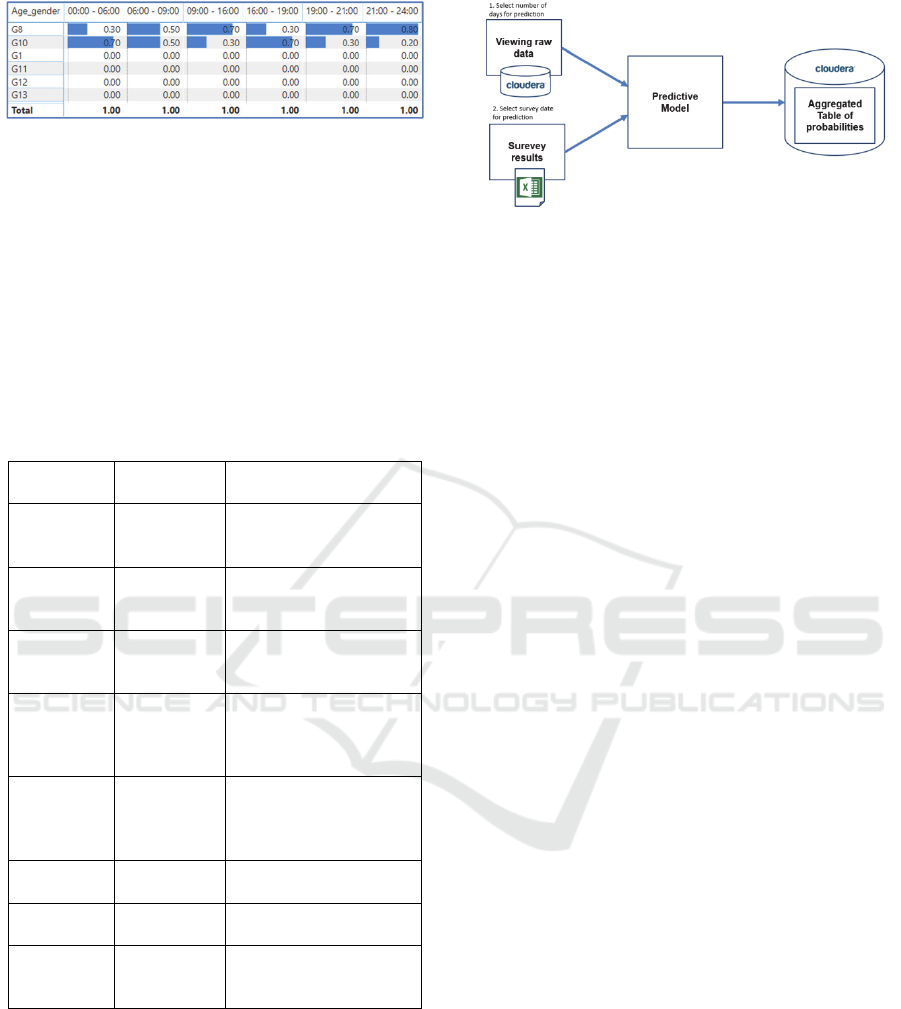
Figure 4: Results example for probability of age and gender
group for account.
The results aggregated in a way that makes it
easier to process with automatic features by
performing the necessary SQL queries after Table 2
stored in the database.
In this way, the results can be used in automated
scenarios and easily integrated with different IT
systems. Also, the results may be produced in several
versions or stored in more than one version if
necessary.
Table 2: Result table structure description.
Column
name
Value
description
Description
ID Unique
identifier of
household
Unique household
identifier from
Realtime viewing data
Sub_Period Viewing
period
Value used from survey
viewing period
classifier
Genre Genre Could be used 7 and 41
genre combination
classifiers
G1-G16 Age and
gender
combination
Combination of age and
gender divided in 16
groups F14,
M14…F65, M65
BF1 – BF5 Big Five
classifier
Represent lifestyle
classification using Big
Five methodology
(Goldberg, 1993)
I1 – I29 Classifier of
interests
Classifier from survey
L1 – L6 Language
classifier
Classifier from survey
IN1 – IN16 Classifier of
income
level
Classifier from survey
The prototype consists of several technological
components and steps that can be varied and executed
depending on needs. The prototype executed step by
step, or it is possible to automate individual or all
steps. Initially, we recommend that the prototype is
operated step by step, with verification of entry and
exit data in each step—real viewing data from the
Helio TV database (Fig. 5).
Figure 5: Solution prototype logical model.
A large part of the data used in the prototype uses
CSV files as data sources for reading and writing
operations. These tables can be transferred to one of
the popular database management systems, thereby
avoiding data retention in files and enabling the
overall model to be reduced by accelerating data
retention and reading.
4 PREPARATION OF
PREDICTIVE MODEL
LOGICAL DESIGN FOR
IDENTIFICATION AND
PROFILING OF TV VIEWERS
A combined set of models – ensemble approach was
selected for the design of the predictive model, which
includes a set of model ensemble and technical data
processing operations. The model consists of three
blocks: identification of virtual users, a grouping of
virtual users, and connecting to social profiles,
predictive model for creating aggregated predictions
(Fig. 6).
Questionnaire data plays a crucial role in the
development of viewing profiles, so the original
model is trained directly on the second large survey,
which contains a sample of households with 31 000
individual viewers training set. The questionnaire
data used to create social viewing profiles, so a new
questionnaire data can be used to retrain the model in
the future (Adomavicius and Tuzhilin, 2015).
The sequence of steps for model training and
execution consists of the following steps:
Viewing data selection from Data Lake.
Data processing and preparations for
identification of virtual users.
Identification of virtual users for households
with one inhabitant.
ICEIS 2020 - 22nd International Conference on Enterprise Information Systems
574
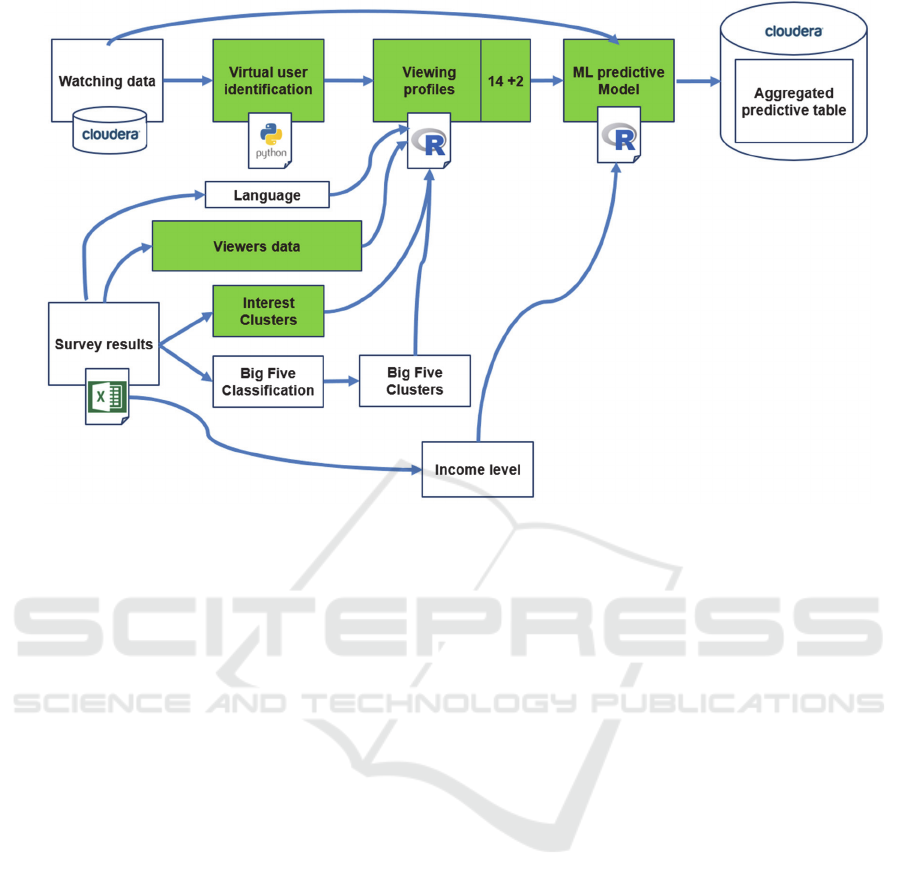
Figure 6: Logical architecture of predictive model.
Results of identified virtual users for
households with one inhabitant.
Linking with the data from survey for
households with one inhabitant.
Matching of two and more resident household
virtual users with the probability coefficient to
household residents using virtual users of the
relevant sex and age representative from the
households of one inhabitant. This step should
be taken separately - for age group and for
gender, for each interest and for each Big Five
- year factor.
Creating a probability/distribution matrix by
gender and age group, by period and genre, by
each interest per period and genre, and by each
Big Five-factor by period and genre.
Data processing for prediction of household
composition.
Household compositions (gender and age
group, interest and Big Five), income and
language of the data set of the predicting
model. In total one gender and age group plus
29 groups for each interest, plus 5 groups for
each Big Five - year factor, plus one language
group, plus one income groups, altogether 37
groups in addition to columns that will be as
output for 37 classification models.
Training and testing data sets creation for all
models.
Selecting classification model (xgboost,
random forest, gradient boost, logistic
regression, SVM).
Model training.
Model validation (repeat step “Selecting
classification model” if required) and
comparison with different models, if different
models are selected.
Creating an interim table.
Result table of aggregated prediction data.
4.1 Identification of Virtual Users
The “Virtual console” algorithm relies on identifying
virtual users – individual TV viewers using household
viewing data (Fig. 7). Virtual users are determined by
an algorithm that performs viewing grouping for one
user on a single day after specific viewing periods and
genres (Wang and He, 2016).
This way, as many virtual users can be identified
for each subscriber as there are periods, because the
algorithm tries to find viewing relationships directly
within one period.
The identification of virtual users based on a
three-dimensional tensor that used to get a different
viewing behaviour for each subscriber during each of
the periods.
Prototype Proposal for Profiling and Identification of TV Viewers using Watching Patterns
575
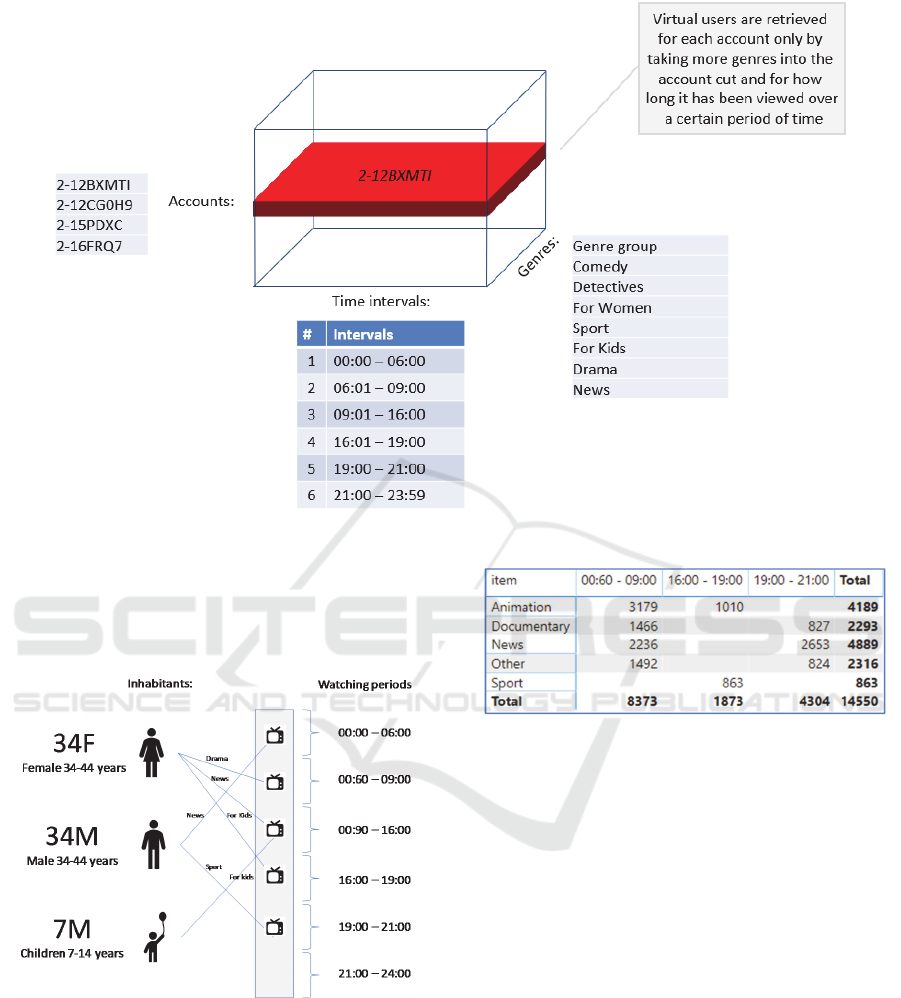
Figure 7: Identification of virtual users.
That allows us to identify virtual users in each of
the viewing periods. Later, these results used to map
and link viewing profiles to questionnaire data and
used in a forecasting model (Fig. 8).
Figure 8: Conceptual division of TV viewers by watching
periods.
Identification of virtual users on a prototype level
works as an intermediate solution where using an
input data aggregated from real time viewing data
generates a result table with virtual users (Fig. 9).
Figure 9: Input data for each user consists of viewing time
of item (genre) in period.
The virtual user result table is used in the steps of
operating the algorithm. The result tables description
is the following:
Account is a unique identifier of the subscriber
along with the decoding identifier, as one
subscriber may have multiple decoders, virtual
users are identified for each combination of the
subscriber-decoder.
Item is genre.
Sub_period is ID of viewing period, for
example 1 it is 0:00 – 6:00.
Day is the date for which the viewing data is
aggregated (may be used for several days), but
virtual users are calculated daily separately.
Duration is viewing duration in minutes.
User is Virtual User Order Number (maximum
number of virtual users per subscriber equals
the number of periods).
ICEIS 2020 - 22nd International Conference on Enterprise Information Systems
576

Day is the date for which the viewing data is
aggregated (may be used for several days), but
virtual users are calculated daily separately.
Using virtual user result table possible to create
profiles of the virtual users for the account (Fig. 10).
Algorithm for identification of virtual users done in
Python and using following libraries: Pandas,
Networkx, Math, Os, Itertools.
Figure 10: Virtual user results example for account.
4.2 Viewer Profile Identification
A breakdown table is created for each of the
predictable groups for each period and genre. Virtual
users previously acquired are used to get distribution
- virtual users from daily real viewing data created for
each household.
In a single-inhabitant household, each of the
virtual users of that household assigned to the group
(gender and age, interest, or big-five factors) to which
the household inhabitant belongs (Masthoff, 2015). In
households with two or more inhabitants, each of the
households shall be arranged with a specified
membership ratio for each of the virtual users of that
household.
The ownership ratio is calculated by comparing
each virtual user of a household with the virtual users
of each group belonging to each household resident
from the households of the same inhabitant. A
measure of cosine similarity used to compare two
virtual users. The measure of cosine similarity, in this
case, assumes values from 0 to 1, where 0 is virtual
users that are entirely different and one where a
virtual user is quite similar (1)
(1)
The household inhabitant ownership of each of
the household virtual users chosen to have the most
significant correlation factor with the corresponding
virtual users of the same household group of the same
inhabitant. As a result, the table obtained where a
virtual user of each household has a degree of
affiliation with each household inhabitant and,
respectively, the group to which that inhabitant
belongs (Table 3).
Table 3: Household ID 2-L4A-440 user ownership level on
21.09.2019.
User Sub_
period_
1
Animation
Sub_
period
_6
News
Age_
gender_
group
Max_
cos_
similarity
User 1 1 2 G44-F 0.45
User 1 1 2 G44-M 1
User 2 0 1 G44-F 0.28
User 2 0 1 G44-M 0.45
The virtual user table is aggregated and grouped
by period, genre, and group. The percentage is then
standardized for the period and genre, getting each
group split for each combination of period and genre
(Table 4).
Table 4: Distribution of viewing periods and genres by age
and gender.
Age/gender
group
Sub_period_1
Animation
Sub_period_6
News
G07-F 14% … 1%
G07-M 14% … 1%
G14-F 17% … 1%
G14-M 18% … 1%
G24-F 7% … 3%
G24-M 9% … 3%
G34-F 3% … 5%
G34-M 4% … 5%
G44-F 1% … 9%
G44-M 3% … 6%
G54-F 2% … 9%
G54-M 2% … 13%
G64-F 2% … 14%
G64-M 2% … 13%
G65+-F 3% … 7%
G65+-M 2% … 9%
Total 100% 100%
When creating a model for predicting household
compositions, the viewing data for each household is
processed for each period, and genre of each day
(Table 5). As an additional variable, a binary
identifier is added that shows an observation on a
weekday or weekend. Description of output data in
Table 3 and Table 5 is the following:
User is a virtual username for that account on a
relevant day.
Sub_period_1_Animation is the total viewing
time for genre Animation in the time period
00:00 – 06:00.
Prototype Proposal for Profiling and Identification of TV Viewers using Watching Patterns
577

Sub_period_6_News is the total viewing time
for genre News in the time period
21:00 – 00:00.
Weekday classification: 1 for weekday and
0 for weekend.
Age_Gender_Group is a household
composition by age and gender.
Max_cos_similarity is the largest coefficient of
similarity with virtual users of the same
household of the same inhabitant of the age and
sex group.
Day is viewing day.
Table 5: Household ID 2-L4A-440 viewing data.
Day Sub_
period_
1_
Animation
Sub_
period_
6_
News
Week
days
Age_
gender_
group
21.09.
2019.
0 2.1 0
G44-F*
G44-M
22.09.
2019.
1.3 2.9 0
G44-F*
G44-M
23.09.
2019.
0 1 1
G44-F*
G44-M
24.09.
2019.
0 0 1
G44-F*
G44-M
5 CONCLUSIONS
The quality of the predictive model is significantly
affected by the quality of the viewing data, which
means that it is essential to carry out data quality
checks and to produce data in line with the needs of
the predictive model.
It would be necessary to establish/implement
monitoring tools to operate the prototype in the
production environment, which would allow the
correct execution of the model during training and
predictive operation.
Suggestions for model quality maintenance
include the following: the prototype validation can be
done by testing against the composition of household
inhabitants. This way, the accuracy of the prototype
can be checked by forecasting the composition of
household inhabitants using a test data set that not
used to train the model. Such a test data set may be
obtained by repeated questionnaires or by obtaining
data on the actual composition of household
inhabitants in any other way.
The prototype can be supplemented with
automated error handling and checksum verification
mechanisms in each of the model execution steps,
which will allow checking the identification of the
model's performance and input data quality level.
Assess how quickly the full training cycle of the
prototype achieved and how long each of the model
training steps performed. This information will be
essential for developing a product solution and
measuring individual components of the solution or
optimizing the speed of data loading.
Given that prototype components have been
created using open-source libraries and programming
languages, it is essential to develop a scalable
architecture for a prototype production version and to
deploy extensive data and analysis platforms at the
disposal of Tet.
ACKNOWLEDGEMENTS
The research leading to these results has received
funding from the research project "Development of a
solution for multi-factorial television real-time
audience profiling and responsive ads targeting" of
EU Structural funds, contract No. 1.1.1.1/18/A/127
signed between SIA “Tet” and Central Finance and
Contracting Agency.
REFERENCES
Adomavicius, G., Tuzhilin, A., 2015. Context-Aware
Recommender Systems, in Recommender Systems
Handbook. Springer, Boston, MA, pp. 191–226.
D'Mello, S. K., Kory, J., 2015. A review and meta-analysis
of multimodal affect detection systems. ACM
Computing Surveys (CSUR), 47(3), 43.
Goldberg, L. R., 1993. The structure of phenotypic
personality traits. American psychologist, 48(1), 26.
Gomez-Uribe, C. A., Hunt, N., 2015. The Netflix
Recommender System: Algorithms, Business Value,
and Innovation, ACM Trans. Manage. Inf. Syst., vol. 6,
no. 4, pp. 13:1–13:19.
Masthoff, J., 2015. Group Recommender Systems:
Aggregation, Satisfaction and Group Attributes, in
Recommender Systems Handbook. Springer, Boston,
MA, pp. 743–776.
Veras, D., Prota, T., Pereira, A., Prudencio, R., and Ferraz,
C., 2015, A literature review of recommender systems
in the television domain, Expert Systems with
Applications, vol. 42, no. 22, pp. 9046–9076.
Vyncke, P., 2002. Lifestyle segmentation: From attitudes,
interests and opinions, to values, aesthetic styles, life
visions and media preferences. European journal of
communication, 17(4), pp. 445-463.
Wang, Z., He, L., 2016. User identification for enhancing
IP-TV recommendation. Knowledge-Based Systems 98,
pp. 68-75.
ICEIS 2020 - 22nd International Conference on Enterprise Information Systems
578
