
Analysis of Co-authorship Network and the Correlation between
Academic Performance and Social Network Measures
Qianwen Xu
1
and Victor Chang
2
1
Business Analytics, Xi'an Jiaotong-Liverpool University, Suzhou, China
2
School of Computing, Engineering and Digital Technologies, Teesside University, Middlesbrough, U.K.
Keywords: Co-authorship Network, Academic Performance, Social Network Analysis, Spearman Correlation Test.
Abstract: This project conducted link analysis and graph cluster analysis to analyze the co-authorship network of 166
researchers, mainly from three top universities in Shanghai, China. The publication data of researchers in the
area of social science between 2014 and 2016 were collected from Scopus, and the g index was calculated as
their performance indicator. For this project, the centrality measures, the efficiency of the egocentric network
were calculated as well as authorities and hubs were identified in the link analysis. In addition, clustering
algorithms based on betweenness centrality were used to conduct the graph cluster analysis. Finally, in order
to identify productive researchers, this project employed the Spearman correlation test to analyze the
correlation between a researcher's performance and social network measures. Results from this test indicate
that except for closeness centrality and degree centrality, the correlation between g-index and betweenness
centrality, eigenvector centrality and efficiency is significant.
1 INTRODUCTION AND
PROJECT AIM
Nowadays, the performance of organizations and
individuals is usually evaluated for the purpose of
management. In the area of academia, researchers are
appraised by assessing their academic performance in
terms of teaching evaluations, research production
and other indicators. Evaluating a researcher's
academic performance is essential as the evaluation
results can be used not only for recruitment and
allocation of funding but also for gaining a high
reputation because of having productive researchers
(Abbasi et al., 2012). However, it is not easy to
identify, cluster and configure productive researchers
to optimize research synergies. In order to address
this question, this project calculated the g index as the
measure of researchers' academic performance and
employing link analysis and graph cluster analysis to
analyze the co-authorship network. Finally, this
project applied a Spearman correlation test to
evaluate the correlation between the researchers'
academic performance and their centrality in the co-
authorship network and the efficiency of their
egocentric network. This paper chooses the Chinese
scholars because although there are numerous studies
on the co-authorship network in China at present, the
papers on the microscopic of the network are little.
The majority of the papers focus on the level of the
nation or a province rather than a city or a
university(Andersson et al., 2014). Fudan University,
Shanghai Jiaotong University and Tongji University
are chosen to be studied in this paper as they are the
top three universities and members of the 985UNIs in
one city, Shanghai. 985UNIs represent the top-level
of the pyramid in China’s higher education system,
their collaboration relationship is close and the data is
sufficient for study(Wang et al., 2014)
2 LITERATURE REVIEW AND
PROPOSED METHODS
2.1 Literature Review
A social network is a set of nodes or actors that are
connected to each other through some kind of
relationship, such as family members, cooperation
between companies and so on. There are usually two
types of social networks, which are socio-centric and
egocentric(Chung et al., 2005). With the development
of social networks, the social network analysis has
Xu, Q. and Chang, V.
Analysis of Co-authorship Network and the Correlation between Academic Performance and Social Network Measures.
DOI: 10.5220/0009428503590366
In Proceedings of the 5th International Conference on Internet of Things, Big Data and Security (IoTBDS 2020), pages 359-366
ISBN: 978-989-758-426-8
Copyright
c
2020 by SCITEPRESS – Science and Technology Publications, Lda. All rights reserved
359

applied in many topics, such as natural resource
management(Prell et al., 2009), classroom social
interactions(Martı
́
nez et al., 2003), economic
geography(Ter Wal & Boschma, 2009) and so on. In
the area of academic area, the social network of an
author or a researcher can be an indicator of his co-
authorship with other researchers. Liu et al. (2006)
examine the state of the digital library domain by
analyzing the co-authorship network of the past
ACM, IEEE, and joint ACM/IEEE digital library
conferences. At the same time, Newman learned the
pattern of scientific collaboration from a co-
authorship network (Newman, 2004). In addition,
Morel et al. (2009) found that co-authorship analysis
is a great tool to support the strategic planning of
research on neglected diseases.
2.2 Proposed Methods
In this project, the co-authorship network will be
analyzed by employing link analysis and graph
cluster analysis and a Spearman correlation test will
be conducted to learn the correlation between
academic performance and social network analysis
measures so that a productive researcher can be
identified. From the aspect of link analysis and
Spearman correlation test, the methods this paper will
employ refer to Abbasi et al.'s (2011,2012) in their
research. However, this paper extends their work by
applying the HITS algorithm (Kleinberg, 1998) to
identify the authority and hub of the network. In
addition, a graph cluster analysis based on two types
of betweenness algorithms will be employed. All of
these different analyses and algorithms help us to
make a better understanding of the microscopic of the
co-authorship network in China.
For link analysis, four measures of centrality will be
calculated. According to Freeman(1978), the
centrality of a node impacts leadership, satisfaction
and efficiency significantly. And the performance of
a node is impacted by betweenness centrality and
degree centrality particularly. The centrality
measures calculated in this project are degree
centrality, betweenness centrality, closeness
centrality and eigenvector centrality. The degree of a
node is the number of its adjacent nodes and it is
considered to be the measure of local centrality(Scott,
1991). Betweenness centrality(Borgatti,1995) is
another kind of centrality to measure the degree to
which a given node lies on the shortest paths
(geodesics) between other nodes in the graph.
Closeness(Freeman, 1980) is a measure of a node’s
global centrality by calculating its distance to other
nodes and eigenvector centrality(Bonacich, 1972) is
to measure a node’s centrality based on the concept
that the centrality of a node does not only depend on
the number of its adjacent nodes but also depend on
the centrality of these adjacent nodes.
Based on Burt’s s(Borgatti,1995) structural holes, this
paper also calculated the efficiency of nodes to
evaluate their relationship with authors in one group.
According to Burt, if a node has more primary
contacts from the same group, then the node will
obtain more redundant information from its primary
contacts as nodes within one group usually share the
same information. Therefore, a node’s network is
more efficient if it has a strong relationship with just
one node of a group rather than all authors within the
same group.
Additionally, this project employed Kleinberg’s
(1998) HITS algorithm to identify the authority and
hub of the network. A node is considered as an
authority if it has many pages linking to it and it is
considered as a hub if it points to many other vertices.
After link analysis, this project used two clustering
algorithms based on betweenness centrality to
conduct the graph cluster analysis. The result of the
two algorithms will be compared.
In order to learn how to identify the productive
researchers from their social network measures, the
significance of the relationship between four
centrality measures, efficiency and author's
performance will be evaluated by the Spearman
correlation test(Abbasi et al., 2011). Spearman
correlation test is a tool to evaluate whether two
variables are related to each other
significantly(Gauthier, 2001). The researchers'
performance in this project will be quantified by
using the g index, which was introduced by Egghe
(2006)and widely used by the academic database. The
g index is calculated by ranking a researcher's papers
in decreasing order of their papers’ number of
citations and the g index is the largest number that the
accumulated number of citations the top g papers
received is not less than g2.
The hypothesis tested by Spearman correlation
analysis are as below:
H1: A researcher’s degree centrality impacts his or
her research performance;
H2: A researcher’s betweenness centrality impacts
his or her research performance;
H3: A researcher’s closeness centrality impacts his or
her research performance;
H4: A researcher’s eigenvector centrality impacts his
or her research performance;
H5: A researcher’s efficiency impacts his or her
research performance;
IoTBDS 2020 - 5th International Conference on Internet of Things, Big Data and Security
360
3 IMPLEMENTATION AND
APPLICATION
DEMONSTRATION
3.1 Data Collection and Management
For this project, data of scholars in three top
universities of Shanghai, China, was collected from
the website of Scopus. These three universities are
Fudan University, Shanghai Jiaotong University and
Tongji University. The bibliographic data used in this
project is in the area of social science and about 166
authors’ publication information from 2014 to 2016.
The publication information includes authors’ names,
ID, affiliations, number of publications and number
of citations per paper.
Based on the available published information of
authors, two datasets were built. One is information
about data, including authors' names which are not
full name in consideration of privacy issues, and their
affiliations, number of publications, the total number
of citations by other writers and their g index. The
other dataset contains connections between authors
based on whether there are co-author relationships
between them and the number of cooperation was
assigned to the attribute "weight". Due to the whole
datasets cannot be shown in this paper fully.
Therefore, only a part of the two datasets is selected
randomly and is shown in Table 1 and Table 2.
Table 1: Authors.
Author Affiliation Country
No. of
Publication
Cited
b
y
G-
I
Wang L
Fudan
Universit
y
China 15 60 7
Li C
Fudan
Universit
y
China 3 10 3
Zhang
Y-FD
Fudan
Universit
y
China 4 28 4
Table 2: Co-authorships.
Author 1 Author 2 Weight
Chu N Li D 2
Chu N Gober H -J 2
Chu N Qiu X 2
Harder M K Burford G 2
3.2 Implementation
After preparing the datasets for social network
analysis, this paper used Rstudio and Ucinet (Borgatti
et al., 2002) as tools for visualizing the network and
for calculating the network measures in order to carry
out the later analysis.
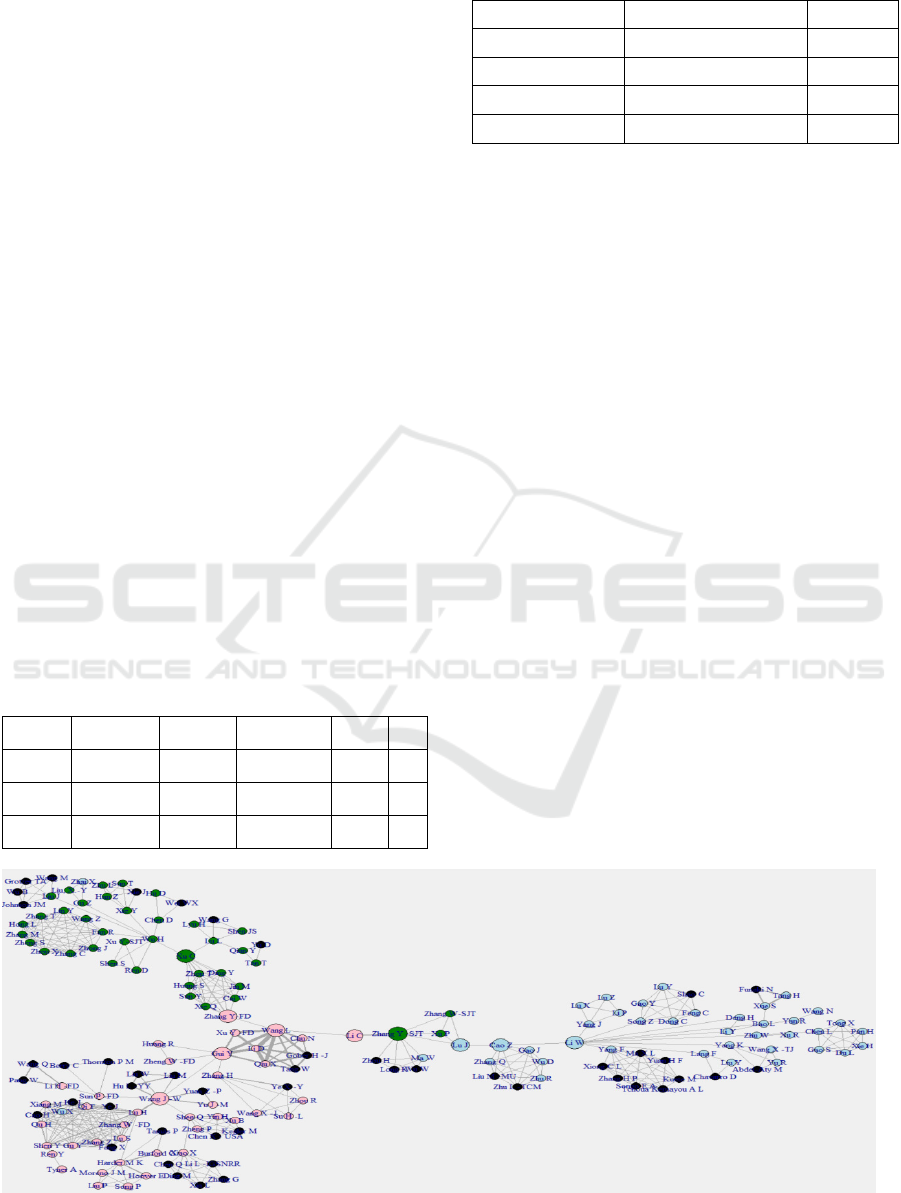
First of all, this paper visualized the co-authorship
network through a graph. The nodes of the graph
represent authors. A link between nodes represents a
cooperation relationship between authors and the
width of a link represents the weight of a link,
denoting the number of publications that two authors
cooperated. Fig.1 shows the co-authorship network of
this project.
In this co-authorship network, the green nodes
represent the authors from Shanghai Jiaotong
University, the light blue nodes represent the authors
from Tongji University, the pink nodes represent the
authors from Fudan University while black nodes
were assigned to the authors from other universities.
Before detailed analysis, it can be seen from Fig.1 that
the co-authorship network can be divided into three
groups by university, which is the left upper one, left
lower one and the right side one. And the pink group
which represents the Fudan University, have more
cooperative relationships with organizations outside
the university. Furthermore, the nodes with bigger
sizes seem to play important roles in forming this
network.
Figure 1: Co-authorship network.
Analysis of Co-authorship Network and the Correlation between Academic Performance and Social Network Measures
361

Secondly, link analysis was conducted. Four
centrality measures (normalized degree centrality,
normalized betweenness centrality, normalized
closeness centrality and eigenvector centrality) and
efficiency of every node in structural holes are
calculated. The results are organized and a part of
them are in Table 3 as below:
Table 3: Measures.
Auth
or
Between
ness
Closen
ess
Degr
ee
Eigenve
ctor
Efficie
ncy
Sun
T
0 0.0914
0.02
42
2.22E-07 0.25
Xie J 0 0.0914
0.02
42
2.22E-07 0.25
Zhu
L
0 0.0914
0.02
42
2.22E-07 0.25
Han
Z
0 0.0914
0.02
42
2.22E-07 0.25
Wei
WX
0 0.0912
0.01
21
2.01E-07 0.5
Moreover, the HITS algorithm was used to identify
the authority and hub in the co-authorship network.
The algorithm returns two vector columns (hub and
authority) since they are bound together. Therefore,
this paper divided them and a part of them is shown
in Table 4.
Table 4: Authority and Hub.
Author Authority Author Hub
Sun T 1.75E-09 Sun T 1.75E-09
Xie J 1.75E-09 Xie J 1.75E-09
Zhu L 1.75E-09 Zhu L 1.75E-09
Han Z 1.75E-09 Han Z 1.75E-09
Wei WX 1.44E-09 Wei WX 1.44E-09
Chen D 1.72E-08 Chen D 1.72E-08
Xie Y 1.76E-08 Xie Y 1.76E-08
Hu D 1.44E-09 Hu D 1.44E-09
Finally, graph cluster analysis was carried out. An
algorithm based on betweenness centrality was
selected and used for clustering. In the co-authorship
network, it is important for knowledge or academic
information to flow effectively, so identifying a node
or a link that plays the role of a broker is essential.
Therefore, the algorithm based on betweenness
centrality was selected. It helps to identify the vital
nodes or edges. There are two types of betweenness
can be used, which are vertex betweenness and edge
betweenness. Both of them were used in this project
and there is a little difference between the results.
4 ANALYSIS OF RESULTS AND
DISCUSSION
In this section, the results of link analysis will be
analyzed and the Spearman rank correlation test will
be conducted to test the significance of the
relationship between the five measures and the g-
index. Graph cluster analysis will be discussed to
analyze the co-authorship network as well.
4.1 Link Analysis
Among the four measures of centrality, the degree is
the simplest approach of measuring the node
centrality. In this co-authorship network, the average
degree centrality is around 0.033 and Lu H from
Fudan University has the highest degree centrality of
0.091. It means that he or she communicates more
actively than other authors, or he or she is more
prevalent among researchers.
Closeness is a measure of a node’s global centrality
by calculating its distance to other nodes. Among
these authors, their average closeness centrality is
nearly 0.081 and Wang L from Fudan University
gains the highest closeness centrality of 0.135,
meaning that his or her position in this network is the
on average the nearest position to all other authors.
Therefore, he or she is the person who can obtain
information most efficiently.
Betweenness measures the number of times that a
given node lies on the shortest paths between other
nodes in the graph. In this co-authorship network, the
average betweenness centrality is around 0.040 and
Wang L from Fudan University has the highest
betweenness centrality of 0.666. It means that he or
she plays a very important role as a broker or
gatekeeper in the network and he or she can most
frequently control knowledge diffusion among
researchers. If the node of Wang L was missing, then
the single networks of three universities will not be
linked anymore.
Eigenvector Centrality is another measure of a node's
centrality based on the concept that the centrality of a
node does not only depend on the number of its
adjacent nodes but also depends on the centrality of
these adjacent nodes. Among these authors, the
average eigenvector centrality is around 0.33 and
Wang L has the highest value of 1.0. He or She has
nine adjacent authors and more than half of his or her
adjacent authors have high centrality value as well.
From the aspect of the structural hole, efficiency is
the ratio of the total number of disjoint groups of
primary nodes of a node divided by the degree
centrality of the node. In this co-authorship network,
IoTBDS 2020 - 5th International Conference on Internet of Things, Big Data and Security
362

the average efficiency is around 0.36, and the values
of the top 10’s efficiency are greater than 0.9. The
high values indicate that these authors may focus on
a strong relationship with only one co-author of a
group of linked co-authors rather than with all co-
authors within this group and they usually have
access to different kinds of knowledge or academic
information, which will help them to innovate and
perform better than others.
In addition, the lowest value of efficiency is 0.077,
meaning that they tend to have strong relationships
with all co-authors within one group instead of with
one author of this group. In that the same knowledge
will always spread within one group, maintaining a
relationship with all authors of the same group will be
time-wasting as they always get redundant
knowledge from their primary contacts.
From the view of authority and hub, Lu H was
identified to be the authority as well as the hub of the
co-authorship network as it gained the highest value
from both aspects. This means Lu H was considered
to be authoritative and productive in the area of social
science. At the same time, he or she was also linked
to many other researchers who can be considered as
an authority as well. Therefore, Lu H was identified
to be the hub at the same time.
Considering these factors comprehensively, we can
draw a conclusion that comparatively, Wang L seems
to be the most important author in this co-authorship
network, although he was not identified to be the
authority of this network while his or her closeness,
betweenness and eigenvector centrality are the
highest. And as for the degree centrality and
efficiency, his or her value is at the top as well. For
degree centrality, his or her value is 0.055, with an
average value of 0.033 and for efficiency, his or her
value is 0.679, with an average value of 0.36.
Therefore, Wang L plays the most important role in
this network to connect authors and obtain and
transmit knowledge or academic information more
effectively and efficiently.
4.2 Graph Cluster Analysis
After the link analysis, graph cluster analysis was
carried out and two types of betweenness algorithms
were both employed, which are vertex betweenness
and edge betweenness. Fig.2 shows the result of
algorithms based on vertex betweenness and Fig.3
shows the result of algorithms based on edge
betweenness.
The results are similar as both algorithms divided the
co-authorship network into three clusters and most of
the authors from the same university were assigned to
the same cluster.
However, there is still a little difference between the
results. While Wang L is shared by three clusters by
using an algorithm based on vertex betweenness, he
or she belongs to Cluster 1 by using an algorithm
based on edge betweenness. Furthermore, Cluster 1
and Cluster 3 are divided by breaking the link
between Gui Y and Wang J-W in Fig.3 rather than
sharing Wang L, meaning that except the link with
Wang J-W, every nodes or group linked to Gui Y
belong to Cluster 1 rather than Cluster 3 as a result in
Fig.2.
In that, the clusters are divided based on betweenness
centrality and betweenness centrality measures the
number of times that a given node lies on the shortest
paths between other nodes in the graph, the results
indicate that the co-authorship among authors or
researchers from the same university are much closer
than with outside the university although there are
some cases of cooperating with other organizations.
Based on the result of the algorithm of vertex
betweenness, HITs algorithm of link analysis applied
again to identify the authority and hub for each
cluster. And Fan R was identified to be the authority
and hub for the group of Shanghai Jiaotong
University, Yang F for Tongji University and Lu H
for Fudan University.
4.3 Spearman Rank Correlation Test
In order to identify a productive researcher, a
Spearman rank correlation test was conducted to
evaluate whether the correlations between the five
measures and g-index are significant or not and the
result is shown in table 5.
The value to decide whether the correlation is
significant or not was set to be 0.01, meaning that if
the significant value is greater than 0.01, then the
correlation is not significant and if the significant
value is less than 0.01, then the correlation is
significant (Hochberg & Benjamini, 1990). From the
results above, it can be seen that the correlation
between betweenness centrality, eigenvector
centrality, efficiency and g-index is significant as
their significant value is nearly equal to 0 while the
variance in closeness centrality or degree centrality
seems to be not able to explain the variance in g-index
very well as their significant value is far greater than
0.01, which are 0.95 and 0.84 respectively. Therefore,
hypothesis H1, H3 should be rejected and H2, H4 and
H5 should be accepted. According to the coefficient,
it suggests that researchers with higher betweenness
Analysis of Co-authorship Network and the Correlation between Academic Performance and Social Network Measures
363
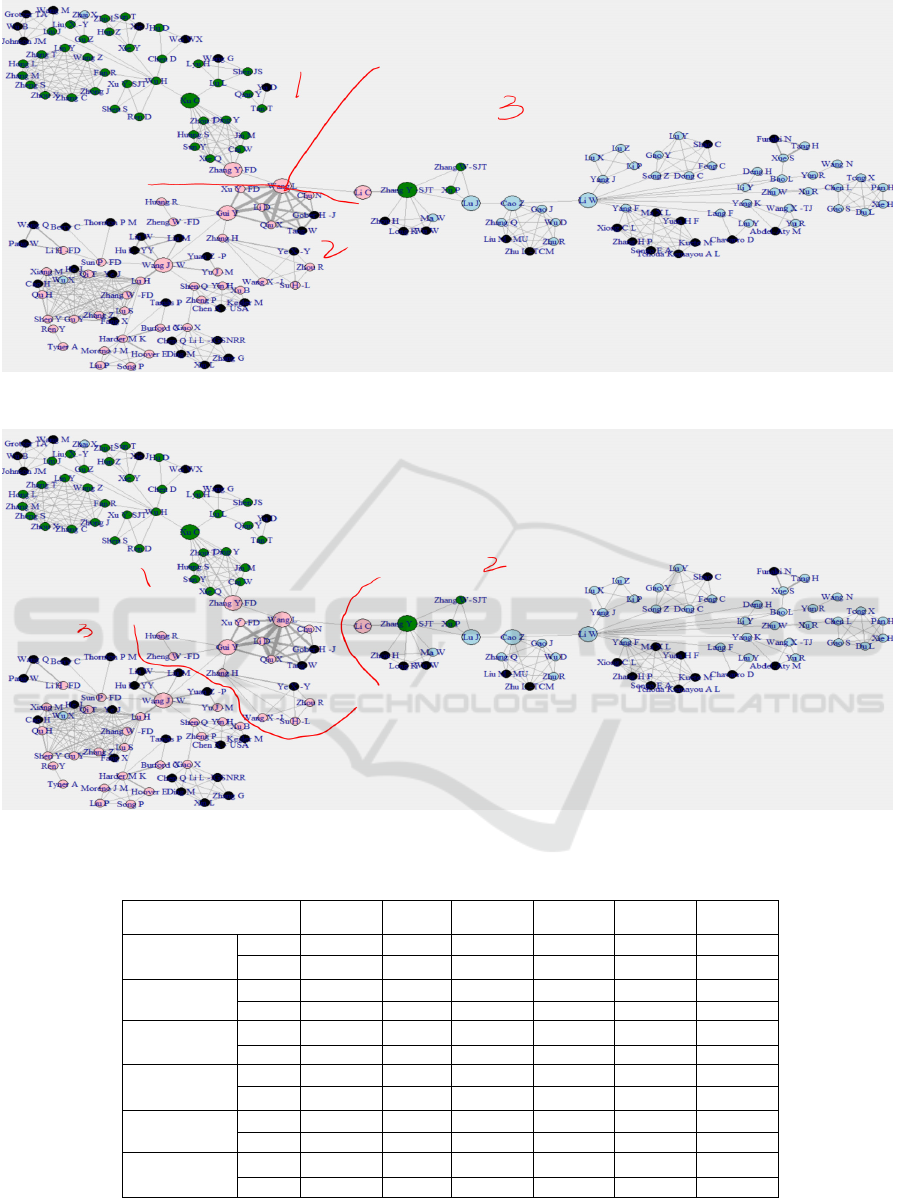
Figure 2: Co-authorship network – Vertex.Cluster.
Figure 3: Co-authorship network – Edge.Cluster.
Table 5: Spearman rank correlation test.
1 2 3 4 5 6
Betweeness
β 1.00 0.12 0.31** 0.35** 0.39** 0.46**
Sig. . 0.12 0.00 0.00 0.00 0.00
Closeness
β 0.12 1.00 0.11 0.08 0.12 0.01
Sig. 0.12 . 0.16 0.29 0.12 0.95
Degree
β 0.31** 0.11 1.00 0.25** -.63** 0.02
Sig. 0.00 0.16 . 0.00 0.00 0.84
Eigenvector
β 0.35** 0.08 0.25** 1.00 -0.02 0.28**
Sig. 0.00 0.29 0.00 . 0.81 0.00
Efficiency
β 0.39** 0.12 -.63** -0.02 1.00 0.37**
Sig. 0.00 0.12 0.00 0.81 . 0.00
G-I
β 0.46** 0.01 0.02 0.28** 0.37** 1.00
Sig. 0.00 0.95 0.84 0.00 0.00 .
**. Correlation is significant at the 0.01 level (2-tailed).
IoTBDS 2020 - 5th International Conference on Internet of Things, Big Data and Security
364

centrality, higher eigenvector centrality and
efficiency will gain a higher g index, meaning that the
researcher is more productive. The higher
betweenness means that the author or researcher who
is between the cooperation paths, which is between
other authors more frequently and he or she can most
frequently control knowledge diffusion among
researchers. They are more resourceful. The higher
eigenvector centrality indicates that the scholar has
more connections to other authors who are well-
connected as well. The higher efficiency means that
the researcher tends to conduct more collaboration
with diverse researchers from different groups instead
of all authors in the same group.
Based on the result, this paper can conclude that the
author or researcher who collaborates with diverse
authors or groups and or with other authors that are
themselves also well-connected has better academic
performance than those who do not. In addition, the
author or researcher who has strong co-authorship
with just only one author of a group instead of all
authors in the same group perform better than those
who do not.
5 CONCLUSION AND
CONTRIBUTION
5.1 Conclusion
In this project, a co-authorship network of 166
researchers, mainly from three top universities in
Shanghai, China, was analyzed by employing link
analysis and graph cluster analysis. Five social
network analysis measures, degree centrality,
betweenness centrality, closeness centrality,
eigenvector centrality and efficiency were calculated
and the algorithms of HITS and betweenness
clustering were used in the analysis. Results from the
analysis indicate that Wang L is the most important
researcher in this co-authorship network. Finally, in
order to identify productive researchers, this project
employed the Spearman correlation test to analyze the
correlation between a researcher's performance and
social network measures. Results from this test
indicate that except for closeness centrality and
degree centrality, the correlation between g-index and
betweenness centrality, eigenvector centrality and
efficiency is significant.
5.2 Implications
This paper provides the references for the related
institutions and scholars based on the analysis results.
For the related institutions, such as universities or
ministry of education, this paper shows that the co-
authorship network of a scholar is connected to its
academic performance and evaluating the network
may help them to identify, cluster and configure
productive researchers to optimize research
synergies. As for the scholars, this paper may suggest
that scholars should try to collaborate with diverse
authors frequently instead of only one author and
work with authors who are well-connected as well. In
addition, scholars should try to avoid collaborating
with many authors in the same group because this
may lead to low efficiency.
5.3 Contribution and Future Work
This paper gives a glimpse of the internal structure of
the co-authorship network in China. At present, the
majority of the papers that study China's co-
authorship network focus on the level of the nation or
a province rather than a city or a university and the
papers on the microscopic of the co-authorship
network are little. The co-authorship network in this
paper may be small, but it gives the direction of
possible future research. In our future work, the data
of all universities in Shanghai or other cities can be
included to build a complete co-authorship network
at the city level. In addition, more measurements can
be investigated to study their relationship with scholar
performance.
REFERENCES
Abbasi, A., Altmann, J., & Hossain, L. (2011). Identifying
the effects of co-authorship networks on the
performance of scholars: A correlation and regression
analysis of performance measures and social network
analysis measures. Journal of Informetrics, 5(4), 594–
607. https://doi.org/10.1016/j.joi.2011.05.007
Abbasi, A., Chung, K. S. K., & Hossain, L. (2012).
Egocentric analysis of co-authorship network structure,
position and performance. Information Processing &
Management, 48(4), 671–679. https://doi.org/10.1016/
j.ipm.2011.09.001
Andersson, D. E., Gunessee, S., Matthiessen, C. W., &
Find, S. (2014). The Geography of Chinese Science. 22.
Bonacich, P. (1972). Factoring and weighting approaches
to status scores and clique identification. Journal of
Mathematical Sociology, 2(1), 113–120.
Analysis of Co-authorship Network and the Correlation between Academic Performance and Social Network Measures
365

Borgatti, S. P. (1995). Centrality and AIDS. Connections,
18(1), 112–114.
Borgatti, S. P., Everett, M. G., & Freeman, L. C. (2002).
Ucinet for Windows: Software for social network
analysis.
Chung, K. K. S., Hossain, L., & Davis, J. (2005). Exploring
Sociocentric and Egocentric Approaches for Social
Network Analysis. 9.
Egghe, L. (2006). Theory and practise of the g-index.
Scientometrics, 69(1), 131–152. https://doi.org/10.
1007/s11192-006-0144-7
Freeman, L. C. (1978). Centrality in social networks
conceptual clarification. Social Networks, 1(3), 215–
239. https://doi.org/10.1016/0378-8733(78)90021-7
Freeman, L. C. (1980). The gatekeeper, pair-dependency
and structural centrality. Quality and Quantity, 14(4),
585–592.
Gauthier, T. (2001). Detecting Trends Using Spearman’s
Rank Correlation Coefficient. Environmental
Forensics, 2(4), 359–362. https://doi.org/10.1006/enfo.
2001.0061
Hochberg, Y., & Benjamini, Y. (1990). More powerful
procedures for multiple significance testing. Statistics
in Medicine, 9(7), 811–818. https://doi.org/10.1002/
sim.4780090710
Kleinberg, J. M. (1998). Authoritative sources in a
hyperlinked environment. In Proceedings of the ACM-
SIAM Symposium on Discrete Algorithms.
Liu, X., Bollen, J., Nelson, M., & Van, d. S. H. (2005). Co-
authorship networks in the digital library research
community. Information Processing & Management,
41(6), p. 1462-1480.
Martı
́
nez, A., Dimitriadis, Y., Rubia, B., Gómez, E., & de
la Fuente, P. (2003). Combining qualitative evaluation
and social network analysis for the study of classroom
social interactions. Computers & Education, 41(4), 353–
368. https://doi.org/10.1016/j.compedu.2003.06.001
Morel, C. M., Serruya, S. J., Penna, G. O., & Guimarães, R.
(2009). Co-authorship Network Analysis: A Powerful
Tool for Strategic Planning of Research, Development
and Capacity Building Programs on Neglected
Diseases. PLOS Neglected Tropical Diseases, 3(8),
e501. https://doi.org/10.1371/journal.pntd.0000501
Newman, M. E. J. (2004). Co-authorship networks and
patterns of scientific collaboration. Proceedings of the
National Academy of Sciences, 101(Supplement 1),
5200–5205. https://doi.org/10.1073/pnas.0307545100
Prell, C., Hubacek, K., & Reed, M. (2009). Stakeholder
Analysis and Social Network Analysis in Natural Resource
Management. Society & Natural Resources, 22(6), 501–
518. https://doi.org/10.1080/08941920802199202
Scott, J. (1991). Social Network Analysis: A handbook Sage
Publications London UK.
Ter Wal, A. L. J., & Boschma, R. A. (2009). Applying
social network analysis in economic geography:
Framing some key analytic issues. The Annals of
Regional Science, 43(3), 739–756. https://doi.org/
10.1007/s00168-008-0258-3
Wang, W., Wu, Y., & Pan, Y. (2014). An investigation of
collaborations between top Chinese universities: A new
quantitative approach. 11.
IoTBDS 2020 - 5th International Conference on Internet of Things, Big Data and Security
366
