
In-house Localization for Wi-Fi Coverage Diagnostics
Filipe Meneses
1,2 a
, Ricardo Ferreira
1
, Adriano Moreira
2b
and Carlos Manuel Martins
3
1
Centro de Computação Gráfica, Guimarães, Portugal
2
Algoritmi Research Centre, University of Minho, Portugal
3
We-Do, Braga, Portugal
Keywords: Indoor Location, Wi-Fi Fingerprinting, Wi-Fi Coverage, Self-diagnostics.
Abstract: Telecommunication operators and Internet Service Providers often face the problem of having residential
customers complaining about deficient Wi-Fi coverage inside their houses and/or about the low quality of
service while accessing the Internet. Addressing these complaints properly involves a comprehensive in-house
diagnostic of the technical deployment, the use of specialized equipment and visits by qualified personnel.
An alternative is to involve the users in a preliminary diagnostic, by leveraging the potential of current
smartphones, aiming to identify possible causes for the complaints that can be solved remotely or through
simple procedures to be executed by the customers. A key feature of such a diagnostic procedure is the ability
to estimate the location of the smartphone indoors automatically. This paper proposes a simple indoor
localization solution, based on Wi-Fi fingerprinting, that can be integrated into one such diagnostics procedure.
The proposed solution was implemented and tested in real-world houses by emulating the behaviour of non-
qualified users. The obtained results show that Wi-Fi fingerprinting, when used in such an uncontrolled
environment, still poses some challenges as its precision is still significantly low.
1 INTRODUCTION
In most countries around the world, the typical
configuration for residential Internet access is based
on an all-in-one-box router and Wi-Fi Access Point
(AP), connected to the Internet through a point-to-
point link: ADSL, cable or optical fibre (FTTH).
Inside the house, costumers use their own devices to
connect to the local Wi-Fi network. Being based on a
single Access Point, this solution often struggles to
provide a convenient radio coverage of the entire
house, namely for large houses or in dense residential
areas where radio interference can significantly
degrade the performance of Wi-Fi networks. These
coverage problems can vary over time due to changes
in the house layout (e.g. moving furniture from one
place to another) or due to the deployment of other
Wi-Fi networks in the neighbourhood, making them
difficult to detect during the first installation of the
service by the technicians of the Internet Service
Provider (ISP). These problems are the cause of many
a
https://orcid.org/0000-0003-0575-981X
b
https://orcid.org/0000-0002-8967-118X
complaints by the customers about the provided
service, as their quality of experience is highly
dependent on the quality of the in-house Wi-Fi
network. Similar problems are also observed for
cellular coverage indoors, but these are not usually
understood by costumers as a break of the service
contract rules.
In-house diagnostics of Wi-Fi coverage in
residential environments, executed by the customers
using their Wi-Fi enabled devices (e.g. smartphones,
tablets, etc.), has the potential of identifying the
causes for simple problems that can be solved
remotely by ISP technicians. This diagnostic testing
procedure benefits from automatic indoor
localization capabilities as it enables the comparison
of test results performed in different time epochs and
the identification of locations with recurring issues. If
properly crafted, a smartphone App can even help
customers in self-diagnostic procedures and in tuning
their setup (e.g. by moving the Wi-Fi Access Point
slightly, changing its orientation or even changing
some configuration parameters such as the radio
216
Meneses, F., Ferreira, R., Moreira, A. and Martins, C.
In-house Localization for Wi-Fi Coverage Diagnostics.
DOI: 10.5220/0009426102160224
In Proceedings of the 6th International Conference on Geographical Information Systems Theory, Applications and Management (GISTAM 2020), pages 216-224
ISBN: 978-989-758-425-1
Copyright
c
2020 by SCITEPRESS – Science and Technology Publications, Lda. All rights reserved

channel number, or by changing the position of some
furniture objects) to get a better service without any
intervention from the ISP technicians. One key
enabler of one such self-diagnostic tool is the ability
to estimate the location of the smartphone/tablet
inside the house.
Many indoor positioning and tracking
technologies have been proposed in the last decade,
targeting different scenarios and aiming to support
different applications (a good overview of the many
solutions can be found in (Mautz, 2012) or
(Davidson, 2016). Among those technologies, Wi-Fi
fingerprinting has become very popular, both within
the research community and also as the base for many
commercial products, mainly due to its simplicity and
easy of deployment. Given the current ubiquity of
Wi-Fi networks in indoor spaces and since the large
majority of mobile devices are Wi-Fi enabled, an
indoor positioning solution can be created based
entirely on software components, without the need to
deploy any infrastructure. Other similar solutions,
based on Bluetooth Low Energy (BLE), are also
becoming popular at airports, hospitals and shopping
malls, despite demanding the installation of a dense
network of BLE beacons (Faragher, 2014).
Sound and ultrasound propagation in indoor
environments have also been investigated for
supporting indoor positioning solutions (Harter,
2002; Priyantha, 2001), but they also require the
installation of a dedicated infrastructure. The systems
described in (Rishabh, 2012) and (Nakashima, 2011)
are examples of solutions that use the loudspeakers
available in offices or shopping malls to implement
indoor positioning systems. They disseminate barely
audible controlled sounds or watermarked signals,
which are then captured by the mobile users’ devices
and used to estimate the receiver position. Other
solutions, namely those based on infrared or
UltraWideBand (UWB) have the potential of
achieving high accuracy at the cost of requiring the
use and deployment of specific, and often expensive,
hardware (Alarifi, 2016).
This paper reports on the development of a
technical solution to assist residential customers of
Internet access services in performing self-diagnostic
tests in their houses. The developed solution includes
a software library with several methods to run
performance tests, including upload and download
rates, latency statistics, link speed, RSSI - Received
Signal Strength Indicator, and Wi-Fi radio
interference level (based on the number of access
points using the current and adjacent Wi-Fi channels).
The library also includes methods to estimate the
location (at room level) where each test has been
performed, thus enabling the geo-referencing of each
set of test results.
This paper is focused on the development and
testing of an indoor localization solution based on
Wi-Fi fingerprinting. Section II provides an overview
of the fundamental principles of Wi-Fi fingerprinting,
with its advantages and limitations. The proposed
solution for the in-house localization component is
introduced in section III. Its evaluation in real-world
settings is described in section IV, along with a
discussion of the obtained results. The paper ends
with conclusions and some ideas for future
developments, in section V.
2 WI-FI FINGERPRINTING
Wi-Fi fingerprinting is a scene analysis method of
positioning (Bahl, 2000). It is based on the
fundamental principle that the characteristics of the
radio environment are unique at each location, and
involves two main stages. In its first stage, samples of
the radio environment (strength of the received signal
from each observable AP, frequency channel, or other
characteristics of the radio signals) are collected at
known locations and subsequently stored in a
database to form what is known as a Radio Map.
Collecting samples can be achieved by querying the
network interface of Wi-Fi enabled devices through
the devices’ Application Programming Interface
(API), thus using simple software components. In
most of the reported solutions, multiple samples are
collected at each location, with one or more distinct
orientations of the collecting device (e.g. with the
device heading North, South, etc.). Collecting
multiple samples aims at capturing the variability of
the radio signals at each location. In some systems,
the set of collected fingerprints is pre-processed,
namely by averaging the measured signal level from
each AP or by filtering data from specific APs, to
produce the final radio map. This is considered, by
some authors, one additional stage added to the two
conventional ones.
In the operational stage, also known as the on-line
stage, a device at an unknown location collects one
sample of the radio environment (operational
fingerprint) and an estimation method is used,
together with the radio map, to estimate the position
of the device. Two main approaches are used to
estimate the position - deterministic and probabilistic,
with none of them being clearly superior to the other.
The probabilistic approach is based on a probabilistic
model that describes the probability of observing a
given signal level from a particular AP at a given
In-house Localization for Wi-Fi Coverage Diagnostics
217

position, and is usually built by approximating the
distribution of the measured signal level to a Gaussian
distribution. The unknown position of the device is
then estimated through a Bayesian method (see, e.g.
(Youssef, 2005) and (Ledlie, 2012)). With the
deterministic approach, a distance function is used to
compute the similarity between the operational
fingerprint and all the fingerprints in the radio map.
The most similar fingerprint or the k most similar
fingerprints in the radio map are then selected and
their corresponding positions are used to estimate the
position of the target device (usually the centroid or
weighted centroid). This is known as the k-Nearest
Neighbour (kNN) method. Many alternative distance
functions have been proposed to compute the
similarity between fingerprints, with the Euclidean
and Manhattan distances being the most popular
(Torres-Sospedra, 2015). When estimating the
location at room level, majority rules can be used to
pinpoint the most probable compartment indoors
(Marques, 2012). Other classification methods have
also been proposed, including decision trees, random
forest, Support Vector Machine and Neural
Networks.
Due to the variability of the radio environment,
the typical performance of Wi-Fi fingerprinting-
based indoor positioning solutions is characterized by
an accuracy (mean error) around 5 meters, with the
frequent observation of very large errors (larger than
15 meters). One good reference regarding the
performance of these positioning methods is the set
of results obtained in indoor positioning
competitions, such as the IPIN (Torres-Sospedra,
2016) and Microsoft competitions (Lymberopoulos,
2017), although paying attention to the fact that most
of the competing systems are not pure Wi-Fi
fingerprinting-based but, instead, hybrid system
fusing data from multiple sensors.
Indoor positioning based on Wi-Fi fingerprinting
is, however, very challenging. Firstly, creating radio
maps for large buildings is a very tedious and time-
consuming task, even when resorting to advanced
localization and mapping (SLAM) approaches
(Ferris, 2007; Wu, 2012; Jiang, 2012). Moreover,
radio maps degrade with time due to changes in the
radio environment, requiring frequent recalibrations.
Some of the causes of these changes in the radio
environment are modifications in the layout of the
space (e.g. furniture moving, doors opening/closing),
alterations in the layout of the Wi-Fi network (APs
being relocated, added or removed, nearby networks
being deployed/modified) and the presence of mobile
hotspots (temporary APs created by mobile devices).
Wi-Fi-fingerprinting also suffers from the use, in the
operational phase, of devices different than those
used for creating the radio map, including different
versions of the Android OS API version, from the
orientation of the devices that affect the measured
received radio signals due to body shadowing, and
also from how the devices are handled (carried in the
pocket, in the hand, etc.) while collecting a
fingerprint.
3 ROOM-LEVEL
LOCALIZATION
The aim of the positioning system described in this
paper is to detect when network performance tests
have been run in the same room inside the house
where similar tests were run earlier. Therefore, it is a
problem of recognizing (recalling) a previously
visited room. In its simplest form, the user of a
smartphone App visits each and every room inside
his/her house and collects enough fingerprints to
properly characterize them, also labelling these
fingerprints with the room name. This approach for
building the radio map can be easily and rapidly
performed in a regular house with the help of a
smartphone App based on a wizard. In a more
automated form, the fingerprints are collected
automatically, in the background, by the smartphone
App while also running the other performance tests.
In any case, the collected fingerprints are then used to
characterize and later recognize each room.
The proposed approach for this system is based on
pure Wi-Fi fingerprinting, running completely in the
smartphone, without depending on any network
service. The reason for this design choice is to ensure
total privacy of the users. On the other hand, this
choice imposes some limitations on the choice of the
estimation method (e.g. deep learning might not be
practical to implement).
Following a tradition approach, based on a
deterministic estimation method, let R be the set of all
labelled fingerprints (fp), collected at each room,
during an initial calibration, that form the radio map.
Each fingerprint is described as:
𝑓𝑝
𝑙,
𝑀
, 𝑅𝑆𝑆𝐼
,…,
𝑀
, 𝑅𝑆𝑆𝐼
(1)
where l is a unique label identifying each room inside
the house, M is the MAC address of an observed AP,
RSSI is the Received Signal Strength Indicator
representing the measured signal level (represented in
dBm), and N is the number of APs observed at a
particular location in a particular time instant.
GISTAM 2020 - 6th International Conference on Geographical Information Systems Theory, Applications and Management
218
In the operational stage, a deterministic method is
used to estimate the room associated with a given
fingerprint (fp
0
) collected at an unknown location.
First, the similarity S between fp
0
and all the
fingerprints fp
i
in R is computed using a modified
version of the Manhattan distance, defined as:
𝑆
𝑓𝑝
,𝑓𝑝
∑
𝑅𝑆𝑆𝐼
𝑅𝑆𝑆𝐼
𝛼𝑛𝐶𝑀
(2)
where RSSI
0
j
is the measured RSSI of AP
j
in the
operation fingerprint (fp
0
), RSSI
i
j
is the measured
RSSI of AP
j
in the radio map fingerprint (fp
i
), N is the
total number of APs observed in the fp
0
and fp
i
, nCM
is the number of APs than are observed in both fp
0
and
fp
i
, and
⍺
is a parameter that gives more or less weight
to the number of common APs (nCM). Since not all
APs are observed in all fingerprints, whenever an AP
is missing (not observed), the corresponding RSSI
value is replaced by a constant representing a weak
signal (we found -90 dBm to provide good results).
Let B be the set of radio map fingerprints ordered
by decreasing similarity (meaning increasing value of
S) with fp
0
. The location (room) associated to fp
0
is
estimated by applying a majority rule to the top k
fingerprints taken from B: the most frequent room is
the most probable location for fp
0
(k-Nearest
Neighbours – k-NN). This method assumes that R
includes more than one labelled fingerprint per room.
Otherwise, k must take the value 1, and the estimated
location is that of the most similar fingerprint (1-NN),
i.e. that of the top fingerprint in B.
The location estimation method described above
was implemented as a Java library including classes
and methods to collect fingerprints, manually label
fingerprints (to get ground truth), to build the radio
map, and to estimate the location associated to a given
fingerprint. Other methods, used to assess the
performance of Wi-Fi networks have also been
implemented, including a feature to upload the results
to a server.
4 EVALUATION IN THE REAL
WORLD
The developed system was evaluated in three
different houses, of varying configuration, in order to
assess the performance in recognizing a previously
mapped room. Three distinct persons performed the
evaluation using three different smartphones. As
much as possible, the evaluation was performed
trying to mimic the behaviour of non-technical users.
This process was performed without altering the
normal behaviour of the space inhabitants or
changing the physical layouts, such as the position of
furniture and other large objects. These experiments
were conducted in the first days of February 2019.
4.1 Experimental Setup
The infrastructure created to evaluate the developed
solution (the Java library, with emphasis on the
localization solution) includes an Android App and a
data server, and three houses where the system has
been tested.
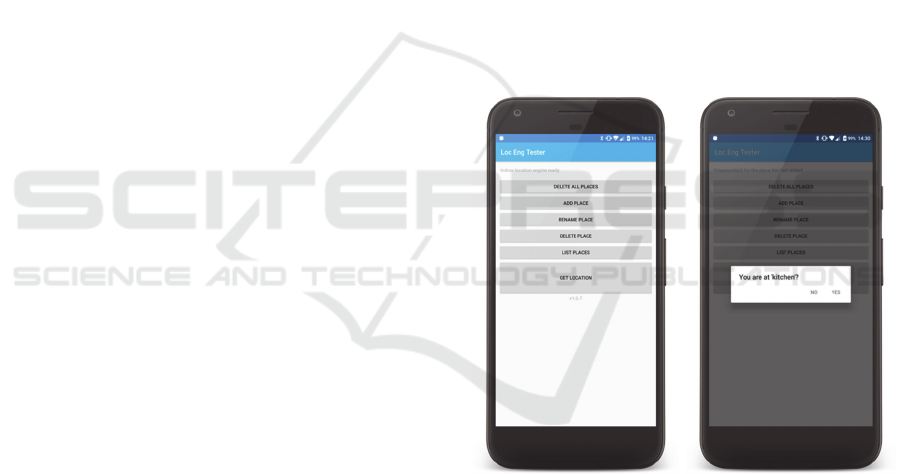
The App implements a simple graphical user
interface that facilitates the access to the main library
functions (see Figure 1): Add Place – to collect a set
of fingerprints, label the corresponding location and
add them to the radio map; Get Location – to collect
one single fingerprint, estimate the corresponding
location, collect ground truth (Figure 1.b), and send
the result to a server. All the other functions are used
to manage the radio map: reset it (Delete Places),
rename a place, delete a place, and list all places.
(a) (b)
Figure 1: Android App used for the validation of the
localization system: (a) main menu; (b) validating a
recognized place.
The server is used only to collect the experimental
results: every time a localization estimation is
performed, the corresponding operational fingerprint,
the used radio map and the ground truth are sent to
the server, where these data is stored in a database for
further processing. This allows the same data to be
processed offline using variants of the estimation
algorithm.
In-house Localization for Wi-Fi Coverage Diagnostics
219

The system has been tested in three different
houses:
House A (hA) – a three-floor house with 12
compartments, 1 in the basement, 5 “spaces” in
the ground floor and 6 compartments in the
upper floor; all spaces in the ground floor are
in an open space without any walls or doors
separating them, except for the toilet and
laundry; most interior walls are made of brick;
the neighbourhood includes several similar
houses around, with small gardens in between;
no testing has been performed in the basement;
House B (hB) – a 120 square meters single-
floor house with 8 compartments; there is only
one neighbour house that share a wall from
kitchen and a room; all spaces are separated by
walls made of brick and accessible by the hall;
House C (hC) – a flat, with almost 130 square
meters, on the 3
rd
floor of a multi-floor
building, with 9 compartments; all spaces are
separated by walls made of brick, except the
laundry room which is separated from the
kitchen by a glass; the neighbourhood includes
three other flats on the same floor (with a
double wall made of brick in between) and
several other flats on the same floor but without
direct contact; the same layout exists on the
remaining four floors of the building.
Four different smartphones were used to collect
the data: Nexus 5, Oneplus 5T, Xiaomi Mi8 Pro, and
Lenovo Pb2. In all tests, the same device was used to
build the radio map and to perform the localization
tests. Experiments using one smartphone for building
the radio map and a different one to perform the
localization tests were not considered since those
scenarios are not expected to happen in the real use of
this system.
4.2 Evaluation Metrics
The main metric for evaluating the performance of
symbolic location systems is Accuracy – it measures
the percentage of times the system correctly
recognizes the visited place. Since the performance of
the location recognition is dependent on the total
number of distinct places to recognize (the smaller the
number of distinct places, the easier is to recognize
the correct place), a secondary metric is defined as the
gain over a random guessing. This metric, named
Relative Accuracy, is defined as Ar = Np x Accuracy,
where Np is the total number of rooms inside the
house (number of classes in the classifier). Ar is
simply the gain over a random classifier, which
accuracy is 1/Np. In our evaluation, the number of
samples (fingerprints) collected in each room to build
the radio map is the same, so that there is no initial
unbalance (bias) and the prior probabilities of each
class are all equal.
4.3 Evaluation Procedure
An evaluation procedure was defined prior to any
data collection at the houses referred above.
It is also well known that the movement of
devices affects the propagation of radio signals
significantly. However, despite the large number of
location/positioning systems based on radio signals
that have been proposed, their evaluation is usually
performed with stationary devices. The exception is
the class of positioning tracking systems based on
pedestrian dead reckoning since the movement of the
human body is fundamental to estimate displacement
(e.g. through step counting and stride length
estimation). Therefore, this work also aims at
investigating the impact of movement in the
performance of Wi-Fi based fingerprinting location
systems.
Three different modes were tested:
still-table: stationary smartphone over a table
or similar object;
still-hand: stationary smartphone being hold in
the hand of the user;
moving-hand: smartphone handled by the user
while walking inside the house at normal speed
(less than 1m/s).
Two sets of experiments were conducted: one
with the radio map built with the smartphone placed
on top of a table (still-table), and another with the
smartphone in the hand (still-hand). This is intended
to evaluate the impact of having the smartphone in the
hand while collecting the fingerprints. For the first
radio map (still-table), two localization tests were
performed: still-table and moving-hand. For the
second radio map (still-hand), the localization tests
were performed for the modes still-hand and moving-
hand.
Data collection involved two stages. First, a user
registered all the places inside the house to create the
radio map. In the second stage, the user visited all the
spaces/rooms, many times, and asked the system to
recognize his location while being stationary (still-
table), while holding the smartphone in the hand
(still-hand), and while walking without stopping
(moving-hand).
GISTAM 2020 - 6th International Conference on Geographical Information Systems Theory, Applications and Management
220
To create the radio map, the user visited each
place/room, selected a location near the centre of the
room, placed the smartphone on top of a table or other
surface at similar height (still-table), with the screen
pointing to the ceiling, pushed the ADD PLACE
button (see Figure 1), and typed in the room name.
Ten fingerprints were collected per room. No specific
order was defined to visit the several rooms. Each
room was visited only once. In the second set of
experiments, this procedure was repeated while
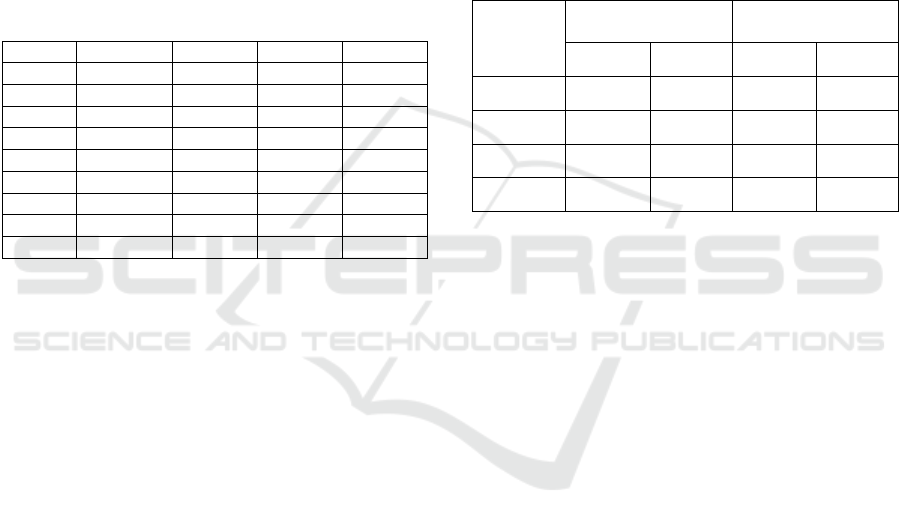
holding the smartphone (still-hand). Table 1 shows a
summary of the collected data, including the number
of fingerprints collected in each house for each testing
mode (#fps) and the total number of observed Access
Points (#APs).
Table 1: Summary of the collected data (radio maps).
House Mode #rooms #fps #APs
hA still-hand 11 110 7
hA still-table 11 110 8
hB still-hand 8 80 11
hB still-table 8 80 7
hC still-hand 9 90 23
hC still-table 9 90 22
hC still-hand 9 90 29
hC still-table 9 90 21
Total:
740
The second stage was devoted to evaluate the
performance of the system in recognizing previously
mapped rooms. To collect the corresponding data, the
user repeated the same procedure as for creating the
radio map but, instead of pushing the ADD PLACE
button, the user used the GET LOCATION function
of the App. After receiving a reply from the App, the
user confirmed the estimated location, if correct, or
selected the correct place from the list of registered
places, otherwise. An “unknown” location could also
be selected in case the user was at a place not
previously registered into the system. In this stage,
each room was visited three times. This procedure
was repeated for the modes still-table, still-hand and
moving hand.
Since all these data was sent to a server during the
evaluation, the performance of the system was
computed offline.
5 EVALUATION RESULTS AND
DISCUSSION
The results presented in this section were obtained by
using the following values for the system parameters:
default RSSI value for missing APs: -90 dBm
⍺
(see equation (2)): 4
k (number of top fingerprints to use when
applying the majority rule): 5
A summary of the evaluation results is shown in
Table 2. These results are, apparently, disappointing,
since the accuracy is quite low. It means that, in too
many cases, the localization system is not able to
estimate the correct room, even though the
performance of the system is way better than a
random classifier.
Table 2: Overall Accuracy (A) and Relative Accuracy (Ar).
Radio map
(still-table)
Radio map
(still-hand)
A Ar A Ar
hA
0.563 6.19 0.508 5.59
hB
0.612 4.89 0.430 3.44
hC
0.598 5.38 0.719 6.47
Average
0.591 5,49 0.552 5.17
These results also show that the difference in
performance across the three houses is not very large
when the radio map is built with the smartphone
standing on top of a table (still-table), but larger
variations are observed when the smartphone is in the
hand while building the radio map (still-hand). This
was an expected result, as it is known that the human
body attenuates the radio (Wi-Fi) signals
significantly. On the other hand, the average results,
considering the three houses, are similar for both
radio maps.
A deeper analysis of the results revealed that,
many times, the incorrect location estimates are on
rooms adjacent to the correct one, or that the second
or third guesses include the correct room. This is
illustrated in Table 3, where it is shown that in around
80% of the estimates, the correct room is within the
three best guesses. One possible explanation for these
results is that, in the houses used for testing, some
rooms are not clearly separated by walls and/or doors
– they are just different areas in a large open space.
Therefore, it is not easy to distinguish the different
areas since there are no obstacles to differentiate the
propagation of the radio signals clearly. The results in
Table 3 also show that, when considering the
aggregated data, there is no significant difference
between the two radio maps.
In-house Localization for Wi-Fi Coverage Diagnostics
221
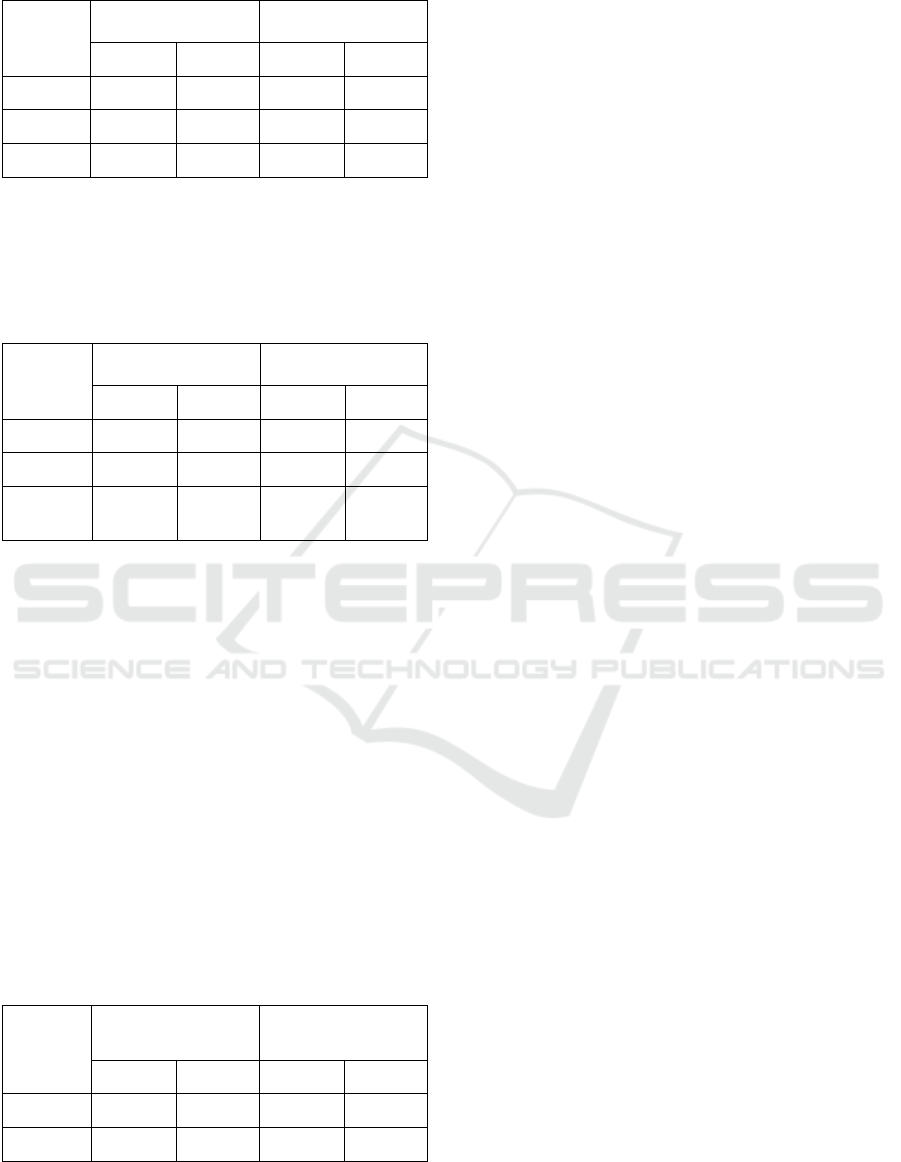
Table 3: First, second, and third best guesses.
Guess
Radio map
(still-table)
Radio map
(still-hand)
A Ar A Ar
1
0.592 5.46 0.594 5.49
1+2
0.697 6.42 0.700 6.46
1+2+3
0.802 7.38 0.797 7.35
Table 4 shows results about the impact of
movement, aggregated for the three houses. It
compares the results (first guess only) for the two
radio maps and the performed testing modes.
Table 4: Impact of movement.
Mode
Radio map
(still-table)
Radio map
(still-hand)
A Ar A Ar
still-table
0.623 5.77 - -
still-hand
- - 0.650 6.00
moving-
hand
0.562 5.15 0.538 4.98
Here it is more evident the impact of performing
tests (localization) while moving: for both radio maps
there is a clear degradation on the accuracy when the
fingerprints are collected while the user was walking.
In one of the houses, the tests were performed
using two different smartphones, aiming to evaluate
if the use of different devices has a significative
impact on the accuracy. For each test, both the radio
map fingerprints and the online fingerprints were
collected using the same device. The corresponding
results are shown in Table 5, and are inconclusive.
While for the first radio map there is a clear advantage
on the performance of the Xiaomi smartphone, for the
second radio map the results are, coincidentally,
exactly equal.
For the house with multiple floors, the correct
floor rate was calculated and found to be 93,1%.
Table 5: Impact of using different smartphones.
Mode
Radio map
(still-table)
Radio map
(still-hand)
A Ar A Ar
Xiaomi
0.718 6.46 0.719 6.47
Lenovo
0.478 4.30 0.719 6.47
Given the obtained results, which suggest that
there is room for considerable improvements, other
localization methods, were evaluated. Among them,
well-known classifiers such as Naïve Bayes, Decision
Trees, Random Forest (ensembles), Neural Networks
and Support Vector Machine were evaluated using
the radio maps for training and the testing fingerprints
for testing, using the vector of all RSSI values
observed from all APs as the single feature. The
obtained results (accuracy) were consistently worse
than those obtained with the method described in this
paper.
6 CONCLUSIONS AND FUTURE
WORK
In this paper we reported on the evaluation of an
indoor localization system, at room level, based on
Wi-Fi fingerprinting. The particular characteristic of
the developed system is that it is to be used in
residential houses by non-qualified people using a
simple smartphone App. Therefore, no initial setup
and/or calibration should be made by professionals.
In order to preserve the privacy of the users, the
system should also implement all the required
functions in the smartphone App, and no external
server should be used. This requirement prevents the
use of advanced methods that imply a high
computational burden, incompatible with the
processing capabilities of average smartphones/tables
or required high energy consumption.
The proposed system is based on Wi-Fi
fingerprinting and a simple deterministic estimation
method (similarity and majority rule). Its
performance has been evaluated in three real houses.
The results reported in this paper show that
recognizing previously mapped rooms inside the
house is a difficult task, and the obtained accuracy
was in the range of 55 to 80%. These results are worse
than initially specified. One reason for this level of
performance might be the small number of Access
Points observed in a house, compared with what is
now typical in more network-dense places such as
universities, hospitals or airports. On the other hand,
these results are in line with the typical positioning
results reported in the literature for Wi-Fi
fingerprinting, where the accuracy is around 5 meters.
With this level of accuracy, it is quite easy to estimate
the wrong room inside a house with typical room
sizes (~10-15 m
2
).
A direct comparison with the results of other
authors is a difficult task, as reported in (Torres-
GISTAM 2020 - 6th International Conference on Geographical Information Systems Theory, Applications and Management
222

Sospedra, 2017), since the evaluation conditions are
often very different and the reported methods are
difficult, if not impossible, to replicate. Moreover, the
room-level accuracy depends deeply on the layout of
the space and materials used. Results reported in
(Yasmine, 2016) show an accuracy of 0.88. However,
these results were obtained in a test performed in a
shopping mall, with shops spreading a much larger
area than is typical in a house. This larger spread
facilitates the distinction among rooms (shops in this
case) that are far apart, which is not the case in a 100
m
2
house.
As future work, and in order to improve the
accuracy, a few hybrid solutions will be evaluated,
including the combination of Wi-Fi fingerprinting
with fingerprinting based on cellular networks radio
signals (Otsason, 2005) or with sound-based
fingerprinting. In these hybrid methods, the use by
non-professionals should be evaluated and its impact
measured.
One other area deserving further investigation, for
this particular application, is the use of multiple
fingerprints collected at each room during the
localization (online) phase. Multiple fingerprints can
be combined to reduce the inherent variability of the
RSSI values. This technique can be easily
incorporated in the developed App at the expense of
longer data collection periods at each location.
ACKNOWLEDGMENT
Authors acknowledge the project Next-Gen
RAID.Cloud for the Digital Transformation,
Individual Demonstration Projects, NUP: POCI-01-
0247-FEDER-033539, a project co-funded by the
Incentive System for Research and Technological
Development, from the Thematic Operational
Program Competitiveness of the national framework
program - Portugal2020. This work has also been
supported by FCT – Fundação para a Ciência e
Tecnologia within the R&D Units Project Scope:
UID/CEC/00319/2020.
REFERENCES
Alarifi, A., Al-Salman, A., Alsaleh, M., Alnafessah, A., Al-
Hadhrami, S., Al-Ammar, M., & Al-Khalifa, H. (2016).
Ultra wideband indoor positioning technologies:
Analysis and recent advances. Sensors, 16(5), 707.
Bahl, P., Padmanabhan, V. N., Bahl, V., & Padmanabhan,
V. (2000). RADAR: An in-building RF-based user
location and tracking system.
Davidson, P., & Piché, R. (2016). A survey of selected
indoor positioning methods for smartphones. IEEE
Communications Surveys & Tutorials, 19(2), 1347-
1370.
Faragher, R., & Harle, R. (2014, September). An analysis
of the accuracy of bluetooth low energy for indoor
positioning applications. In Proceedings of the 27th
International Technical Meeting of The Satellite
Division of the Institute of Navigation (ION GNSS+
2014) (Vol. 812).
Ferris, B., Fox, D., & Lawrence, N. D. (2007, January).
WiFi-SLAM Using Gaussian Process Latent Variable
Models. In IJCAI (Vol. 7, No. 1, pp. 2480-2485).
Harter, A., Hopper, A., Steggles, P., Ward, A., & Webster,
P. (2002). The anatomy of a context-aware application.
Wireless Networks, 8(2/3), 187-197.
I. Rishabh, D. Kimber and J. Adcock, "Indoor localization
using controlled ambient sounds," 2012 International
Conference on Indoor Positioning and Indoor
Navigation (IPIN), Sydney, NSW, 2012, pp. 1-10.
Jiang, Y., Pan, X., Li, K., Lv, Q., Dick, R. P., Hannigan, M.,
& Shang, L. (2012, September). Ariel: Automatic wi-fi
based room fingerprinting for indoor localization. In
Proceedings of the 2012 ACM Conference on
Ubiquitous Computing (pp. 441-450). ACM.
Ledlie, J., Park, J. G., Curtis, D., Cavalcante, A., Camara,
L., Costa, A., & Vieira, R. (2012). Molé: a scalable,
user-generated WiFi positioning engine. Journal of
Location Based Services, 6(2), 55-80.
Lymberopoulos, D., & Liu, J. (2017). The microsoft indoor
localization competition: Experiences and lessons
learned. IEEE Signal Processing Magazine, 34(5), 125-
140.
Marques, N., Meneses, F., & Moreira, A. (2012,
November). Combining similarity functions and
majority rules for multi-building, multi-floor, WiFi
positioning. In 2012 International conference on indoor
positioning and indoor navigation (IPIN) (pp. 1-9).
IEEE.
Mautz, R. Indoor Positioning Technologies. Ph.D. Thesis,
ETH Zürich, Zürich, Switzerland, 2012.
Nakashima, Yuta & Kaneto, Ryosuke & Babaguchi,
Noboru. (2011). Indoor Positioning System Using
Digital Audio Watermarking. IEICE Transactions. 94-
D. 2201-2211. 10.1587/transinf.E94.D.2201.
Otsason, V., Varshavsky, A., LaMarca, A., & De Lara, E.
(2005, September). Accurate GSM indoor localization.
In International conference on ubiquitous computing
(pp. 141-158). Springer, Berlin, Heidelberg.
Priyantha, N. B., Miu, A. K., Balakrishnan, H., & Teller, S.
(2001, July). The cricket compass for context-aware
mobile applications. In Proceedings of the 7th annual
international conference on Mobile computing and
networking (pp. 1-14). ACM.
Torres-Sospedra, J., Jiménez, A., Knauth, S., Moreira, A.,
Beer, Y., Fetzer, T., ... & Belmonte, O. (2017). The
smartphone-based offline indoor location competition
at IPIN 2016: Analysis and future work. Sensors, 17(3),
557.
In-house Localization for Wi-Fi Coverage Diagnostics
223

Torres-Sospedra, J., Montoliu, R., Trilles, S., Belmonte, Ó.,
& Huerta, J. (2015). Comprehensive analysis of
distance and similarity measures for Wi-Fi
fingerprinting indoor positioning systems. Expert
Systems with Applications, 42(23), 9263-9278.
Wu, C., Yang, Z., Liu, Y., & Xi, W. (2012). WILL:
Wireless indoor localization without site survey. IEEE
Transactions on Parallel and Distributed Systems,
24(4), 839-848.
Yasmine, R., & Pei, L. (2016, November). Indoor
fingerprinting algorithm for room level accuracy with
dynamic database. In 2016 Fourth International
Conference on Ubiquitous Positioning, Indoor
Navigation and Location Based Services (UPINLBS)
(pp. 113-121). IEEE.
Youssef, M., & Agrawala, A. (2005, June). The Horus
WLAN location determination system. In Proceedings
of the 3rd international conference on Mobile systems,
applications, and services (pp. 205-218). ACM.
GISTAM 2020 - 6th International Conference on Geographical Information Systems Theory, Applications and Management
224
