
PROGDASH: Lessons Learned from a Learning Dashboard In-the-wild
Mohamed Ez-zaouia
1,3,4
, Aur
´
elien Tabard
2,3
and Elise Lavou
´
e
1,3
1
University of Lyon, Universit
´
e Jean Moulin Lyon 3, Iaelyon School of Management, France
2
University of Lyon, Universit
´
e Claude Bernard Lyon, France
3
CNRS, LIRIS UMR5205, F-69621 Lyon, France
4
Woonoz, Lyon, France
Keywords:
Learning, Dashboards, Design Study, Field Study.
Abstract:
Teachers mixing in-class and remote online learning activities face numerous challenges in monitoring learners’
online activity and progress, especially when preparing in-class interventions. We present a design study of
PROGDASH, a dashboard enabling teachers to monitor learners’ activity on an online grammar and spelling
learning platform. We designed PROGDASH based on interviews with seven teachers to understand their needs,
and we collaboratively iterated on design prototypes. We conducted a three-month field deployment with 17
teachers, collecting logs, diaries, and interview data to evaluate how PROGDASH informed their practices. Our
findings extend prior work on teachers’ practices using dashboards: teachers found PROGDASH actionable to
devise informed pedagogical practices: monitoring, conducting assessments, planning interventions, sharing
in-class, providing debriefing and feedback. Based on our findings, we suggest directions on how dashboards
could effectively support teachers in schools using online learning platforms in authentic settings.
1 INTRODUCTION
Schools are increasingly integrating web-based learn-
ing environments with in-class learning activi-
ties (Technavio, 2016). Teachers leverage these plat-
forms, to support in-class learning, help learners de-
velop skill-sets that should already be mastered, or to
provide personalized support to learners with specific
needs, e.g., dyslexics.
Teachers mixing in-class and remote online learn-
ing activities face numerous challenges in monitoring
learners’ online activities, especially when inform-
ing their in-class interventions. Dashboards can be
efficient tools for facilitating sense-making, reflec-
tion, and making informed decisions (Verbert et al.,
2014). Prior work on virtual learning environments,
used mainly in-class, has shown the potential of dash-
boards to support teachers, for instance, to improve
their awareness of their classrooms (Holstein et al.,
2018), to support their planning tasks and interven-
tions (Xhakaj et al., 2017), to support learners with
lesser abilities (Molenaar and van Campen, 2017), and
to provide personalized support to learners in a timely
fashion (Aslan et al., 2019).
However, with online learning, the individualized
pacing of learners makes it difficult for teachers to
monitor learners’ progression before engaging in for-
mative in class interventions. The way teachers lever-
age dashboards in the long run and how dashboards
shape their pedagogical practices is still unclear. Two
recent systematic reviews of more than 150 learning
analytics dashboards emphasize the need for more lon-
gitudinal studies to investigate how a dashboard might
inform and impact teachers’ practices (Bodily et al.,
2018; Schwendimann et al., 2017).
In this paper, we present a design study (Sedlmair
et al., 2012) and a longitudinal field evaluation of
PROGDASH, a dashboard to assist teachers in mon-
itoring learners’ progression on an online grammar
and spelling learning platform. We designed PROG-
DASH based on interviews with seven teachers to un-
derstand their needs, and we collaboratively iterated
on design prototypes (Dow et al., 2011). We imple-
mented and integrated PROGDASH in a commercial
online learning platform called PROJET-VOLTAIRE
1
.
We then conducted a three-month field deployment
with 17 teachers, collecting logs, diaries, and inter-
view data to evaluate how PROGDASH informed and
impacted their practices in blended learning. Our re-
sults show that most teachers reacted positively to the
dashboard. They found it actionable to inform sev-
1
https://www.projet-voltaire.fr
Ez-zaouia, M., Tabard, A. and Lavoué, E.
PROGDASH: Lessons Learned from a Learning Dashboard In-the-wild.
DOI: 10.5220/0009424801050117
In Proceedings of the 12th International Conference on Computer Supported Education (CSEDU 2020) - Volume 2, pages 105-117
ISBN: 978-989-758-417-6
Copyright
c
2020 by SCITEPRESS – Science and Technology Publications, Lda. All rights reserved
105

eral pedagogical practices: monitoring, conducting
assessments, planning interventions, sharing in-class,
providing debriefing and feedback. Our results fur-
ther highlight a divide between teachers specialized
in the concepts of the learning platform (i.e. French
language) and those in disciplines requiring the skills
(e.g. Marketing), even if both were concerned with
achieving the same objectives, mainly helping learners
master spelling and grammar. Based on our findings,
we provide design implications aimed at improving
dashboards to bridge online and in-class learning and
foster learners’ self-reflection.
The contributions of our work are (1) a design
study of PROGDASH to support teachers in using a
curriculum-integrated online learning platform, (2) a
three-month “in-the-wild” field study of PROGDASH,
which extends our understanding of how teachers inte-
grate a dashboard in their practices to articulate remote
and in-class learning, and (3) design implications for
dashboards to bridge online and in-class learning and
facilitate data-informed pedagogical practices.
2 RELATED WORK
This paper focuses specifically on how dashboards
might inform teachers’ practices in authentic settings.
2.1 Learning Analytics Dashboards
Early work on learning dashboards focused on support-
ing formative assessments to provide teachers with
data-driven insights into learners’ state of learning
(Black and Wiliam, 1998). Follow-up research on
learning dashboards focused on leveraging human
judgment through robust reporting tools and visual-
izations (Siemens and Baker, 2012). Recently, a wide
range of contributions has been introduced to instru-
ment teachers using dashboards spanning a variety of
aspects.
A great deal of research has been devoted to ensure
the solid technical infrastructure of dashboards, such
as standard ways to collect, store, and query learning
traces with the associated context and content, im-
plementation of interoperable architectures (Dyckhoff
et al., 2012), development through toolkits (Kitto et al.,
2015), and data aggregation from multiple learning
platforms (Mottus et al., 2014). Besides, other dash-
boards’ aspects have been investigated, such as en-
abling teachers to personalize the presentation of views
(Dyckhoff et al., 2012; Mottus et al., 2014; Michel
et al., 2017), or to specify what and how indicators are
monitored to match learners’ performance with regard
to competences (Florian-Gaviria et al., 2013).
While these studies shed light on the importance
of dashboards in assisting teachers, they mainly focus
on evaluating the technical aspects of the underlying
systems (Schwendimann et al., 2017). In fact, the
aforementioned dashboards and many others focused
mainly on “usability” (Chetlur et al., 2014; Dyckhoff
et al., 2012; Ez-zaouia and Lavou
´
e, 2017; Carrillo
et al., 2017), “usefulness” (Florian-Gaviria et al., 2013;
Dyckhoff et al., 2012), or “interoperability” (Dyckhoff
et al., 2012), and in many cases the evaluation was con-
ducted in controlled settings or even in the lab (Mazza
and Dimitrova, 2007). Although these studies are use-
ful for understanding the design and intelligibility of
dashboards, they teach us little about the impact of
dashboards on teachers’ practices in-situ.
Very few studies have focused on teachers’ rou-
tines surrounding such tools (Greiffenhagen, 2011), or
on how they are can guide teachers’ actions. And such
studies are often conducted over short-term deploy-
ments. In contrast, we conducted a teacher-centered
design process, leading to a longitudinal study, to in-
vestigate how a dashboard might impact teachers’ ped-
agogical practices in a long term (Ez-zaouia, 2020;
Zapata-Rivera and Katz, 2014).
2.2 Authentic Setting Studies
Research on teachers’ data-informed practices using
dashboards focuses mainly on how to support moni-
toring of learners’ performance while they are using a
learning environment in-class, such as errors, struggles,
attempts, responses, and engagement indicators. Com-
bining field observations and interviews, Molenaar
and van Campen (2017) investigated how 38 teachers
used a dashboard over one session (50 minutes) to
conduct assessments both at class and learner levels
(errors, progression, etc.), to provide motivational and
formative instruction to learners, as well as to adjust
both the learning material and the pace of the lesson.
Although the results revealed a diversity of use (low,
medium, high), three-quarters of teachers’ dashboard
consultations were followed by motivational feedback
or formative instruction either directed to the class as
a whole or to individual learners with medium or high
ability. In a similar study, Holstein et al. (2018) in-
vestigated how 8 teachers used a virtual reality glass
dashboard over a total of 18 courses (30 minutes each)
to orchestrate the classroom. In contrast to (Molenaar
and van Campen, 2017), the authors found that the
dashboard tended to divert teachers’ attention and time
towards learners of lower prior ability.
Combining observations and interviews, Aslan
et al. (2019) investigated how a teacher used indica-
tors of learners’ engagement shown on a dashboard
CSEDU 2020 - 12th International Conference on Computer Supported Education
106
over two courses (80 minutes each) to support learners
through different teachers’ interventions: verbal warn-
ing, positive reinforcement, scaffolding, close moni-
toring. The authors observed a medium size-effect of
the dashboard on teachers’ scaffolding interventions
and use for close monitoring, mainly in assisting the
teacher with allocating time to learners who need most
support without compromising the overall experience
of the class. In a similar study, Martinez-Maldonado
et al. (2015) investigated how three teachers used real-
time notifications on learners’ actions and their learn-
ing artifacts, shown on a dashboard. The dashboard
was found to be helpful for teachers in orchestrating
multi-tabletop learning environments and providing
feedback to learners.
In a context similar to ours, Groba et al. (2014) pro-
posed an analytics-based tool to help teachers assess
learners’ activity, and evaluated it with two teachers
during a one-session course. The results showed that
this tool reduced significantly assessment times and
helped teachers understand the learning process of
learners. Combining think-aloud and observations,
Xhakaj et al. (2017) investigated how five teachers
used a dashboard to plan and conduct lessons over
eight courses (60 minutes each), where students used
a virtual learning environment. The authors found that
the provision of both positive and negative notifica-
tions on learners’ status facilitated the dialog between
a teacher and learners, and supported teachers in ad-
justing and orchestrating learning materials. The au-
thors also observed that the dashboard helped teachers
update (confirm, reject, and/or add new items) their
knowledge about both the class as a whole and indi-
vidual learners. In particular, the authors found that
teachers mostly integrated the knowledge acquired
concerning where learners’ struggles in their lessons.
These studies show that dashboards, when they are
well crafted, can successfully assist teachers in moni-
toring learners and conducting adapted interventions.
In fact, the aforementioned dashboards are mostly used
by teachers synchronously inside the classroom while
learners are using the computer-based learning envi-
ronment. Informed by the work of Ez-zaouia et al.
(2020), we investigate how PROGDASH may inform
teachers’ practices in blended and remote online learn-
ing settings. We sought to understand what teachers
actually do with dashboards “in-the-wild”.
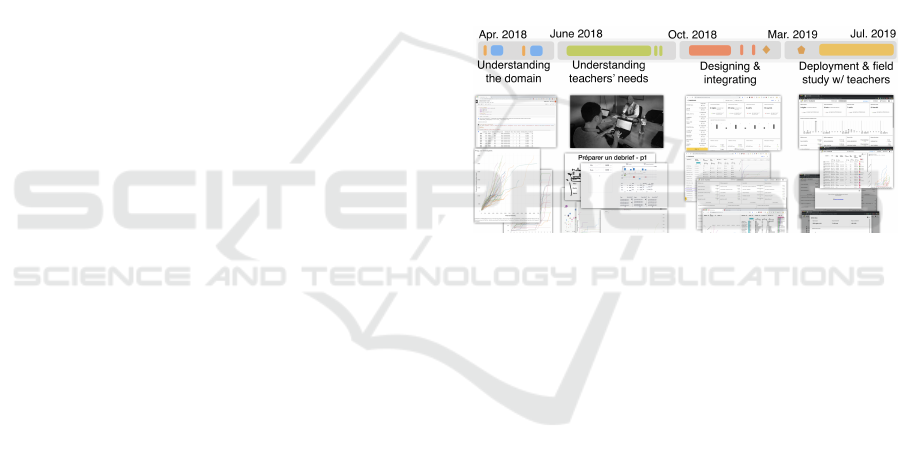
3 DESIGN STUDY PROCESS
We followed a teacher-centered design study pro-
cess (Ez-zaouia, 2020) in four steps (Figure 1):
1. Understanding the Domain:
We discussed with
PROJET-VOLTAIRE designers to understand the the
platform, the exercises, the learning process, and its
data (see Section 4). We gathered real data to prototype
realistic visualizations.
2. Understanding Teachers’ Needs:
We interviewed
seven teachers to identify their needs for monitor-
ing/understanding learners’ progression, and to ex-
plore design alternatives (see Section 5).
3. Design and Implementation:
We iteratively de-
signed PROGDASH, which we then enhanced through
several informal discussions with members of the com-
pany and teachers from our first interviews. We de-
ployed a stable design of PROGDASH to the company’s
R&D team for usability feedback (see Section 6).
4. Field Study:
We conducted a three-month field
study with 17 teachers to capture teachers’ experi-
ence/perception of PROGDASH, and how it may assist
them in informing their practices (see Section 7).
Figure 1: Key steps of PROGDASH design process.
4 PROJET-VOLTAIRE PLATFORM
We collaborated with PROJET-VOLTAIRE, an online
platform for learning French vocabulary, grammar and
spelling rules. The platform is widely used by French
public and private schools (primary, middle, high
school and university). It can be used autonomously
or in-class, either projected on a whiteboard with class
exercises, or on personal computers.
Learning Process:
The platform centers around an
exerciser that adapts to learners’ skills in vocabulary,
spelling, and grammar. Learning is structured around
modules corresponding to a given level of expertise.
Each module has a set of stages that learners must
go through to master the level. A stage has a set of
grammar/spelling rules, corresponding to the concepts
that learners need to master. Each rule has a set of
exercises. Figure 2 shows typical questions on PROJET-
VOLTAIRE. Teachers can also set up class quizzes, i.e.,
short evaluations, typically carried out at the beginning
or the end of a course. PROJET-VOLTAIRE collects
the pertinent learning traces on learners (see Table 1),
PROGDASH: Lessons Learned from a Learning Dashboard In-the-wild
107
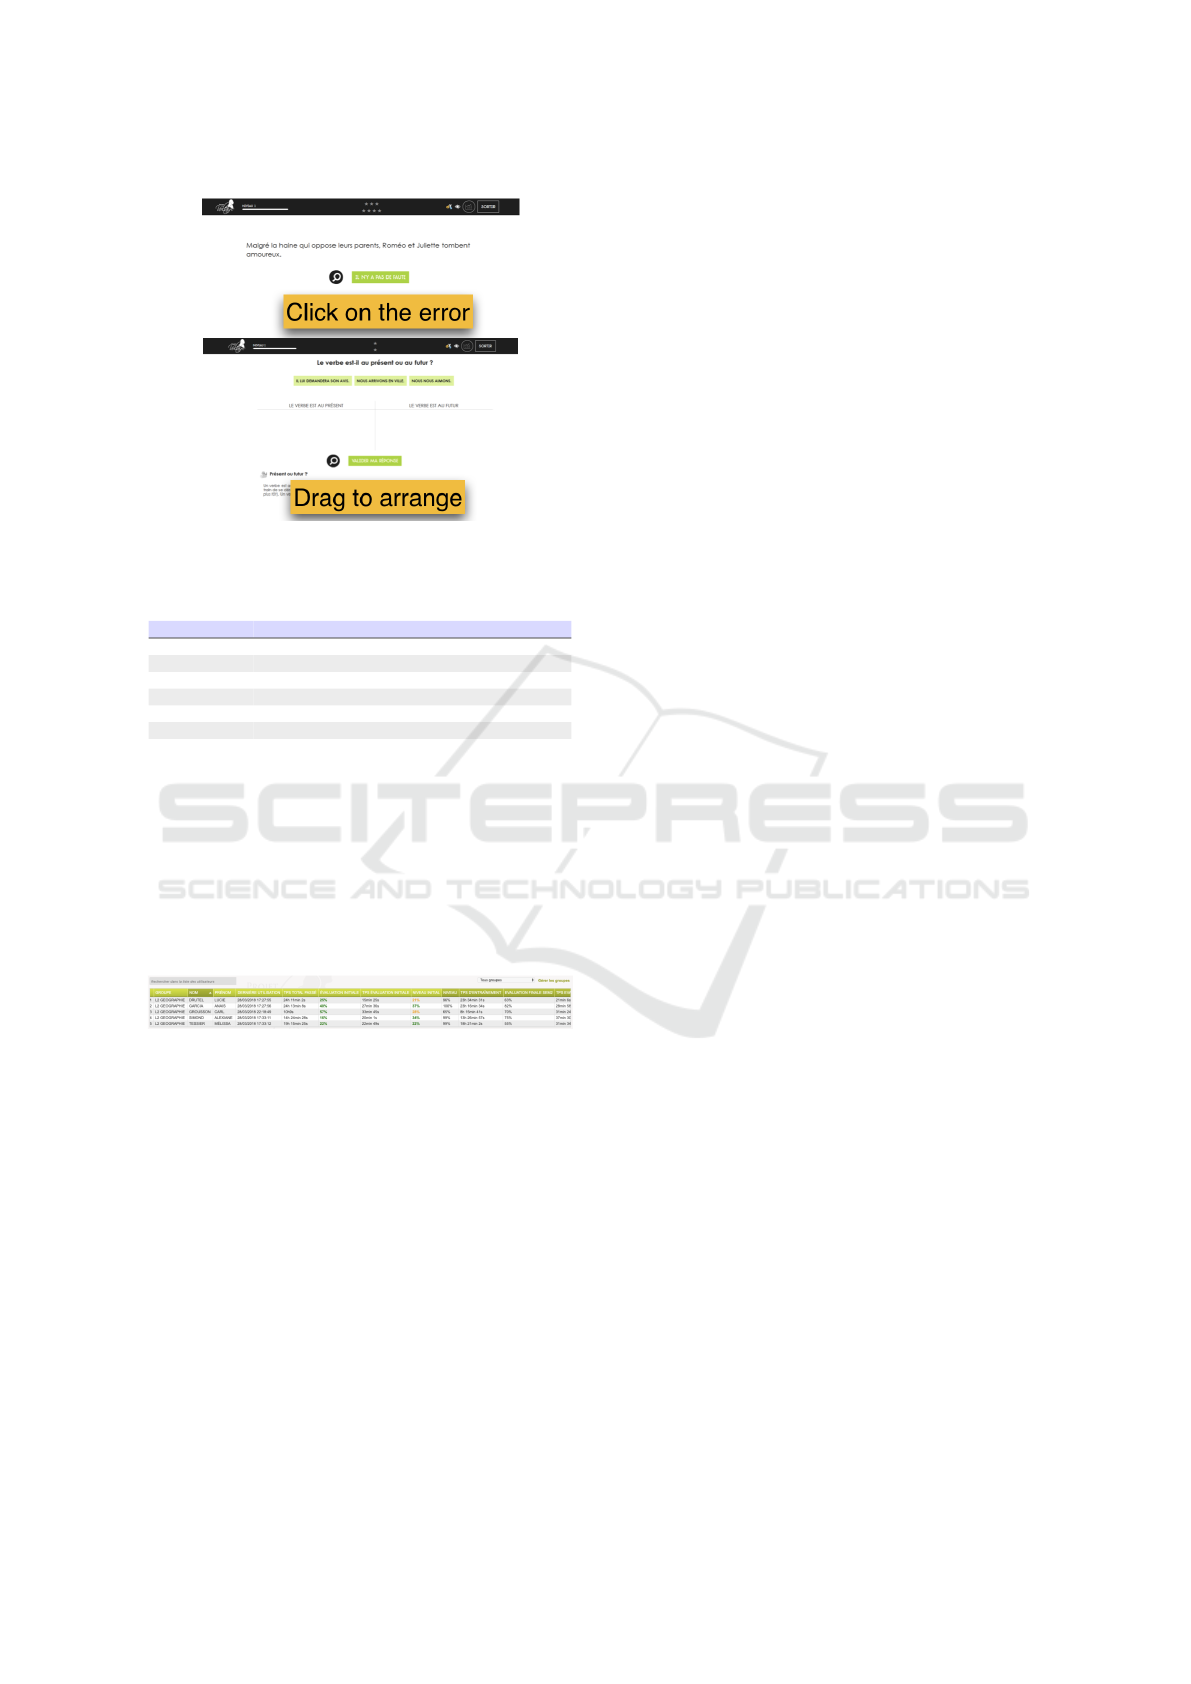
Figure 2: Example of exercises in PROJET-VOLTAIRE.
Table 1: PROJET-VOLTAIRE’s collected logs.
Attribute Description
Module Learning module(s) a learner is enrolled in
Stage level of difficulty of the module
Rules to master in each module
Exercises associated to a rule
Answers exercises’ answers (correct/incorrect)
Time-spent Time-spent to answer each exercise of a rule
which we used to build PROGDASH.
Learning Data:
Prior to our study, teachers had ac-
cess to a reporting table (see Figure 3). The table listed
learners with a set of indicators split across multiple
columns: time spent, score (%) of learner’s mastery,
initial level, scores and time spent on the programmed
quizzes, last connection, and rules acquired. Teachers
can also download a pdf report about each learner or
export the entire table as a spreadsheet file.
Figure 3: Example of a class report table.
5 TEACHERS’ NEEDS, AND
DESIGN GOALS
We conducted nine interviews with seven teachers to
understand (1) how they use the learning platform,
and (2) how they monitor learners’ progression. We
recruited teachers via the company’s education cus-
tomers’ team, and they received a book on the French
language as a thank-you gift. Interviews were audio-
recorded, and later transcribed and analyzed by the
main author to identify requirements in supporting
teachers.
Context of Use:
We identified three ways of how
teachers integrate PROJET-VOLTAIRE in their class-
rooms. First, as a learning material, they incorporate
platform-based activities in their curriculum with a
dedicated time-slot. Second, as a support material,
where teachers push learners to use the platform along-
side their course. And, finally, as a personalized aid
for specific learners, such as learners with grammar-
related disabilities, e.g., dyslexia, or with very poor
grammar skills.
Learning Progression:
Teachers characterize learn-
ers’ progression as (1) the levels and modules that
learners have reached, (2) the regularity of their prac-
tice, and (3) how skills develop over a period of time.
They highlighted the temporal nature of the learners’
progression, this is “hidden” in the existing reporting
table which displays only learners’ current state. This
causes learners’ progression – in sense of, e.g., unique
pathways, discrepancies, common strategies, similar
struggles; to become difficult for teachers to grasp.
Teachers reported relying on informal discussions with
learners to infer their progression and regularity of us-
ing the platform.
Informed Interventions:
Teachers often conduct inter-
ventions in-class to congratulate, encourage, remind,
or alert learners. They highlighted the complexity of
using the existing reporting table to keep track of learn-
ers’ online activity and to pinpoint gaps in learners’
progression, which hindered engaging in informed in-
terventions with learners, e.g., acquiring arguments for
debriefs and feedback. Also, when preparing a French
class, teachers expressed interest in knowing which
grammar concepts were not mastered by learners or
those that proved most tricky in order to tackle them
in class.
We derived the following design requirements from
our interviews:
R1:
Offer at-a-glance indicators to facilitate monitor-
ing of learners’ activity at class level by providing
summaries of learners’ overall practice, engagement,
and regularity in using the learning platform.
R2:
Provide indicators about learners’ practice to facil-
itate close monitoring at learner or group of learners’
level. Teachers emphasized the need for practicable
information enabling them to keep track of the status
of learners’ online activity on the platform.
R3:
Incorporate indicators about skills, i.e., grammar
concepts that are already mastered or prove challeng-
ing. In order to prepare class interventions or to help
individual learners, teachers expressed the need to un-
derstand what they should focus their interventions on,
based on learners’ difficulties.
R4:
Provide information about learners’ progression
over time. Teachers expressed the wish to grasp the
progression and regularity of practice over time. Learn-
CSEDU 2020 - 12th International Conference on Computer Supported Education
108

ers’ progression is multifaceted and depends on how
teachers and learners engage with the learning plat-
form. Relevant indicators include grammar concepts
mastered, time spent, and amount of exercises prac-
ticed.
6 PROGDASH USER INTERFACE
The main challenge in designing PROGDASH was
to condense all the information required in a small
visual space in order to clearly and directly inform
teachers about the state of learners’ progression. Fol-
lowing “overview first, zoom and filter, then details
on-demand” (Shneiderman, 2003), we structured the
information in four different views so that teachers
can drill down for more information as needed. We
adopted statistical and visual summarization tech-
niques (Sarikaya et al., 2018) to present relevant indi-
cators.
PROGDASH compiles metrics over the last 7 or the
last 30 days, and teachers can pick between these two
temporal windows. We combined textual, visual, and
color encoding when designing the dashboard to facili-
tate glanceable reading of the indicators. We provided
comparison and contextualization of PROGDASH’s in-
dicators by using bars to encode cells in tables and
line-charts to visualize learners’ progression paths. We
also added histograms and bar-charts in the headers
of tables’ columns to facilitate filtering and searching.
We provide supplementary online material about the
dashboard in this link.
Main View:
This view (Figure 4.A) presents overall
information to monitor learners’ activity at class level
(
R1
). It presents 12 metrics in a grid compiled for
the selected time window (7 or 30 last days, see Fig-
ure 4.a1). The grid is structured around three topics on
learning regularity, learners’ progression, and gram-
mar rules acquisition (see Table 2). The first row of
the grid provides the average number of acquired rules
per learner, the time spent as well as the total number
of active/inactive learners. The same widget is used to
show the name, the value, and the associated (+/-) delta
– change since the previous time window (7 or 30 days),
of each metric. The second row shows a timeline bar-
chart of learners’ connections per day. The third row
displays learners’ related metrics: score, commitment,
help, and dropout. The same widget is used to present
the full name of the learner, as well as the associated
value and (+/-) delta. The last row presents grammar
rules related metrics: in focus (currently in learning
by learners), acquired (already learned), and known
(already known) (Figure 4.B). The rules are sorted by
their level of difficulty exhibited by learners’ practice.
Table 2: Main view’s indicators within 7 or 30 days.
Attribute Description
Learning Regularity
Grammar
Rules
Avg. number of mastered grammar rules per learner, with the associ-
ated (+/-) delta of the selected time (Figure 4.a2).
Time Spent Avg. time spent learning per learner, with the associated (+/-) delta of
the selected time window (Figure 4.a3).
Active Learn-
ers
Number of active learners, with the associated (+/-) delta. Learner is
considered active if s/he makes at least one (in 7 last days) or 4 (in 30
last days) connections (Figure 4.a4).
Inactive
Learners
Number of inactive learners, with the associated (+/-) delta. Learner is
considered inactive if he/she makes zero (7 last days) or less than 4 (30
last days) connections window(Figure 4.a5).
Connections
Timeline
Total some of unique connections per day (Figure 4.a6).
Learners Progression
Score Top five learners in grammar rules acquisition (Figure 4.a7).
Commitment Top five learners in practicing on the platform (Figure 4.a8).
Help Top five learners struggling the most (Figure 4.a9).
Dropout Top five non-practicing the most (Figure 4.a10).
Grammar Rules Acquisition
In Focus Top five rules currently in acquisition, and leading to struggles to most
learners (Figure 4.a11).
Acquired Top five rules already acquired, although led to struggles to most
learners (Figure 4.a12).
Known Example of five rules already known by most learners (Figure 4.a13).
Teachers can select a set of rules and launch
Prac-
tice view
to practice them with learners live in-class
(Figure 4.C) (R3).
Practice View:
This view (Figure 4.E) enables close
monitoring of the most important indicators on learn-
ers’ activity at an individual and group level (
R2
). It
displays the list of learners in the class with a set of
associated metrics (learners’ Fullname, Score, Time
spent, Connections, Initial level score, Initial evalua-
tion score, Reached module) arranged in a tabular form
(see Table 3). The column headers are displayed ei-
ther as a histogram or a bar-chart according to whether
the column is categorical or nominal. Similarly, the
cells are encoded using bars to support comparison
between learners. Interaction with the headers through
filtering and sorting is provided to support searching
and to make scanning information easier. The table is
augmented with a line-chart of learners’ learning pro-
gression pathways in a timeline of all learning modules
in which learners may enroll (R4).
Evaluation View:
This view (Figure 4.D) displays the
list of learners’ metrics related to their evaluations, i.e.,
quizzes programmed by teachers (
R2
), in the same
Table 3: Practice view’s indicators.
Attribute Description
Learner Learner’s full name (Figure 4.e1).
Score Learner’s current score, that is, the number of rules known
+ acquired over the total number of rules in his/her learning
path, as both a percentage and a total number (Figure 4.e2).
Time Spent Time spent practicing on the platform (Figure 4.e3).
Connections Total number of connections on the platform (Figure 4.e4).
Last connection Last connection, as: since x hour/day/month(s)(Figure 4.e5)
Initial level Grammar rules that are initially known by a learner, as both a
percentage and a total number (Figure 4.e6).
Initial Evaluation Score at initial evaluation as a percentage of correct answers
(Figure 4.e7).
Reached Module Last module reached by learner in his/her learning path
(Figure 4.e8).
PROGDASH: Lessons Learned from a Learning Dashboard In-the-wild
109
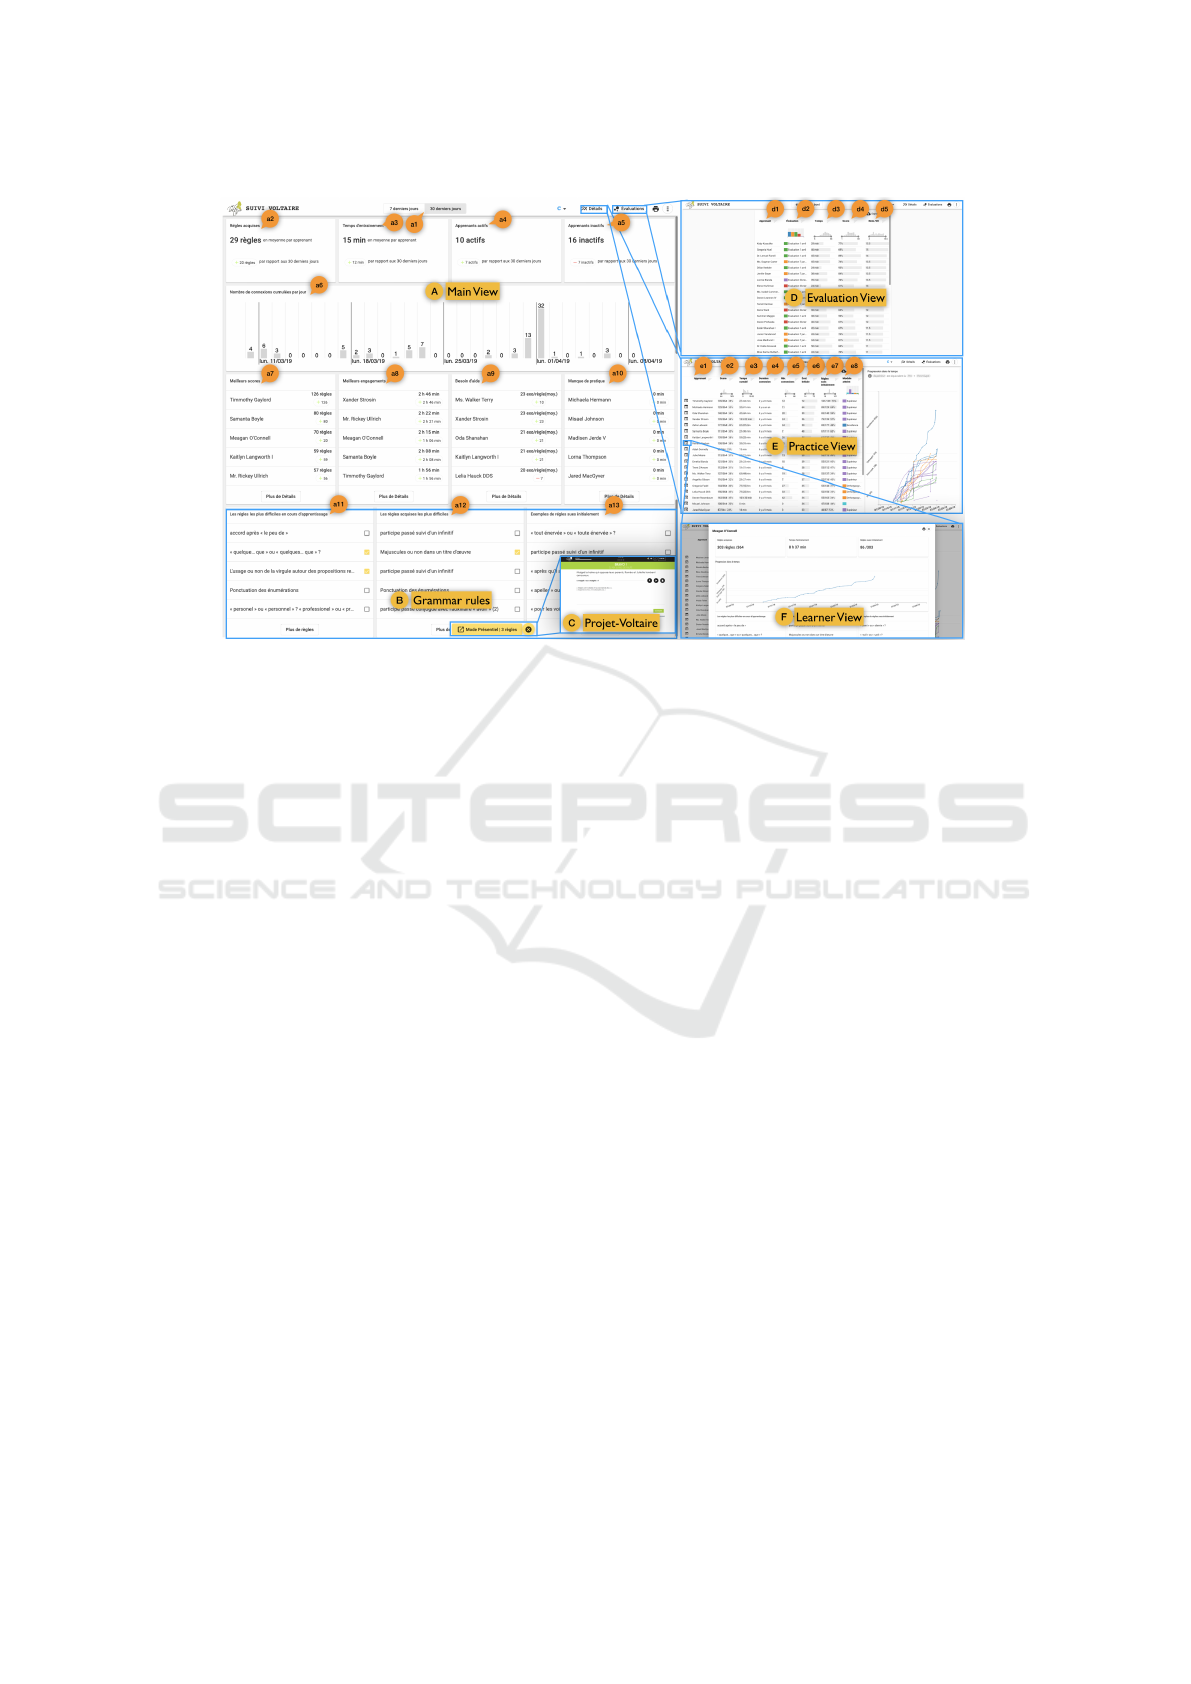
Figure 4: PROGDASH user interface.
tabular form as the Practice view. This includes the
learner’s name, the time spent on the evaluation, the
score obtained, as well as a corresponding derived
score on a scale of 20 (Figure 4.d1–5).
Learner View:
This view (Figure 4.F) is shown as a
dialog box that presents the main metrics of the learn-
ers in a grid form, in a similar way to the Main view.
This includes the current score, the time spent, the total
number of initially known rules, the learning progres-
sion line-chart, as well as grammar rules acquisition
related metrics (top five rules in focus (currently in
learning by learners), acquired (already learned) and
known (already known) (R2, R3).
Implementation:
PROGDASH user interface is built
using Typescript and Angular. The visualizations are
implemented using D3js. PROGDASH works in a
client/server fashion over REST web services. We
pull the data from the database and compile metrics of
the different views, before serving back to the browser
in JSON. For optimization purposes, data is cached on
the client for 1h before refreshing.
7 FIELD STUDY DESIGN
We deployed PROGDASH for three months between
March and June 2019. We aimed at investigating how
teachers used the dashboard to monitor learners’ pro-
gression. Specifically, we sought to answer two main
research questions:
•
Does PROGDASH provide teachers with useful in-
formation about learning progression?
•
How does PROGDASH inform teachers’ practices
in assessing learners’ online learning and conduct-
ing formative interventions?
7.1 Procedure
Deployment lasted three months for each teacher, split
into 3 phases: opening, deployment, and closing.
Participants:
We recruited 17 teachers via the
company’s newsletter (gender: [F=10, M=7], age:
[min=30, max=60], school: [Middle=6, High=4, Vo-
cational=7]). They all used PROJET-VOLTAIRE with
their learners. We informed teachers of the logging
implemented on the dashboard and their ability to with-
draw at any time. They gave us permission for collect-
ing and analyzing data.
Opening:
We started the study after we had recruited
11 participants. We continued to enroll participants
for two weeks afterwards. In the first week, we set
up a webinar as teachers resided in different locations.
We explained the main objectives of the study as well
as the different parts of PROGDASH to help them be-
come familiar with it. The webinar was recorded and
later shared, along with a pdf user guide, with all the
participants when they joined our study.
Deployment:
We informed the teachers that they
could use PROGDASH for a three-month period us-
ing dedicated web instance. Teachers used their own
devices to access the dashboard from their location.
Closing:
At the end, we asked the participants to fill
out a questionnaire to collect feedback about the use-
fulness and effectiveness of PROGDASH, as well as
CSEDU 2020 - 12th International Conference on Computer Supported Education
110

teachers’ practices. Later, a member of our research
team set up online semi-structured interviews with six
teachers. The interviews lasted 30 to 50 minutes. The
questionnaire and interviews focused on (1) teachers’
overall experience and perception in using PROGDASH
and (2) how teachers used the tool in practice.
7.2 Data Collection and Analysis
Logs:
We captured teachers’ actions on PROGDASH
with the associated timestamps.
Questionnaires:
During the opening, we asked the
participants to fill out a profile questionnaire to col-
lect demographics information. During the deploy-
ment phase, each week, we asked teachers to fill out
a simple diary questionnaire, asking if they had used
PROGDASH the week before, when and what for. We
gathered 16 (out of 17) participants’ responses to the
profile questionnaire, a total of 76 diary entries where
teachers reported whether or not they had checked
PROGDASH during the week [many times = 24 en-
tries, once = 15, no checks = 36], and 14 (out of 17)
responses to the ending questionnaire.
Interviews:
We audio-recorded the interviews and
followed Braun and Clarke (2006) thematic analysis:
1. Familiarizing with Data:
We manually transcribed
and pseudonymized the interviews. We then allocated
notes to interesting excerpts.
2. Initial Coding:
We transferred excerpts to a spread-
sheet and assigned them codes. We kept enough con-
text to ensure proper understanding. We duplicated
excerpts with multiple codes. We iterated on codes to
converge towards coherent sets.
3. Identifying Themes:
We iteratively piled and orga-
nized codes into themes, resulting in 20 initial themes.
4. Reviewing Themes:
We created a theme map from
the initial themes, which we discussed among co-
authors as suggested by (McDonald et al., 2019). We
decided to split some themes and to merge others,
resulting in 6 main themes. We kept representative
excerpts for each theme to ensure coherence.
5. Naming Themes:
We named and defined each
theme by its set of code excerpts. We then reviewed
coded excerpts to refine the reporting on each theme.
8 FIELD STUDY RESULTS
8.1 Teachers’ Overall Use
Participants’ interaction with PROGDASH evolved over
the course of the deployment. Our log data (Figure 5)
Figure 5: Teachers’ sessions using PROGDASH. Interviewed
teachers are marked with squares for French language teach-
ers, and with dots for other teachers.
shows less activity at the end than at the beginning of
the experiment, with school holidays in April account-
ing for a lesser use for two weeks.
Connections.
Log data showed that all teachers used
PROGDASH at least once. The 17 participants used the
tool 274 times in total [min=1, max=72, mean=16.1,
sd=21.2] (identified as accessing the dashboard and se-
lecting a class from the menu to explore AND counting
only single login sessions). P1 asked to withdraw after
using it 17 times, s/he explained that the dashboard
did not suit her/his needs of dealing with 25 groups of
learners, which s/he preferred to handle directly with
spreadsheet exports. Three teachers used it only once
(P12, P18, P24). Thirteen teachers used PROGDASH
three or more times.
PROGDASH Views.
Teachers used mostly the Main
and Practice views, followed by the Learner view, than
the Evaluation view (Table 4). Teachers in middle
schools used the Learner view less than in high or vo-
cational schools, mostly due to P9’s and P10’s exten-
sive use of it. In the post-questionnaire (14 responses
out of 17 participants), teachers expressed interest in
all PROGDASH’s views (Figure 6).
Teachers’ Overall Experience.
We asked teachers in
the post-questionnaire: “Would you like to continue
using the dashboard?”. All 14 out of the 17 who
filled out the questionnaire responded “Yes”. Simi-
larly, we asked participants “Would you recommend
the dashboard to a colleague already using PROJET-
VOLTAIRE?”, and their average rating (out of 14 re-
sponses) was above four on 5-point Likert scale. Over-
Table 4: Use of PROGDASH’s views, as count (#).
View Count Min Max Avg SD Vocational High Middle
Main view 300 1 73 17.6 22.8 100 81 119
Practice view 309 1 72 19.3 23.1 112 77 120
Learner view 207 1 137 18.8 39.8 37 33 137
Evaluation view 150 1 60 11.5 16.6 55 63 32
PROGDASH: Lessons Learned from a Learning Dashboard In-the-wild
111
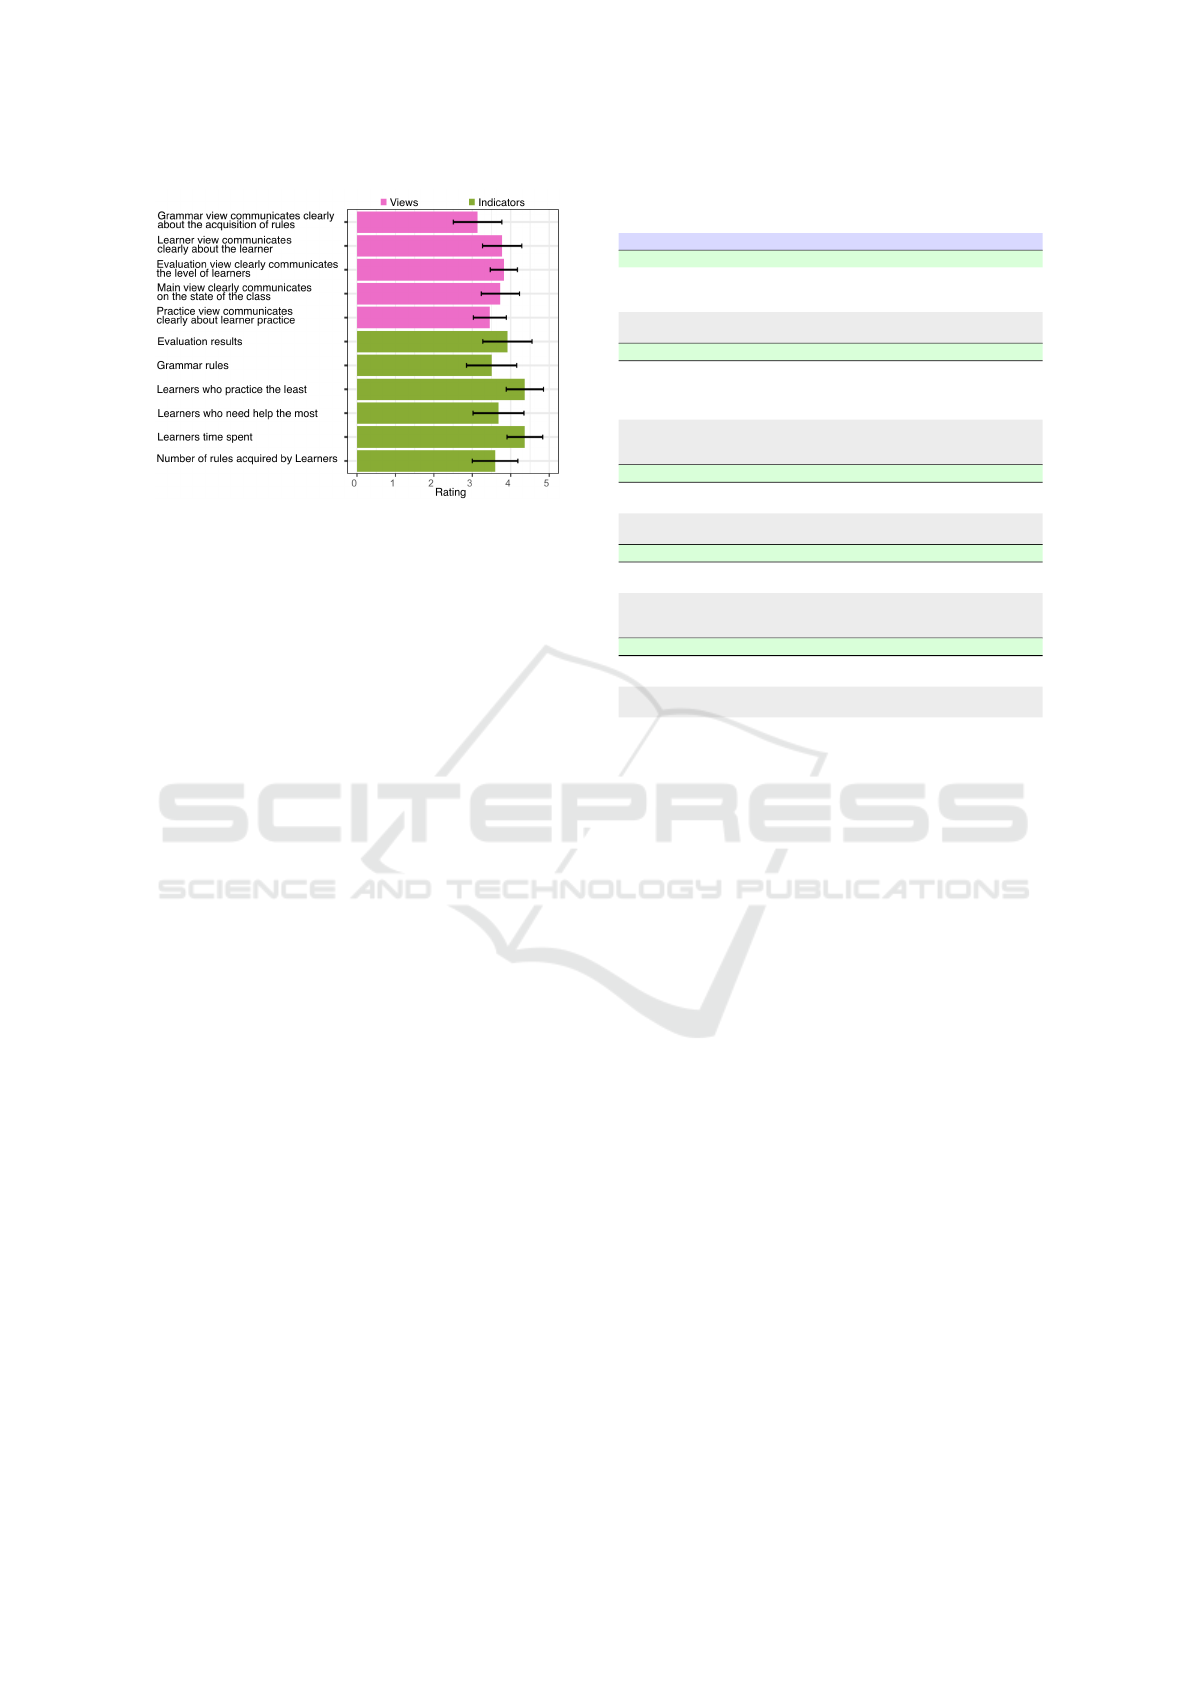
Figure 6: Teachers’ interest in PROGDASH’s views and indi-
cators on a scale of 0 to 5 with the confidence interval.
all, teachers were satisfied. They highlighted in their
diaries different features of PROGDASH, such as the
(1) visual aspect of the dashboard: “I like the graphics”
(– P5), “visual aspect of the class” (– P20), (2) learn-
ers’ progression: “progression line-charts are very
interesting” (– P22), “quick way to visualize learn-
ers’ trajectories or their connection to the platform”
(– P12), and (3) grammar acquisition: “ability to see
easily the levels learners reached and the number of
concepts acquired by each learner” (– P1), “many
more details and vision about learners who do nothing
to target them with exercises to do” (– P15).
Teachers’ Pain-points and Suggestions.
In their di-
aries and interviews participants noted some usabil-
ity issues and reported several suggestions. Teachers
wanted to identify learners who missed an evaluation
session. They had to look for blank cells in the ta-
ble to find those learners, which became tedious with
multiple evaluations per learner.
P22 stated that teachers must often cope with tech-
nical problems in the classroom, turning on the com-
puter, connecting, setting up PROGDASH, or any other
tool becoming too time-consuming. S/he suggested
simplifying it by making two modes: “a simple mode
and an expert mode. The simple mode needs to be
really ultra simple and ultra direct to track learners’
results, and when you want to move on to something
more advanced you can.” (– P22). S/he added by
pointing out the need for an automated weekly report
that could be sent by email to teachers as it might be
more practical to access and to use on his/her mobile
phone.
P14 highlighted his/her frustration with the design
of the grammar acquisition view as s/he needed to
be able to assign asynchronously specific concepts so
that learners could practice those concepts when they
launched the learning platform.
Table 5: Summary of teachers’ pedagogical practices
through the use of PROGDASH.
Teachers’ practices along with illustrative quotes
Monitoring learners’ progression
I really rely on the line-charts, I find them very telling [..] and immediately I see who
dropped out or not, after I look at the numbers, but I start by looking at the line-charts.
– P8
Often when I conduct my monitoring review, once a month, actually, I will dig deeper
[..] I will rather be in the exploratory but regarding a particular learner. – P14
Formative, Summative Assessments
Now, when we have the detailed list of all the [grammar] concepts, we know precisely
that if the learner no longer has this concept which is displayed – it means that it is
acquired [..]. Before s/he [a learner] used PROJET-VOLTAIRE yes! but what value?
does s/he learn no! we had to evaluate and conduct an evaluation. – P15
When we fill out learners’ transcripts in the school, there is a criterion: the ability
to ex-press oneself in writing with clarity and accuracy; of course, here we have
objective elements [meaning using PROGDASH] to check the boxe. – P9
Planning, Adjusting Interventions
We had planned to work on the homophones “en” and “on” and when I saw that it
was acquired by everybody, we did not do it. – P15
I use [PROGDASH] to adapt things when I realize that a language [grammar] element
is not mastered at all, I will change my plan to incorporate it. – P8
Sharing PROGDASH In-class With Learners
They [Learners] were pleading to have such information, to see how they progress. –
P8
I showed [PROGDASH] to learners [..] telling them that I could see everything that
happened. And, when they knew it, it changed [learners’ pace], because they didn’t
think we had access to it. – P15
Providing Feedback to Learners
It is rather to motivate them [learners], but it is also to sanction those who do not do
their job. – P8
I didn’t do a lot of close or individual monitoring with them [learners] except remind-
ing them that they had to use the app. – P14
P8 and P9 disagreed with the sampling choice of in-
dicators in the main view. For instance, P9 stated: “top
5 is not enough because it needed to be balanced to 35
[number of learners in the class], it must be a top 10”.
Similarly, regarding the top 5 samplings of grammar
concepts, P8 stated: “I really like to be able to choose
what I give to learners using PROJET-VOLTAIRE live
in the classroom”. Drawing a parallel with learners’
progression line-charts, P8 and P22 requested a time-
line for learners’ time spent on the platform.
8.2 Teachers’ Pedagogical Practices
Table 5 provides an overview of the pedagogical prac-
tices teachers developed with PROGDASH, and consid-
ered helpful.
Monitoring Learners’ Progression.
According to
log data, 13 (out of 17) teachers checked the dash-
board three or more times to monitor learners’ activity
on the learning platform (see Figure 5). Overall, in
their diary reporting, those teachers reported a total
of 35 checks of PROGDASH before a class [min=1,
max=8, mean=3.18, sd=2.08]. They reported doing
so to check learners’ status and to look for outliers,
either to encourage those practicing most or to talk
to those not practicing enough. Teachers used such a
strategy to provide the whole class with feedback . In
post-interviews, P8 stated: “I start by looking at the
line-charts, and I see who is doing very well – to be
able to congratulate and encourage them and who is
not doing too well. It allows me to talk to them the
CSEDU 2020 - 12th International Conference on Computer Supported Education
112

next day when I see them”.
Eight teachers reported in their diaries that they
checked PROGDASH during a class a total of 27
times [min=1, max=8, mean=3.37, sd=2.26]. In post-
interviews, two French teachers (P9, P15) emphasized
checking the dashboard during a class, while learners
were working on the learning platform, to check dis-
crepancies between learners’ progression in grammar
concept acquisition. P9 stated: “during the class when
they are in training, at a given time, I tell everyone to
stop where they are. I now have the goal to harmo-
nize the progression of the class, so I point to the gaps
between learners”.
Additionally, 13 teachers reported in their diaries
checking PROGDASH after a class for a total of 26
times [min=1, max=5, mean=2.00, sd=1.29]. Teach-
ers did so to inform follow-up debriefs with learners,
or just to check if learners were progressing as ex-
pected. In post-interviews, P15 stated looking at the
dashboard to check whether a learner had practiced a
list of grammar concepts using the platform: “I check
the next week, if s/he still has the same list [of gram-
mar concepts], then we will talk”. Teachers looked at
different dashboard indicators depending on the type
of interventions they anticipated. Learners’ time spent
on the platform was one of the most important indi-
cators for all teachers (see Figure 6). French teachers
who teach material related to grammar concepts or
who even use the learning platform in class, were inter-
ested in monitoring a combination of indicators about
learners’ progression, namely, the time spent on the
platform, the regularity of learning, pacing, and skills
development (P8, P9, P15).
Furthermore, teachers relied primarily on the line-
chart timeline to conduct overall monitoring first be-
fore drilling down for more details. In post-interviews,
four (out of six) teachers (P8, P5, P14, P22) high-
lighted the effectiveness of the line-charts in com-
paring learners’ progression and identifying extreme
learners: “the line-charts representation is interest-
ing because in the blink of an eye we can have the
progression of learners compared to each other” (–
P14). Three teachers (P8, P5, P14) stated that they
started their monitoring from the line-charts and then
looked at the numbers: “I really rely on the line-charts,
I find them very telling [..] and immediately I see who
dropped out or not, after I look at the numbers, but
I start by looking at the line-charts” (– P8). Finally,
two teachers (P14, P22) stated in post- interviews that
they conduct exploratory analyses using the dashboard.
P22 stated that s/he did so to explore out of curios-
ity: “it was mostly to see and do some monitoring, not
remediation. It was mostly to see [PROGDASH] out
of curiosity”. P14 stated that s/he often drilled down
regarding a specific learner: “often when I conduct
my monitoring review, once a month, actually, I will
dig deeper [..] I will rather be in the exploratory but
regarding a particular learner”.
Formative, Summative Assessments.
The dash-
board was instrumental to teachers as it provided on-
going feedback about learners’ online activity. This,
in part, supported teachers in conducting quick forma-
tive assessments about learners’ progression. In post-
interviews, P8 stated comparing without and with the
dashboard: “when I land on the dashboard, I see the
[grammar] concepts that are the most challenging for
learners [..] before I had to infer it, as learners were
the ones who informed me [during discussions]. Now
I have it directly on the dashboard: s/he [a learner]
doesn’t need to explain, and I see which concepts s/he
is struggling with”. Similarly, P15 stated: “[before
PROGDASH] we did not have the impression that we
have a value [from using PROJET-VOLTAIRE]. Now,
when we have the detailed list of all the [grammar]
concepts, we know precisely that if the learner no
longer has this concept which is displayed – it means
that it is acquired [..]. Before s/he [a learner] used
PROJET-VOLTAIRE yes! but what value? does s/he
learn [grammar concepts] no! we had to evaluate and
conduct an evaluation”.
Additionally, the dashboard supported teachers in
conducting summative assessments of learners’ pro-
gression at the end of the school year at the end of
some instructional unit. P9 described how the dash-
board provided objective facts for filling out evalua-
tion reports: “when we fill out learners’ transcripts
in the school, there is a criterion: the ability to ex-
press oneself in writing with clarity and accuracy; of
course, here we have objective elements [meaning us-
ing PROGDASH] to check the boxes”. Similarly, P8
stated using the dashboard to prepare a class council
meeting: “at the time of preparing the class council,
it allowed me to see [learners’ progression] in the
blink of an eye. It is a great tool to see whether learn-
ers’ work is steady over time, where s/he managed to
progress, where s/he didn’t”. On a class level, P15
reported using PROGDASH to evaluate grammar fun-
damentals among classes: “all the bottom part [of the
Main view] about [grammar] concepts [..], especially
the concepts that are already known [by learners], en-
abled us to see which classes had good fundamentals,
and that was interesting”.
Planning, Adjusting Interventions.
Teachers used
the dashboard to inform their in-class activities.
Among the 13 teachers who checked PROGDASH peri-
odically (three or more times), seven reported in their
diaries that they checked the dashboard to prepare a de-
brief. They also used it to adjust their teaching plans,
PROGDASH: Lessons Learned from a Learning Dashboard In-the-wild
113

assign work, or structure their classroom activities
(e.g., peer-tutoring).
In post-interviews, all the French teachers stated
that they used PROGDASH to adjust their lectures. P14
stated: “we had planned to work on the homophones
“en” and “on” and when I saw that it was acquired by
everybody, we did not do it”. Similarly, P8 stated: “I
use [PROGDASH] to adapt things when I realize that
a language [grammar] element is not mastered at all,
I will change my plan to incorporate it”. Only two
teachers (P15, P25) reported in diaries that they used
PROGDASH to prepare lesson content.
Teachers also used PROGDASH to target groups
of learners based on their difficulties. In fact, among
teachers who checked PROGDASH frequently (three or
more times), eight teachers stated that they look at the
dashboard to check the status of individual (or groups
of) learners. For instance, P14 stated: “what we found
interesting is having real information to know that this
learner has a problem with this rule, to be able to reuse
them in more individualized exercises in personalized
aid”. P9 stated “I will note on our digital working
space in bold characters, to tell them: ‘I warn you, I
checked the dashboard’. And, I will mark with a 56
font-size: ‘work on PROJET-VOLTAIRE’.”
In the post-interview, only P15 explained using
PROGDASH to set up peer-tutoring sessions: “I take
active learners [..] and I pick one learner with diffi-
culties and ask Paul [active one] to work with Pierre
[struggling], to show and explain”.
Sharing PROGDASH in-class.
The six teachers who
participated in post-interviews, stated that they used
PROGDASH to facilitate in-class debriefs, by showing
it to individuals or to the class. Two teachers (P8, P9)
stated that they shared the dashboard in-class to tell
learners about their indicators, and to enable them to
see their progression, as learners did not have access
to such information. P8 and P9 further reported that
learners “were pleading to have such information, to
see how they progress” (– P8) and they “ask to see
their line-charts” (– P9).
In post-interviews, five teachers (P8, P9, P15, P14,
P5) explained that they aimed at improving learners’
pacing by showing that they had indicators on their
practice on the learning platform. P15 stated: “I
showed [PROGDASH] to learners [..] telling them
that I could see everything that happened. And, when
they knew it, it changed [learners’ pace], because they
didn’t think we had access to it”.
Additionally, in post-interviews, all teachers re-
ported that they shared PROGDASH in-class to facil-
itate motivational debriefs with learners. Teachers
described different strategies to ensure that learners
maintain a steady practice. One was simply to al-
low learners to see their names among the top 5, or
bottom 5 learners, which, in part, helped stimulate
learners’ self-reflection and motivate them to practice
more. Similarly, P9 stated that showing the table in the
Practice view ordered by learners’ time spent online,
“triggered some sort of challenge, and they [learners]
worked harder”. Moreover, in post-interviews, all
teachers stated that they showed the progression of
line-charts to motivate learners. Its main role was
in “demonstrating the correlation” (P9, P22) between
practicing on a regular basis and learners’ progression.
Hence, showing progression over time was important
to emphasize the longitudinal nature of the learning
process. However, one teacher decided not to dis-
play the information to the whole class, and preferred
to provide one-to-one debriefs with learners, as s/he
thought that showing PROGDASH to the whole class
would stigmatize learners: “[PROGDASH] is some-
thing I keep for myself. I have to show it individually
[..] it stigmatizes learners, and right away they would
mock each other.” (– P5).
We did not anticipate that teachers would share the
dashboard live in-class. We discuss the ethical impli-
cations of such a practice in the discussion section.
Providing Feedback to Learners.
We identified dif-
ferent feedback strategies building on PROGDASH,
both at individual and class level. All the teachers
stated in the post-interviews that they reminded learn-
ers of the need to practice, often lecturing them briefly
about the importance of practicing on a regular basis
to maintain steady progress. Teachers either checked
learners’ status using PROGDASH before or during
a class to congratulate learners who were practicing
and provide public or private reminders to others who
were not. Moreover, French teachers in particular, con-
ducted individual debriefs with learners. For instance,
P9 stated: “I have split-classes, so I can do individual
debriefs. Learners come at the end of the class and ask
to see their line-charts”. Besides, feedback also took
the form of guidance regarding how to best use the
learning platform. P5 stated: “I tell them, take your
time [to read and understand grammar concepts], we
give you the concepts and examples so you can train
on short sentences, and after you can try again”.
In the post-interviews, teachers who did not teach
French (P14, P5, P22), reported that it was the learn-
ers responsibility to practice. They mostly provided
feedback regarding the efforts made by learners online
on the platform, e.g., time spent, and the number of
connections. Also, they often reminded learners of the
importance of mastering the language for their future,
or as stated by P14: “I explain to them their [future]
job, I train them to be assistant managers, so: ‘you
will have to write letters, emails [..]’ they will have a
CSEDU 2020 - 12th International Conference on Computer Supported Education
114

lot of written production”. Non-French teachers used
the learning platform in addition to their classes, e.g.,
marketing and management. They stated having little
time to provide formative feedback, and also that they
did not feel competent in providing formative feedback
to learners regarding grammar concepts, as they are
not specialized in French grammar. For instance, P14
stated: “I do not feel qualified to explain a [grammar]
concept, or other things, because I do not necessarily
master it myself”.
Limitations and Future Work.
Although we aimed
at including in the study teachers from different disci-
plines, and levels, e.g., middle, high, and vocational
schools, to gather realistic insights into teachers’ prac-
tices in using web-based online learning platforms,
teachers were self-selected to participate in this study.
Therefore, the results may reflect practices of moti-
vated profiles of teachers. Additionally, we asked
teachers to fill out a diary by sending them a weekly
email, which may have pushed teachers to check the
dashboard. Finally, our study is exploratory in nature,
as the learning platform we collaborated with has a di-
verse context of use in schools, thus making it difficult
to derive representative pedagogical practices of teach-
ers in their use of the dashboard. The next step would
be, for instance, to conduct a study centered around
each profile of teachers with respect to their context of
use of the learning platform. Further work is needed
to understand: how our results may generalize to other
online learning platforms, what is the impact of the
dashboard on learners, and investigate the design of
dashboards that connect teachers, learners, and others.
9 DISCUSSION AND DESIGN
IMPLICATIONS
In this section, we discuss our findings in relation to
previous work. We also suggest design implications
for dashboards in online learning settings.
Providing Insights into Learning Progression.
Our
findings show that PROGDASH was instrumental to
teachers in accomplishing different tasks. First, in
terms of monitoring, the dashboard surfaced infor-
mation previously invisible, and confirmed teachers’
intuitions about learners’ online progression that they
built from formal or informal discussions with learners
in the classroom. This corroborates prior results, par-
ticularly in improving teacher “visibility” of (Groba
et al., 2014) and “knowledge” about (Xhakaj et al.,
2017) learners’ online learning.
Additionally, the dashboard supported teachers in
conducting formative and summative assessments of
learners’ activity both during and at the end of instruc-
tional units, which suggests that dashboards may help
reduce assessment time as found in (Groba et al., 2014;
Govaerts et al., 2011). PROGDASH particularly sup-
ported French teachers in identifying those grammar
concepts where learners struggle most, and in adjust-
ing learning materials accordingly as found in (Xhakaj
et al., 2017; Molenaar and van Campen, 2017).
Understanding Individual and Group Progression.
PROGDASH highlighted the large variability of learn-
ers’ progression in the classroom, enabled by indica-
tors that categorize learners (e.g., top learners) and
by temporal visualizations (e.g., line-charts), which
highlight patterns of tendencies among learners. Also,
this corroborates prior results on dashboards as en-
ablers to identify trends, for instance in forum discus-
sions (Mazza and Dimitrova, 2007), learners’ note-
books (Yuan et al., 2008), and learners’ regulation in a
social network (Groba et al., 2014).
Additionally, teachers emphasized the effective-
ness of line-charts in understanding the temporal pro-
gression of learners, which supported the identification
of outliers, as in (Mazza and Dimitrova, 2007; Mole-
naar and van Campen, 2017). Importantly, line-charts
enabled teachers to grasp and understand the unique
progression of each learner. Teachers started their ex-
ploration of the dashboard by looking at line-charts
and then at numbers, as reported in post-interviews.
Line-charts also supported the comparison between
learners’ progression (P8, P5, P14, P22).
Supporting Effective Data-informed Practices.
Our study underlines critical implications of use of
teachers’ dashboards in contexts like ours, namely, spe-
cialized online learning platforms. That is, even if all
teachers in this study used PROJET-VOLTAIRE to help
learners improve their grammar skills with associated
grades, there was a divide in PROGDASH use. Teach-
ers who used the platform in their French language
courses, relied on different indicators of learners’ pro-
gression, including grammar concept acquisition, and
conducted different informed pedagogical interven-
tions: debriefing, feedback, peer-tutoring, and lessons.
On the other hand, teachers who used the platform
while teaching other disciplines, relied mainly on in-
dicators about learners’ efforts, such as the amount of
time invested online and the number of connections.
They were reluctant to provide formative feedback to
learners, e.g., related to grammar concepts, and thus
mainly lectured and reminded learners to use the learn-
ing platform on their own.
As a result, for instance, the type of feedback given
by teachers could have a mixed-effect on learners. That
is, in post-interviews, all teachers emphasized that
they “congratulate” top learners, while all non-French
PROGDASH: Lessons Learned from a Learning Dashboard In-the-wild
115

teachers relied mainly on “timespent” to devise their
feedback. For example, praising learners for task per-
formance is shown to be ineffective as “it contains
such little learning-related information” (Hattie and
Timperley, 2007). In part, this suggests the need to
train teachers to better support the intended use of such
learning platforms through dashboards. Also, in part,
it suggests the need for dashboards to facilitate find-
ing teachable elements so that a teacher can provide
effective and actionable feedback about learners’ pro-
gression. In fact, teachers’ feedback is more likely to
work when it is supportive, timely, and, importantly,
specific to the learning activity (Shute, 2008).
Anticipating, Facilitating in-class Use.
PROGDASH
supported teachers in engaging in informed debriefs,
e.g., “positive reinforcement”, “verbal warning” to
push learners to do their best, as was found in (Aslan
et al., 2019). Importantly, teachers shared the dash-
board with the whole class to support their debriefs for
three main reasons: transparency, to share informa-
tion with learners as they do not have access to such
dashboards (P9, P8); control, to let learners know that
teachers have precise indicators about their progres-
sion and pacing (P8, P9, P15, P14, P5); and for motiva-
tion, to foster self-reflection and stimulate challenge by
showing learners’ indicators about their progression.
This is very important as the dashboard fostered the di-
alog between teachers and learners in both directions,
as in some classes, learners asked teachers to debrief
them regarding charts on the dashboard. Such dialog
improved the learning experience in the classroom,
which would be lost if, for instance, the dashboard
was designed only for learners (Martinez-Maldonado
et al., 2015), or if the feedback was automated, e.g.,
programmed to learners, a practice found to be inef-
fective (Hattie and Timperley, 2007). However, we did
not anticipate that teachers would show the dashboard
in-class for debriefing with learners, or show informa-
tion on all learners to the whole class, and PROGDASH
was not designed for this purpose. This raises design
and ethical concerns, especially regarding showing full
names, rankings and learning data of all learners.
Additionally, in post-interviews, teachers empha-
sized their use of the dashboard in-class to foster learn-
ers’ motivation and self-reflection. This is very im-
portant as most teacher-facing dashboards, even those
designed to be used in classrooms (e.g., synchronous),
are not designed to be shared with learners to support
debriefs or feedback, even though dashboards can have
a positive effect on learners, as was found in (Aslan
et al., 2019; Holstein et al., 2018). Besides, although
we did not intend to support self-reflection by design
through PROGDASH, this observation is in-line with
the impact model of learning dashboards proposed by
Verbert et al. (2014).
These findings suggest the need for dashboards to
support in-class sharing with individuals and groups,
or for focused teaching interventions. However, dash-
boards need to be carefully designed to anticipate this
kind of emerging teachers’ practices.
10 CONCLUSION
We presented a design study of a dashboard to support
teachers in monitoring learners’ progression on an
online grammar and spelling learning platform. We
iteratively designed the dashboard with teachers, and
we integrated it on a widely used platform. The result
of this work is PROGDASH.
We presented the results of a 3-month field study
of a dashboard in-the-wild, with 17 teachers, from dif-
ferent schools. Our results show that teachers used
the dashboard at different times (before, during and
after a course) and for different purposes: monitoring,
formative, summative assessments, and planning inter-
ventions. Teachers shared the dashboard with learners
for transparency, control, and motivational purposes,
to support debriefs and in-class interventions. Teach-
ers used PROGDASH to provide feedback to learners
at both class and individual level. Our results high-
light a divide between the practices of teachers teach-
ing French language and those using the platform for
extra-curricular learning. Based on our findings, we
suggest directions on how teachers’ dashboards could
better bridge online and in-class learning.
REFERENCES
Aslan, S., Alyuz, N., Tanriover, C., Mete, S. E., Okur, E.,
D
'
Mello, S. K., and Esme, A. A. (2019). Investigating
the impact of a real-time, multimodal student engage-
ment analytics technology in authentic classrooms. In
Proceedings of the 2019 CHI Conference on Human
Factors in Computing Systems - CHI '19. ACM Press.
Black, P. and Wiliam, D. (1998). Assessment and classroom
learning. Assessment in Education: principles, policy
& practice, 5(1):7–74.
Bodily, R., Kay, J., Aleven, V., Jivet, I., Davis, D., Xhakaj,
F., and Verbert, K. (2018). Open learner models and
learning analytics dashboards: A systematic review. In
Proceedings of the 8th International Conference on
Learning Analytics and Knowledge, LAK ’18, pages
41–50, New York, NY, USA. ACM.
Braun, V. and Clarke, V. (2006). Using thematic analysis
in psychology. Qualitative research in psychology,
3:77–101.
Carrillo, R., Renaud, C., Pri
´
e, Y., and Lavou
´
e,
´
E. (2017).
Dashboard for monitoring student engagement in mind
CSEDU 2020 - 12th International Conference on Computer Supported Education
116

mapping activities. In 2017 IEEE 17th Interna-
tional Conference on Advanced Learning Technologies
(ICALT), pages 433–437. IEEE.
Chetlur, M., Tamhane, A., Reddy, V. K., Sengupta, B., Jain,
M., Sukjunnimit, P., and Wagh, R. (2014). Edupal:
Enabling blended learning in resource constrained en-
vironments. In Proceedings of the Fifth ACM Sympo-
sium on Computing for Development, ACM DEV-5
’14, pages 73–82, New York, NY, USA. ACM.
Dow, S. P., Glassco, A., Kass, J., Schwarz, M., Schwartz,
D. L., and Klemmer, S. R. (2011). Parallel prototyping
leads to better design results, more divergence, and
increased self-efficacy. In Design Thinking Research,
pages 127–153. Springer Berlin Heidelberg.
Dyckhoff, A. L., Zielke, D., B
¨
ultmann, M., Chatti, M. A.,
and Schroeder, U. (2012). Design and implementation
of a learning analytics toolkit for teachers. Journal of
Educational Technology & Society, 15(3):58–76.
Ez-zaouia, M. (2020). Teacher-centered design process.
Proceedings of the 2nd International Workshop on Ex-
plainable Learning Analytics, Companion Proceedings
10th International Conference on Learning Analytics
& Knowledge.
Ez-zaouia, M. and Lavou
´
e, E. (2017). Emoda: A tutor ori-
ented multimodal and contextual emotional dashboard.
In Proceedings of the Seventh International Learning
Analytics & Knowledge Conference, LAK ’17,
pages 429–438, New York, NY, USA. ACM.
Ez-zaouia, M., Tabard, A., and Lavou
´
e, E. (2020). Emodash:
A dashboard supporting retrospective awareness of
emotions in online learning. International Journal of
Human-Computer Studies, 139:102411.
Florian-Gaviria, B., Glahn, C., and Gesa, R. F. (2013). A
software suite for efficient use of the european qualifi-
cations framework in online and blended courses. IEEE
Transactions on Learning Technologies, 6(3):283–296.
Govaerts, S., Verbert, K., and Duval, E. (2011). Evaluating
the student activity meter: Two case studies. In Ad-
vances in Web-Based Learning - ICWL 2011, pages
188–197. Springer Berlin Heidelberg.
Greiffenhagen, C. (2011). Making rounds: The routine work
of the teacher during collaborative learning with com-
puters. International Journal of Computer-Supported
Collaborative Learning, 7(1):11–42.
Groba, A. R., Barreiros, B. V., Lama, M., Gewerc, A., and
Mucientes, M. (2014). Using a learning analytics tool
for evaluation in self-regulated learning. In 2014 IEEE
Frontiers in Education Conference (FIE) Proceedings,
pages 1–8. IEEE.
Hattie, J. and Timperley, H. (2007). The power of feedback.
Review of educational research, 77(1):81–112.
Holstein, K., McLaren, B. M., and Aleven, V. (2018). Stu-
dent learning benefits of a mixed-reality teacher aware-
ness tool in AI-enhanced classrooms. In Lecture Notes
in Computer Science, pages 154–168. Springer Inter-
national Publishing.
Kitto, K., Cross, S., Waters, Z., and Lupton, M. (2015).
Learning analytics beyond the lms: the connected
learning analytics toolkit. In Proceedings of the Fifth
International Conference on Learning Analytics And
Knowledge, pages 11–15. ACM.
Martinez-Maldonado, R., Clayphan, A., Yacef, K., and Kay,
J. (2015). Mtfeedback: Providing notifications to en-
hance teacher awareness of small group work in the
classroom. Learning Technologies, IEEE Transactions
on, 8:187–200.
Mazza, R. and Dimitrova, V. (2007). CourseVis: A graphical
student monitoring tool for supporting instructors in
web-based distance courses. International Journal of
Human-Computer Studies, 65(2):125–139.
McDonald, N., Schoenebeck, S., and Forte, A. (2019). Reli-
ability and inter-rater reliability in qualitative research:
Norms and guidelines for cscw and hci practice. Proc.
ACM Hum.-Comput. Interact., 3(CSCW):72:1–72:23.
Michel, C., Lavou
´
e, E., George, S., and Ji, M. (2017). Sup-
porting awareness and self-regulation in project-based
learning through personalized dashboards. 9(2/3):204–
226.
Molenaar, I. and van Campen, C. K. (2017). Teacher
dashboards in practice: Usage and impact. In Data
Driven Approaches in Digital Education, pages 125–
138. Springer International Publishing.
Mottus, A., Kinshuk, Graf, S., and Chen, N.-S. (2014). Use
of dashboards and visualization techniques to support
teacher decision making. In Ubiquitous Learning Envi-
ronments and Technologies, pages 181–199. Springer
Berlin Heidelberg.
Sarikaya, A., Gleicher, M., and Szafir, D. A. (2018). Design
factors for summary visualization in visual analytics.
Computer Graphics Forum, 37(3):145–156.
Schwendimann, B. A., Rodriguez-Triana, M. J., Vozniuk,
A., Prieto, L. P., Boroujeni, M. S., Holzer, A., Gillet,
D., and Dillenbourg, P. (2017). Perceiving learning
at a glance: A systematic literature review of learning
dashboard research. IEEE Transactions on Learning
Technologies, 10(1):30–41.
Sedlmair, M., Meyer, M., and Munzner, T. (2012). Design
study methodology: Reflections from the trenches and
the stacks. IEEE Transactions on Visualization and
Computer Graphics, 18(12):2431–2440.
Shneiderman, B. (2003). The eyes have it: A task by data
type taxonomy for information visualizations. In The
Craft of Information Visualization, pages 364–371. El-
sevier.
Shute, V. (2008). Focus on formative feedback. Review of
Educational Research, 78:153–189.
Siemens, G. and Baker, R. S. (2012). Learning analytics and
educational data mining. In Proceedings of the 2nd
International Conference on Learning Analytics and
Knowledge - LAK '12. ACM Press.
Technavio (2016). Digital classroom market will grow at an
impressive cagr of almost 13% until 2020.
Verbert, K., Govaerts, S., Duval, E., Santos, J. L., Van Ass-
che, F., Parra, G., and Klerkx, J. (2014). Learning
dashboards: an overview and future research opportuni-
ties. Personal and Ubiquitous Computing, 18(6):1499–
1514.
Xhakaj, F., Aleven, V., and McLaren, B. M. (2017). Effects
of a dashboard for an intelligent tutoring system on
teacher knowledge, lesson plans and class sessions. In
Lecture Notes in Computer Science, pages 582–585.
Springer International Publishing.
Yuan, S., Tabard, A., and Mackay, W. (2008). Streamliner:
A general-purpose interactive course-visualization tool.
In 2008 IEEE International Symposium on Knowledge
Acquisition and Modeling Workshop, pages 915–919.
Zapata-Rivera, D. and Katz, I. (2014). Keeping your audi-
ence in mind: applying audience analysis to the design
of interactive score reports. Assessment in Education
Principles Policy and Practice, 21.
PROGDASH: Lessons Learned from a Learning Dashboard In-the-wild
117
