
An Approach for Deriving, Analyzing, and Organizing Requirements
Metrics and Related Information in Systems Projects
Ibtehal Noorwali
1
, Nazim H. Madhavji
1
and Remo Ferrari
2
1
Computer Science Department, The University of Western Ontario, London, Ontario, Canada
2
Siemens Mobility, New York, NY, U.S.A.
Keywords:
Requirements Metrics, Requirements Management, Measurement Approach.
Abstract:
Large systems projects present unique challenges to the requirements measurement process: large sets of re-
quirements across many sub-projects, requirements existing in different categories (e.g., hardware, interface,
software, etc.), varying requirements meta-data items (e.g., ID, requirement type, priority, etc.), to name few.
Consequently, requirements metrics are often incomplete, metrics and measurement reports are often unor-
ganized, and meta-data items that are essential for applying the metrics are often incomplete or missing. To
our knowledge, there are no published approaches for measuring requirements in large systems projects. In
this paper, we propose a 7-step approach that combines the use of the goal-question-metric paradigm (GQM)
and the identification and analysis of four main RE measurement elements: attributes, levels, metrics, and
meta-data items—that aids in the derivation, analysis, and organization of requirements metrics. We illustrate
the use of our approach by applying it to real-life data from the rail automation systems domain. We show how
the approach led to a more comprehensive set of requirements metrics, improved organization and reporting
of metrics, and improved consistency and completeness of requirements meta-data across projects.
1 INTRODUCTION
In large systems projects, deriving and organizing re-
quirements metrics and and related information (e.g.,
meta-data items, measures, and metric labels) can
be complicated and laborious due to such factors as:
large volume of requirements; inconsistent require-
ments meta-data across sub-projects; and complex-
ity in requirements baselines (that contain categories
such as interface, hardware, software, each of which
has its own set of metrics). In addition, the derived re-
quirements metrics are numerous, often unstructured
and unorganized, and can be difficult to assess with
respect to completeness.
Existing measurement methods are aimed at either
selecting and specifying a set of metrics that address
certain project goals (e.g., GQM(Basili et al., 1994)
and V-GQM(Olsson and Runeson, 2001)) or docu-
menting metrics and measurement reports through
templates (Goethert and Siviy, 2004; Bonelli et al.,
2017). For example, GQM (Basili et al., 1994) aids in
documenting assessment or improvement goals and
in deriving the questions and metrics that address
these goals, all hierarchically represented. Mean-
while, measurement templates (Goethert and Siviy,
2004) help in recording data corresponding to the
metrics.
However, once the hierarchy of goals-questions-
metrics is identified and prior to gathering measures
in templates, we are left with at least the following
questions: What requirements meta-data items (e.g.,
release number, status, feature ID) do we need to ap-
ply the metrics? Are any metrics missing that may af-
fect the investigation? How do we organize and struc-
ture these metrics for reporting?
These questions are important because they im-
pact the time needed to define, apply, and organize
the measures for dissemination, quality of generated
reports, completeness and consistency of the met-
rics, and completeness and consistency of the meta-
data. In other words, these questions correspond to
the structure that helps in organising and operational-
izing the use of metrics in large, systems engineering
projects. To our knowledge, the scientific literature
does not contain such a structure that bridges the gap
between intention (e.g., the GQM-like hierarchy) and
use of metrics in actual projects.
In this paper, we show what the bridging struc-
ture is and how to use this structure through a 7-step
process to derive and organize requirements metrics
(Section 3). Specifically, in this process, GQM is first
used to identify measurement goals, questions, and an
initial set of corresponding metric descriptions. Re-
quirements attributes (e.g., volatility, coverage, and
Noorwali, I., Madhavji, N. and Ferrari, R.
An Approach for Deriving, Analyzing, and Organizing Requirements Metrics and Related Information in Systems Projects.
DOI: 10.5220/0009424501930203
In Proceedings of the 15th International Conference on Evaluation of Novel Approaches to Software Engineering (ENASE 2020), pages 193-203
ISBN: 978-989-758-421-3
Copyright
c
2020 by SCITEPRESS – Science and Technology Publications, Lda. All rights reserved
193
growth) and levels (e.g, feature, release, and safety)
are then identified for the initial set of metrics. We
then identify all the possible attribute-level combi-
nations (e.g., feature growth, and release volatility)
and map the identified metrics onto the attribute-level
combinations. The metric gaps are then identified
and their missing metrics are derived. Finally, the
meta-data (e.g., release number, feature ID, safety rel-
evancy) for each metric is identified. By the end of
this process, we should have a complete set of require-
ments metrics at the identified attribute-level combi-
nations with the meta-data items required to apply
them.
By applying our approach on data from an
industrial-scale rail automation systems project, we
discuss the observed benefits of its application (Sec-
tion 4). The benefits included reduction of require-
ments measurement time, improved organization and
structure of data, improved breadth of metrics, and
improved completeness and consistency of meta-data
across projects. We then discuss the implications of
our work (Section 5.1) and its limitations (Section
5.2). Finally, we conclude the paper and discuss fu-
ture work (Section 6).
2 BACKGROUND AND RELATED
WORK
Table 1 gives examples of the foundational terms used
in this paper.
Table 1: Terminology and examples.
Term Examples
Requirement
attribute
Size, growth, volatility, quality, etc.
Requirement
level
Requirement organization cate-
gories such as features, baselines,
releases, etc.
Metrics # of additions, # of deletions, # of
modifications per baseline
Meta-data Data about requirements: ID, Type,
rationale, source, etc.
Section 2.1 describes the general measurement pro-
cess (IEEE, 2017) and how our approach fits within
that process followed by a literature survey on mea-
surement frameworks and approaches. In Section 2.2,
we describe the research gap.
2.1 Measurement Frameworks,
Approaches, and Tools
A typical measurement process consists of establish,
prepare, perform, evaluate phases (IEEE, 2017; Ebert
and Dumke, 2007) where: establish involves plan-
ning and resource allocation; prepare involves defin-
ing measurement strategy, information needs, detailed
procedures, services and technologies to be used; per-
form phase involves executing the procedures and re-
porting the results; and evaluate involves assessing
the products, the measurement process, and identify-
ing potential improvements. Our approach fits within
the prepare phase.
In this subsection, we focus our discussion on
measurement frameworks and approaches that are
usually employed in the prepare phase of the mea-
surement process. Such frameworks and approaches
usually answer the ‘why’ and ‘what’ of measurement
and can be used on the organizational, project, or
process levels. There are several high-level, end-to-
end empirical paradigms of which we cover a sample.
For example, ’Measurement and Analysis’ is one of
the CMMI (Capability Maturity Model Integration)
(CMMI Product Team, 2006) process areas consist-
ing of practices and guidelines such as specifying
measurement objectives, specifying measures, anal-
ysis techniques, data collection and reporting tech-
niques, implementing analysis techniques and provid-
ing objective results.
The Model-Measure-Manage (M3p) paradigm
(Offen and Jeffery, 1997) consists of eight stages
from understanding the business strategy and goals,
to defining development goals, questions, and iden-
tifying and defining measures, to setting up the
measurement program, and regularly reviewing it.
‘Application of metrics in industry’ (AMI) (Rowe
and Whitty, 1993) consists of an ‘assess-analyze-
measure-improve’ cycle. Similarly, Six Sigma (Ten-
nant, 2001) incorporates a ‘define, measure, analyze,
improve and statistical control’ process.
These higher-level paradigms employ lower level
tools, templates, and approaches to operationalise the
approaches. An example is the GQM framework
(Basili et al., 1994), which defines a set of measure-
ment goals that are refined into a set of quantifiable
questions. In turn, specific metrics are identified to
address each question. Recently, a strategic aspect
(S) has been incorporated to help in aligning goals to
organisational strategies (Basili et al., 2014). Anal-
ogously, templates (Goethert and Siviy, 2004) add
an intermediate step to GQM to assist in linking the
questions to measurement data that will be gathered.
Similarly, ASM.br (Bonelli et al., 2017) is a template
ENASE 2020 - 15th International Conference on Evaluation of Novel Approaches to Software Engineering
194

that allows specifying metrics in a form in which tex-
tual and graphical information is recorded, and the re-
lationships between metrics and goals are explicitly
presented.
2.2 Analysis and Research Gap
While the above surveyed approaches and templates
can be utilized for measurement in RE, they do not
address the specific challenges we discussed in the
introduction (i.e., unstructured and unorganized met-
rics, missing metrics, and missing meta-data). For ex-
ample, let us assume that we used GQM to derive the
set of metrics in Table 2, which is part of a larger set
being used in the requirements management process.
Upon derivation, the metrics lack a coherent structure
as to which metrics belong with each other. Moreover,
we have no method to assess whether there are miss-
ing metrics. The above surveyed approaches aid in
either deriving the initial set of metrics or document-
ing the metrics in templates. To our knowledge, an
approach that addresses the specific challenges of un-
structured and unorganized metrics, missing metrics,
and missing meta-data does not exist.
Table 2: Example requirements metrics derived using
GQM.
Metric
ID
Metric Description
M1 No. of requirements per baseline
M2 No. of modified requirements per feature
baseline
M3 No. of safety critical requirements per
baseline
M4 No. of requirements per release per base-
line
M5 No. of deleted requirements per feature
baseline
In this respect, our approach would be considered
an intermediary step or middleware between metric
derivation approaches such as GQM (Basili et al.,
1994) and and using templates to document met-
rics (Goethert and Siviy, 2004; Bonelli et al., 2017).
Specifically, our approach aids in the selection of RE
metrics (through GQM) and the analysis and reason-
ing about the metrics with respect to completeness,
structure, and requirements meta-data collection (see
Section 3).
3 THE APPROACH
As mentioned earlier in Section 1, the purpose of
our approach is to facilitate the requirements mea-
surement process through: 1) deriving RE metrics,
2) analyzing the metrics for completeness, 3) struc-
turing and organizing the metrics, and 4) specifying
the meta-data needed for the metrics. The approach is
depicted in Figure 1.
The first step is executed using GQM (Basili et al.,
1994) to derive an initial set of requirements metrics
that address the internal stakeholders’ goals and con-
cerns. The second step is performed to identify the
requirements attributes (e.g., size, volatility) that the
derived metrics are measuring while the third step
identifies the requirements levels (e.g., baseline, re-
lease) at which the metrics exist. In the fourth step,
we create all possible combinations of attributes and
levels (e.g., baseline X size, release X volatility). In
the fifth step, we map the derived metrics in Step 1 to
the attribute-level combinations and identify the com-
binations that do not have associated metrics. Step
6 is performed to derive the metrics for the empty
attribute-level combinations. Finally, in the seventh
and last step, the requirements meta-data items for the
complete set of metrics are identified. The approach
combines the seven steps to tackle the following prac-
tical questions:
1. What RE metrics will address the given internal
stakeholders’ concerns?
2. What RE attributes are the metrics measuring?
3. How do we categorize and organize the derived
metrics for archiving and reporting?
4. Are there any metrics missing that we are not
aware of?
5. What meta-data do we need to gather in order to
apply the metrics?
Step 1: Derive Initial Set of Metrics. The first step
is to derive an initial set of metrics that address the
internal stakeholders’ concerns regarding the require-
ments. GQM is a suitable method to use for this step
that ensures that the derived metrics in fact address
internal stakeholder concerns and are not superfluous.
The GQM approach consists of identifying the goals
the internal stakeholders of a project would like to
achieve through the metrics. Following the goals, the
operational questions that address those goals are sub-
sequently identified and, finally, the metrics that an-
swer the respective questions are derived. Thus, the
output of the Step 1 is an initial set of requirements
metrics. Table 3 shows an example of a goal and its
respective questions and requirement metrics.
An Approach for Deriving, Analyzing, and Organizing Requirements Metrics and Related Information in Systems Projects
195
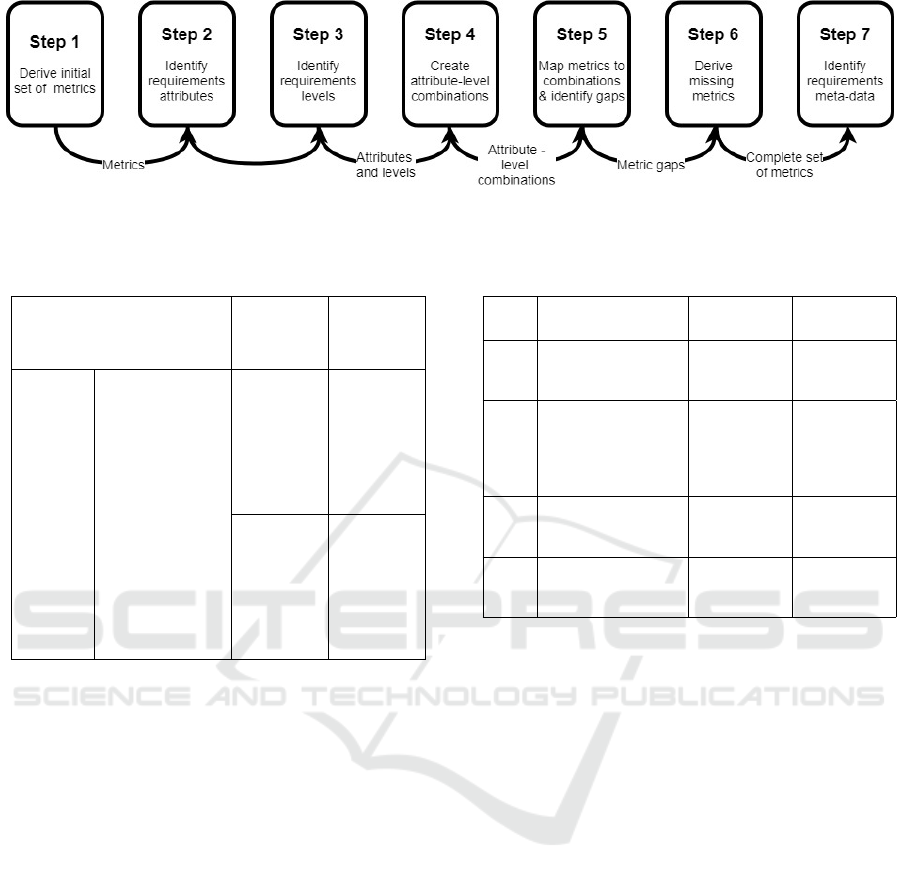
Figure 1: The proposed approach.
Table 3: An example of using GQM to derive requirements
metrics.
Goal Questions Metrics
Purpose: Monitor
Q1. What
is the over-
all state of
requirements-
design cover-
age?
M1. No.
of require-
ments that are
covered by
design objects
per baseline
Issue: the status of
Object:
requirements-design
links
Q2. What is
the state of
requirements-
design cov-
erage for
release X?
M2. No. of
requirements
in latest base-
line that are
covered by
design and
are assigned
to release X
Viewpoint:
from the system’s
manager’s viewpoint
Step 2: Identify Requirements Attributes. Depend-
ing on how the goals and questions are formulated, the
corresponding metrics can be derived without know-
ing the requirement attribute we are measuring. For
example, it is not clear what requirement attribute M1
and M2 in Table 3 are measuring. Is it requirements
status or requirements coverage? Thus, after the ini-
tial set of requirement metrics have been derived us-
ing GQM, we perform a first round of analysis of the
metrics to answer the question: what requirement at-
tribute is each metric is measuring? This step aids
in acquiring a clear and unambiguous understanding
of the requirements attributes being measured, which
is essential for accurate measurements (Briand et al.,
1996) and for reasoning about the derived metrics.
For example, when applying Step 2 we realize that
all the derived metrics from Step 1 are measuring
requirements volatility, then we can begin reasoning
whether we need other metrics that measure other at-
tributes such as coverage, size, and creep, etc. Thus,
we begin addressing the issue of missing metrics. In
addition, this step begins giving the derived metrics a
structure.
The output of Step 2 is a list of requirements at-
Table 4: Example requirements metrics, attributes, and lev-
els.
Metric
ID
Requirement Metric Requirement
Attribute
Requirement
Level
M1 No. of requirements
in latest baseline that
are covered by design
Coverage Baseline
M2 No. of requirements
in latest baseline that
are covered by design
and are assigned to re-
lease X
Coverage Release
M3 No. of requirements
per feature per base-
line
Size Feature
M4 No. of added, deleted
and modified require-
ments per baseline
Volatility Baseline
tributes. The ‘Requirement Metric’ and ‘Requirement
Attribute’ columns in Table 4 show a sample of re-
quirements metrics and their corresponding attributes.
Step 3: Identify Requirements Metric Levels.
Similar to the way requirements are organized,
whether implicitly or explicitly, according to differ-
ent categories or levels (e.g., functional and non-
functional, features and releases), the derived require-
ments metrics will also exist at different requirements
metric levels. Thus this step is concerned with an-
swering the question: what level of requirements is
the derived metric concerned with? The identification
of requirements metric levels gives further structure
to the derived metrics and allows us to reason about
the breadth of metrics.
One way to identify the metric levels if they can-
not be readily identified from the requirements doc-
uments, is to phrase the metrics in the form of M3
and M4 in Table 4 where we use ‘per’ followed by on
object such as baseline and feature. Thus, the object
of the first ‘per’ is a requirements level. In M3 and
M4, it is easy to identify the levels (feature and base-
line). However, due to the different wording of M1
and M2, it is not clear what the levels are. Thus, if
we rephrase M1 to the following form: number of re-
ENASE 2020 - 15th International Conference on Evaluation of Novel Approaches to Software Engineering
196
quirements that have in-links from design objects per
latest baseline, we know that the requirement level
is baseline. Similarly, M2 can be rephrased to the
following form: Number of requirements that have
in-links from design objects per release per baseline.
Thus, the requirement level is release. Similarly, if we
had a metric that measured number of words per re-
quirement as a measure of an individual requirement’s
size (Antinyan and Staron, 2017), then we can say that
this metric is at the individual requirement level.
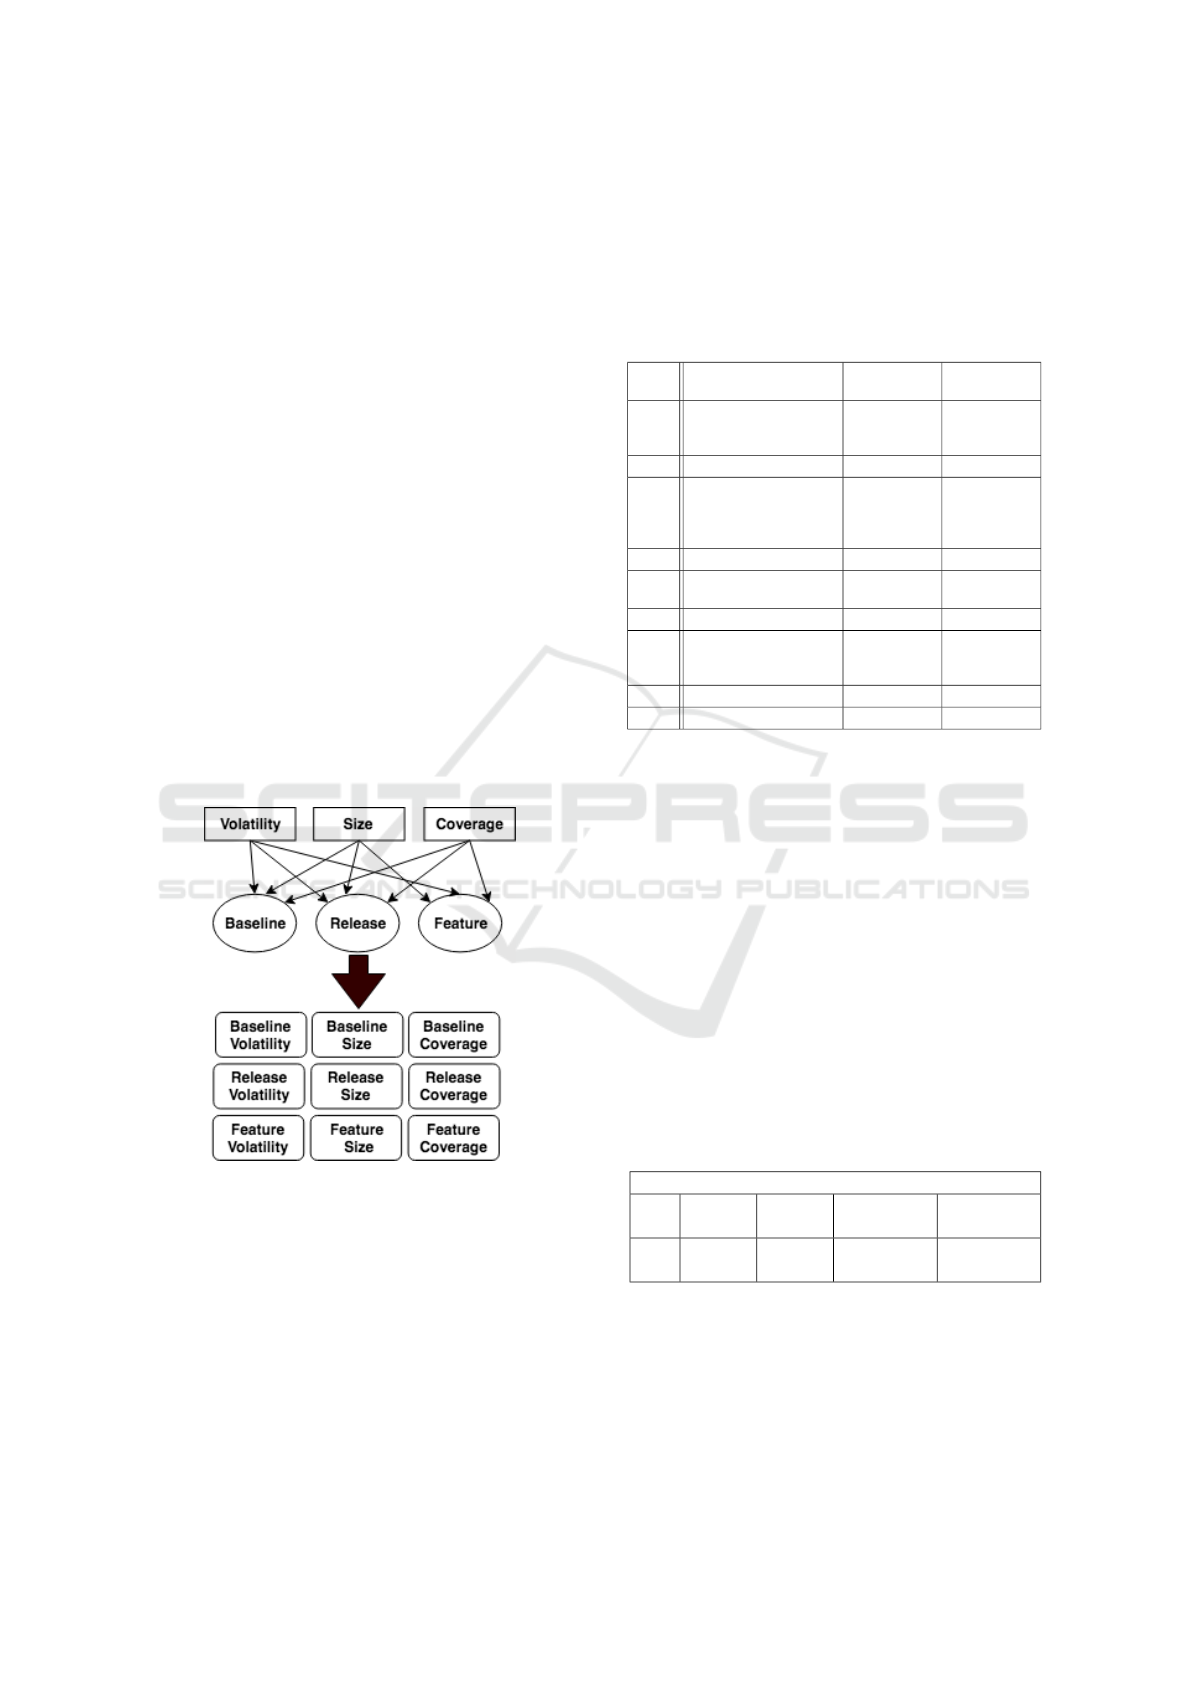
Step 4: Create Attribute-level Combinations.
Once we identified the metrics’ attributes and levels
separately in steps 2 and 3, we create all possible
combinations of the attributes and levels. It is im-
portant that we create all possible attribute-level com-
binations regardless of whether they have associated
metrics. For example, we can create the following
four combinations from the attributes and levels in Ta-
ble 4 that have corresponding metrics: baseline cov-
erage, release coverage, feature size, baseline volatil-
ity. However, Figure 2 shows all the nine possible
attribute-level combinations that can be derived from
Table 4. This step sets the scene for the next step in
which we reason about missing metrics.
Figure 2: Example of attribute-level combinations.
Step 5: Map Metrics to Combinations and Iden-
tify Gaps. This step consists of mapping the metrics
derived in step 1 to the relevant attribute-level combi-
nations identified in step 4. This step is unnecessary
if the metrics, attributes and levels identified in steps
1, 2, and 3 have already been tabulated together since
the beginning of the process. However, if they are in
separate files, then this step dictates creating a matrix
consisting of all the attribute-level combinations and
mapping the metrics onto the combinations. The ma-
trix should also include the additional, empty combi-
nations identified in Step 4, which would yield a table
similar to Table 5. Thus, the new matrix highlights
the attribute-level combinations that do not have cor-
responding metrics (i.e., metric gaps).
Table 5: Metrics mapped onto attribute-level combinations.
Metric
ID
Requirement Metric Requirement
Attribute
Requirement
Level
M1 No. of requirements in
latest baseline that are
covered by design
Coverage Baseline
Coverage Feature
M2 No. of requirements in
latest baseline that are
covered by design and
are assigned to release X
Coverage Release
Size Baseline
M3 No. of requirements per
feature per baseline
Size Feature
Size Release
M4 No. of added, deleted
and modified require-
ments per baseline
Volatility Baseline
Volatility Feature
Volatility Release
Step 6: Derive Missing Metrics. In this step, we
define the metrics for the empty attribute-level com-
binations. For example, for feature X volatility, we
can define M5: The total number of added, deleted
and modified requirements per feature per baseline.
Step 7: Identify Requirements Meta-data. Once
we have defined the complete set of metrics, we iden-
tify the requirements meta-data items needed to apply
the metrics. For example, the meta-data items needed
for M2 are unique requirement ID, release number, in-
links from design, requirement baseline number. Ta-
ble 6 shows a an example of the meta-data that would
be maintained for each requirement in order to apply
the metrics identified in Step 6.
Table 6: Example requirements meta-data.
Baseline 3.1
Req.
ID
Req.
Text
Release In-Links Feature
001 ******* 3 ****/****/
object12
External
Interface
An Approach for Deriving, Analyzing, and Organizing Requirements Metrics and Related Information in Systems Projects
197
4 APPLYING THE APPROACH IN
PRACTICE
The most common and successful validation method
for a software engineering approach or procedure
(Shaw, 2003) is validation through an example based
on a real-life scenario. Such validation can be accom-
plished in a variety of ways including case studies,
experiments, or action research (Easterbrook et al.,
2008). In this subsection, we report our experience in
applying our approach on data from a real-life indus-
trial setting. Particularly, a large-scale rail automation
systems project that consists of three sub-projects.
Initially, we conducted an action research (AR)
study to derive and evaluate a set of requirements met-
rics to be incorporated into the requirements manage-
ment and software development processes. However,
we faced the challenges discussed in Section 1 dur-
ing the study. Thus, the approach emerged as a by-
product of the AR study to address the challenges we
faced. We then applied the proposed approach within
the three sub-projects. We note that while the com-
plete results from the AR study (i.e., requirements
metrics) are not reported in this paper, we use a subset
of the derived metrics to demonstrate the application
of our approach.
In the following subsections, we briefly describe
the project context and the AR study, our experience
with applying the approach, and then discuss the ob-
served benefits.
4.1 The Projects and AR Study
The project in which we conducted the AR study is a
large-scale rail automation project in a multi-national
company in the United States. The overall project
(i.e., program) consisted of many sub-projects, each
sub-project consisted of a product that had its own set
of requirements, architecture design, test cases, and
engineering team. We were directly involved with
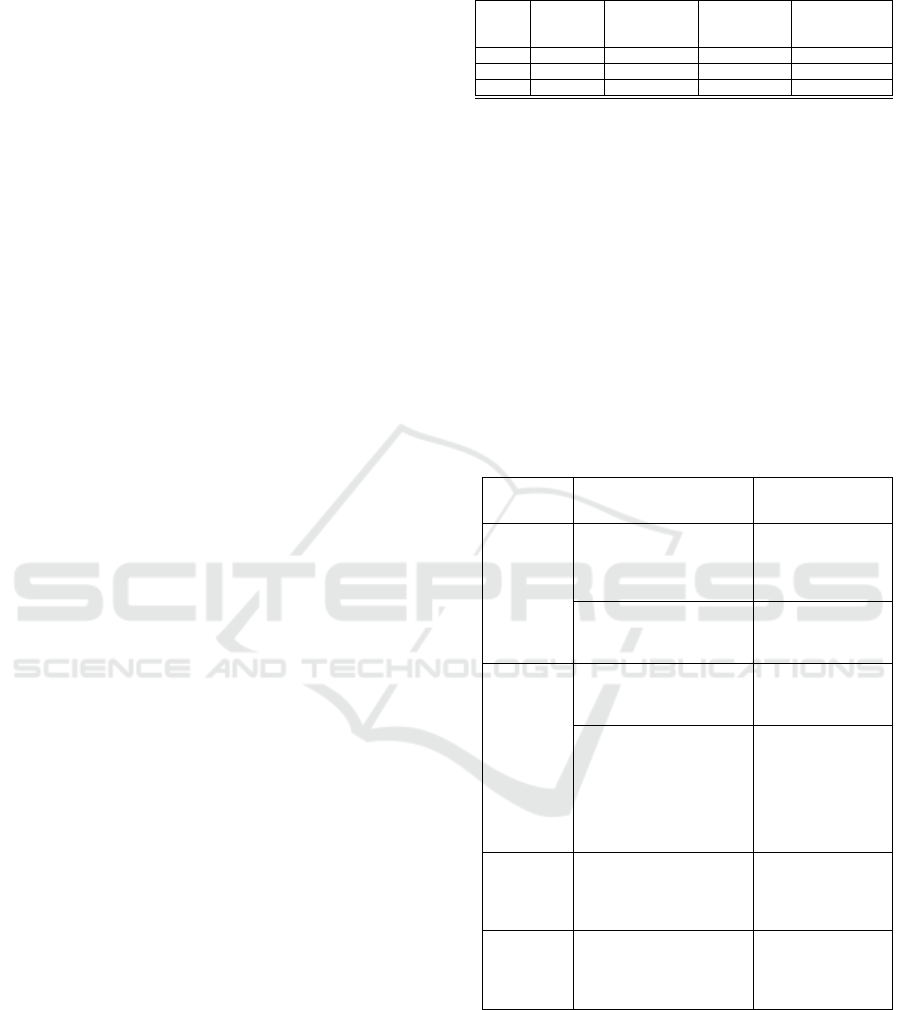
three of the sub-projects. Table 7 shows a breakdown
of project duration, number of requirements specifica-
tion documents (baselines), number of requirements,
and number of safety requirements per project. The
organization used IBM Rational DOORS as their re-
quirements management tool. Thus, each project’s re-
quirements were stored in its own DOORS database
and identified with its own set of meta-data.
The goal of the AR study was to derive a set
of requirements metrics for each project. The AR
study followed an iterative process (Susman and Ev-
ered, 1978) in which the researcher, in collabora-
tion with the industrial partners, identified the inter-
nal stakeholder needs with regard to the requirement
Table 7: Descriptive statistics of projects.
Project Project
Duration
No. of
Requirement
Baselines
No. of
Requirements
No. of Safety
Requirements
P1 73 months 54 1790 N/A
P2 36 months 30 2285 N/A
P3 45 months 51 2389 923
metrics and the corresponding metric descriptions us-
ing GQM (Basili et al., 1994). We opted to use GQM
and not GQM+S because we were not concerned with
organizational or project strategy.
4.2 Applying the Approach
In the following paragraphs, we describe in detail the
application of our approach within Project 3 from Ta-
ble 7. We note, however, that the approach was simi-
larly applied to three other projects as well.
Table 8: The initial set of requirements metrics using GQM.
Goal Question Metrics
G1 Moni-
tor status of
requirements-
design
coverage,
requirements-
test cover-
age.
Q1. What is the status
of requirements-design cov-
erage?
M1, M2, M3, M4
Q2. What is the status of re-
quirements–test coverage?
M5, M6, M7, M8
G2 Monitor
growth and
volatility
of require-
ments.
Q3. What is the growth of
requirements over time?
M9, M10, M11
Q4. What is the volatility of
requirements over time?
M12, M13, M14,
M15, M16, M17,
M18, M19, M20,
M21, M22, M23,
M24, M25, M26,
M27
G3 Manage
release plan-
ning of re-
quirements.
Q5. What is the current
state of allocations of re-
quirements to releases?
M28, M29, M30,
M31, M32, M33
G4 Monitor
distribution
and growth
of safety re-
quirements
Q6. What is the current dis-
tribution of safety require-
ments in latest baseline?
M34, M35, M36,
M37, M38, M39,
M40, M41
Step 1: Derive Initial Set of Metrics. Using GQM
and in collaboration with the internal stakeholders, we
derived an initial set of 41 requirements metrics. Ta-
ble 8 consists of the goals, questions and titles of the
associated metrics that we initially derived. Due to
space restrictions, we do not list all the metric defini-
tions. However, Table 9 shows the metric definitions
for a subset of the metrics in Table 8.
ENASE 2020 - 15th International Conference on Evaluation of Novel Approaches to Software Engineering
198
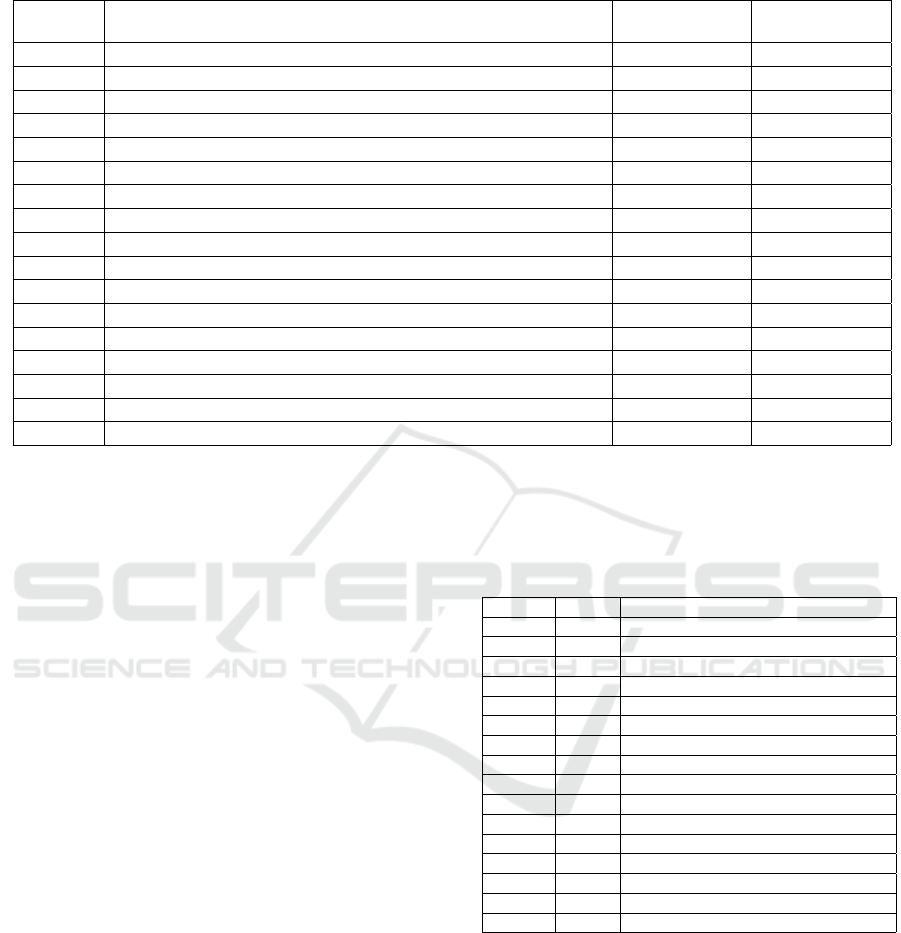
Table 9: A subset of the derived requirements metrics for project 3.
Metric ID Requirement Metric Requirement
Attribute
Requirement
Level
M1 No. of requirements that have in-links from design objects per baseline Coverage Baseline
M5 No. of requirements in latest baseline that have in-links from test cases Coverage Baseline
M9 No. of requirements per baseline Size Baseline
M10 No. of requirements per feature per baseline Size Feature
M12 No. of added requirements per baseline Volatility Baseline
M13 No. of deleted requirements per baseline Volatility Baseline
M14 No. of modified requirements per baseline Volatility Baseline
M15 No. of added, deleted and modified requirements per baseline Volatility Baseline
M16 No. of added requirements per feature per baseline Volatility Feature
M17 No. of deleted requirements per feature baseline Volatility Feature
M18 No. of modified requirements per feature baseline Volatility Feature
M19 No. of added, deleted and modified requirements per feature per baseline Volatility Feature
M29 No. of requirements per release per baseline Size Release
M30 Percentage of requirements per release per baseline Size Release
M34 No. of safety critical requirements per baseline Size Safety
M42 Difference between requirements size for baselines X and Y Growth Baseline
M43 Difference between requirements size for feature Z in baselines X and Y Growth Feature
Step 2: Identify Requirements Attributes. To ex-
ecute this step, we identified the requirement attribute
each metric is measuring as shown in Table 9 in the
Requirement Attribute column. The subset of metrics
shown in Table 9 is representative of the the require-
ments attributes we initially identified: size, coverage,
and volatility. We note how the goals and questions
do not necessarily lead to correct identification of at-
tributes. For example, Q3 in Table 8 is concerned with
the growth of requirements over time. However, the
derived metrics (M9, M10) are in fact measuring size,
but because when deriving the metrics, we envisioned
that the measures will be visualized in a way that de-
picts requirements growth over time, the amount of
growth in of itself is not being measured but the size
of requirements over time. This led to the identifica-
tion of the correct metrics for growth (M42, M43) in
Table 9. Thus, at the end of this step we have added
two metrics and a requirement attribute (growth).
Step 3: Identify Requirements Levels. We iden-
tified each metric’s level according to the procedure
described in Section 3. At the end of this step, we had
four requirement metric levels: baseline, feature, re-
lease, and safety. Table 9 shows each metric’s level in
the Requirement Level column.
Step 4: Create Attribute-level Combinations.
From the identified attributes and levels in Table 9, we
created all the possible attribute-level combinations.
Because we have four attributes and four levels, we
had 16 unique attribute-level combinations as identi-
fied in Table 10 in the Attribute and Level columns.
Table 10: All possible attribute-Level combinations and
mapping of metrics.
Attribute Level Metrics
Coverage Baseline M1, M2, M3, M5, M6, M7, M8
Coverage Feature
Coverage Release
Coverage Safety
Size Baseline M9
Size Feature M10, M11
Size Release M28, M29
Size Safety M34, M35, M36, M37, M38, M39, M40, M41
Volatility Baseline M12, M13, M14, M15, M16, M17, M18, M19
Volatility Feature M20, M21, M22, M23, M24, M25, M26, M27
Volatility Release
Volatility Safety
Growth Baseline M42
Growth Feature M43
Growth Release
Growth Safety
Step 5: Map Metrics to Combinations and Iden-
tify Gaps. We map the metrics listed in Table 8 to the
identified attribute-level combinations as depicted in
Table 10. We can now identify the following metric
gaps: coverage X feature, coverage X release, cover-
age X safety, volatility X release, volatility X safety,
growth X release, growth X safety. Moreover, it is
possible to detect missing metrics for the attribute-
level combinations that have metrics by comparing
the number of metrics for each combination. For ex-
ample, size metrics on the release level (M29, M30)
An Approach for Deriving, Analyzing, and Organizing Requirements Metrics and Related Information in Systems Projects
199

consist of an absolute and relative measure. However,
size metrics on the feature (M10) and safety (M34)
levels consist of absolute measures only.
Step 6: Derive Missing Metrics. The result of this
step was an identification of 46 additional metrics that
were incorporated into the overall metric set. Due
to space restrictions, we do not include all the met-
rics that we derived upon identifying the metric gaps.
However, the metrics in red in Table 11 show the new
metrics and we give some examples here:
M52: No. of requirements with in-links from test
cases per feature per baseline.
M54: No. of requirements with in-links from test
cases per safety requirement category per baseline.
M56: Percentage of requirements per feature per
baseline.
M67: Difference between requirements size for
release Z in baselines X and Y
Table 11: Identification of missing metrics from Step 6.
Attribute Level Metrics
Coverage Baseline M1, M2, M3, M4, M5, M6, M7, M8
Coverage Feature M44, M45, M46, M47,M49, M50, M51, M52
Coverage Release M53, M54, M55, M56,M57, M58, M59, M60
Coverage Safety M61, M62, M63, M64,M65, M66, M67, M68
Size Baseline M9
Size Feature M10, M11
Size Release M28, M29
Size Safety M34, M35, M36, M37, M38, M39, M40, M41
Volatility Baseline M12, M13, M14, M15, M16, M17, M18, M19
Volatility Feature M20, M21, M22, M23, M24, M25, M26, M27
Volatility Release M69, M70, M71, M72,M73, M74, M75, M76
Volatility Safety M77, M78, M79, M80,M81, M82, M83, M84
Growth Baseline M42, M85
Growth Feature M43, M86
Growth Release M87, M88
Growth Safety M89, M90
Note: We chose not merge Tables 10 and 11 in order to highlight the metrics
gaps in Table 10.
Step 7: Identify Requirements Meta-data. Based
on the final set of metrics we identify the meta-data
needed to calculate each metric. The set of unique
requirements meta-data items we identified as a re-
sult of identifying the meta-data items for each of the
90 metrics were: Requirement ID, Requirement type,
Requirement feature ID, Requirement text, Require-
ment release number, Safety requirement type, Out-
links from requirements to external artifacts, In-Links
to requirements. As an example, M1 from Table 9
would require an out-links from requirements to ex-
ternal artifacts meta-data item which we call ReqOut-
links for illustration purposes. Thus, the formula for
M1 would be: count if ReqOutlinks 6= NULL
The meta-data items were necessary for ensur-
ing that all meta-data items were consistent across
projects and applying the metrics. This, in turn, fa-
cilitated the measurement procedure.
4.3 Observed Benefits
After illustrating the application of the approach in
one of the rail automation projects, we discuss the
overall benefits we observed from applying the ap-
proach to all the three projects listed in Table 7.
Metric Breadth. While GQM allows the iden-
tification of an initial set of metrics according to a
project’s goals, which, in turn, address the stakehold-
ers’ information needs, our experience with large sys-
tems projects that involve many internal stakeholders
has shown further concerns with regard to the require-
ments metrics are identified upon having an initial set
of metrics, which prompts further metric derivation.
For example, as seen in Table 10, the initial set of met-
rics measured the design and test coverage of require-
ments for a requirements baseline. Upon implement-
ing the metrics, an architect requested measures of
requirements coverage per feature, for which we de-
rived further metrics. However, our approach allowed
us to derived the coverage metrics on the release and
safety levels as well (see Table 11), which were also
used by different internal stakeholders. Thus, our ap-
proach improves the breadth of the derived metrics
by identifying the metric gaps and, subsequently, de-
riving the associated metrics. Because the approach
identifies the metric gaps by analyzing the attributes
and levels of the initial set of metrics that were de-
rived using GQM and which are based on the the
project’s information needs, the missing metrics will
likely also address measurement needs that the inter-
nal stakeholders were not cognizant of.
Organization of Data. Prior to using the approach
and upon deriving the initial set of metrics in the
AR study (see Section 4.1), the measures were doc-
umented in spreadsheets in an unorganized manner
where metrics lacked accurate labels and unrelated
metrics were grouped together. The identification of
attributes and levels in our approach served as a tem-
plate, which allowed us to structure measures in an
organized and consistent format across projects. Fig-
ure 3 shows a snapshot from the requirements met-
ric report for Project P3 in Table 7 in which the
measures are organized according to requirements at-
tributes (size, growth, volatility, status, coverage) and
levels (baseline, feature, release).
Completeness and Consistency of Requirements
Meta-data. Initially, we adopted a tedious trial and
error approach in which we analyzed each project’s
ENASE 2020 - 15th International Conference on Evaluation of Novel Approaches to Software Engineering
200
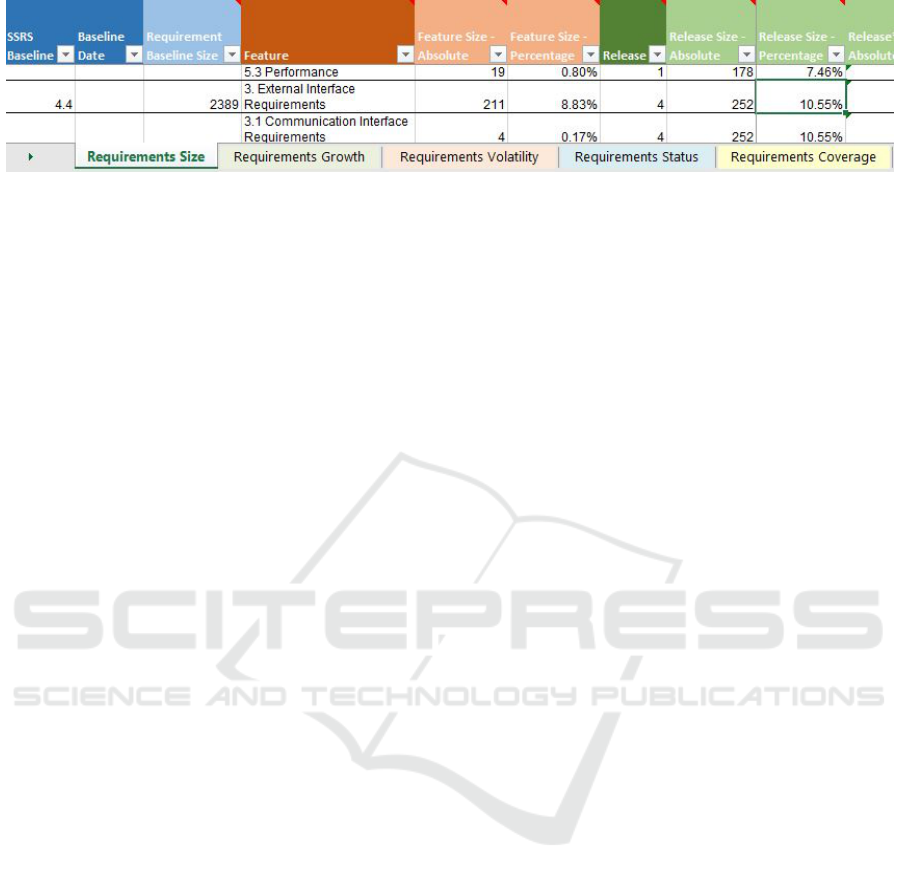
Figure 3: Requirements metric report organized according to attributes and levels.
requirement meta-data to check whether the derived
metrics can be applied to that particular project given
the available meta-data. The requirements meta-data
were incomplete (e.g., missing release meta-data) and
inconsistent (i.e., different meta-data labels used such
as in-links or design links) across projects. How-
ever, identifying the requirements meta-data upfront
aided in assessing the completeness and consistency
of the requirements meta-data in the databases across
projects early in the measurement process. Moreover,
the list of identified requirements meta-data items was
incorporated into the requirements management plan
to be enforced in future projects in order to facilitate
the requirements measurement process.
Measurement Time and Effort. The application
of the approach resulted in a reduction of the time
and effort expended on the requirements measure-
ment process, which was enabled in two ways. First,
our experience in deriving metrics in a large systems
project with numerous internal stakeholders showed
that missing metrics are identified slowly and incre-
mentally through feedback from the stakeholders as
they elucidate their needs. The use of our approach
reduces the time required for this process by identi-
fying the metrics gaps and deriving the missing met-
rics through the upfront analysis and reasoning about
the metrics. This enables the preemptive derivation of
metrics that may be requested later on and which, in
turn, reduces the time spent on measurement.
Second, the reuse of the identified attributes, lev-
els, metrics, and meta-data items aided in reducing
the time and effort needed to derive, analyze and or-
ganize a set of requirements metrics for each project.
Thus, when a fourth new project was added, we sim-
ply reused the results of our approach from the previ-
ous three projects (Table 7). However, this reuse does
not prevent reexamining the needs of a project and,
subsequently, reapplying the approach to derive fur-
ther metrics that address the newly identified needs.
5 DISCUSSION
In this section, we first discuss the implications of our
approach for RE management and measurement, re-
quirements management tools, RE dashboards, and
studies on RE measurement and then its limitations.
5.1 Implications
Requirements Management and Measurement Pro-
cesses: The centrality of the four measurement ele-
ments (i.e., attributes, levels, metrics, and meta-data)
in our approach could encourage requirements per-
sonnel to consciously consider the definition of the el-
ements during the requirements management process.
For instance, given that defining requirements meta-
data is already an integral part of the requirements
management process (Wiegers, 2006), requirements
engineers can now define the requirements meta-data
with requirements measurement in mind. For exam-
ple, if the project intends to measure requirements
volatility and coverage at the baseline and feature lev-
els, then the requirements engineer would define the
requirements meta-data that would facilitate the mea-
surement of these attributes and levels later in the re-
quirements engineering process. This, in turn, allows
for seamless and easier application of our approach
later in the requirements management process.
Existing Requirements Management Tools: While
existing requirements management tools (e.g., Ratio-
nal DOORS, Jama, ReqSuite) allow the identifica-
tion of requirements meta-data and derivation of some
measures in relation to requirements (e.g., total no. of
requirements, no. of requirements in progress), they
do not support functionality for advanced requirement
metric derivation, reasoning about metric complete-
ness and consistency, and structuring metrics into re-
lated clusters. Thus, the requirements measurement
process is carried out as an external process, which
requires significant added time and effort (Costello
and Liu, 1995). The delineation of key requirements
measurement elements and the steps to utilize them in
our approach open up possibilities for advanced RE
An Approach for Deriving, Analyzing, and Organizing Requirements Metrics and Related Information in Systems Projects
201

tool-features. For example, attribute-level combina-
tions (e.g., baseline X volatility, feature X coverage
—see Section 4.2 for examples) can be automatically
generated, thereby saving effort and ensuring quality.
Further, the meta-data items required for each metric
can be selected from the list of defined meta-data in
the requirements database and, based on the selected
meta-data items, queries could be created to calculate
measures.
RE Dashboards: Dashboards that gather, analyze,
calculate, and present measures are commonly used in
SE. Such dashboards have always targeted the project
management (Kerzner, 2017) and development (John-
son, 2007) phases. However, different domains have
different needs with regard to dashboards (Pauwels
et al., 2009). Whether on top of existing requirements
management tools or as standalone dashboards, our
approach may have practical implications on require-
ments dashboards in at least two ways. First, our ap-
proach could provide guidance to designing and de-
veloping requirements dashboards. For example, the
concepts of attributes and levels can inform the pre-
sentation of the measures in the dashboard. Specifi-
cally, pages can be organized according to attributes
(e.g., size, growth, and volatility, etc.) and each page
can organize the measures according to levels (e.g.,
baseline, feature,and release, etc.) In addition, the
dashboard can be designed to ensure that each met-
ric is associated with an attribute and level to avoid
‘stray metrics’. Second, the approach could be inte-
grated as one of the dashboard’s functionalities to en-
able the derivation, analysis and organization of met-
rics. For example, the dashboard could provide ‘intel-
ligent’ recommendations for metrics based on defined
attributes and levels. Thus, the dashboard would be-
come more intelligent as more attributes, levels, and
metrics are defined over time.
Further Studies on RE Measurement: Our ap-
proach addresses the measurement challenges that
have emerged in large systems projects. It could thus
be a model for creating subsequent RE measurement
methods applicable in other domains or be a basis for
generalizability studies.
5.2 Limitations
This investigation was conducted in a large systems
engineering company with well-established require-
ments management and documentation procedures
and numerous internal stakeholders. Thus, the use of
our approach can be said to be limited to such an en-
vironment. The applicability of our approach in other
development environments (e.g., agile or planned ag-
ile) in which requirement documentation is minimal
may be limited.
In addition, the approach assumes the existence of
a large set of requirements in which requirements are
organized according to different levels (e.g., features,
releases, and baselines) and, thus, metric levels can be
identified. However, in other process paradigms (e.g.,
agile and iterative, etc.), equivalent notions need to be
identified similar to those in our approach.
Finally, without tool support, the application of
our approach becomes tedious when the number of
attributes, levels, metrics, and meta-data are large.
Thus, incorporating the approach and its elements
into requirements management tools, as discussed in
Section 5.1, would facilitate its application in contexts
where the number of metrics, attributes, levels, and
meta-data become unmanageable manually.
6 CONCLUSIONS AND FUTURE
WORK
Requirements measurement in a systems engineering
context is a complex task due to the existence of mul-
tiple projects with large sets of requirements with var-
ious categories (e.g., baseline, features, and releases,
etc.), various internal stakeholders and their informa-
tion needs, and inconsistent requirements meta-data
across projects, to name a few. Thus, requirements
metrics end up being: large in number, replicated with
unintended variations, ill-structured and disorganized,
and incomplete. Existing measurement approaches
and methods do not address such requirements mea-
surement concerns (Section 2.1).
In this paper, we propose an approach that aims
to bridges the gap between the use of GQM to select
and specify metrics that satisfy the needs of the stake-
holders and the use of templates to document and re-
port the measures by providing a method to derive
RE metrics, analyze them for completeness, struc-
ture and organize the metrics, and specify the meta-
data needed for the metrics. The approach utilizes
the GQM approach and consists of seven steps that
rely on four measurement elements: requirements at-
tributes, levels, metrics, and meta-data (Section 3).
The approach aids in improving metric breadth, orga-
nizing measures, improving completeness and consis-
tency of requirements meta-data, and reducing mea-
surement time and effort (Section 4.3). We demon-
strate the application of the approach to a real-life sys-
tems project from the rail automation domain (Sec-
tion 4.2) and discuss its observed benefits. The ap-
proach is anticipated to have implication for require-
ments management measurement processes, require-
ments management tools, RE dashboards, and studies
ENASE 2020 - 15th International Conference on Evaluation of Novel Approaches to Software Engineering
202

on RE measurement (Section 5.1).
Future work rests in applying the approach in dif-
ferent contexts to strengthen its validity and providing
tool support to improve its usability.
ACKNOWLEDGEMENTS
We extend our sincerest thanks to the collaborating
organization for providing data and feedback. This
work is supported by the Ministry of Higher Educa-
tion of Saudi Arabia and the Natural Sciences and En-
gineering Research Council of Canada (NSERC).
REFERENCES
Antinyan, V. and Staron, M. (2017). Rendex: A method for
automated reviews of textual requirements. Journal of
Systems and Software, 131:63–77.
Basili, V., Caldiera, G., and Rombach, H. (1994). Goal
Question Metric Approach. Encyclopedia of Software
Engineering, 1:98–102.
Basili, V., Trendowicz, A., Kowalczyk, M., Heidrich,
J., Seaman, C., M
¨
unch, J., and Rombach, D.
(2014). Aligning Organizations Through Measure-
ment. Springer.
Bonelli, S., Santos, G., and Barcellos, M. P. (2017).
ASM.br: A Template for Specifying Indicators. In
Proceedings of the 21st International Conference on
Evaluation and Assessment in Software Engineering,
Karlskrona, Sweden.
Briand, L. C., Morasca, S., and Basili, V. R. (1996).
Property-based software engineering measure-
ment. IEEE Transactions on Software Engineering,
22(1):68–86.
CMMI Product Team (2006). CMMI for Development, Ver-
sion 1.2. Technical report, Carnegie Mellon Software
Engineering Institute, Pittsburgh, PA.
Costello, R. J. and Liu, D.-B. (1995). Metrics for Require-
ments Engineering. Systems Software, 29:39–63.
Easterbrook, S., Singer, J., Storey, M.-A., and Damian, D.
(2008). Selecting Empirical Methods for Software
Engineering Research. Guide to Advanced Empirical
Software Engineering, pages 285–311.
Ebert, C. and Dumke, R. (2007). Software Measurement:
Establish, Extract, Evaluate, Execute.
Goethert, W. and Siviy, J. (2004). Applications of the Indi-
cator Template for Measurement and Analysis. Tech-
nical report, Carnegie Mellon University.
IEEE (2017). ISO/IEC/IEEE 15939:2017(E) - Systems and
software engineering - Measurement Process. Techni-
cal report, ISO/IEC/IEEE.
Johnson, P. M. (2007). Requirement and design tradeoffs in
Hackystat: An inprocess software engineering mea-
surement and analysis system. In 1st International
Symposium on Empirical Software Engineering and
Measurement, pages 81–90, Madrid, Spain. IEEE.
Kerzner, H. (2017). Project Management Metrics, KPIs,
and Dashboard: A Guide to Measuring and Monitor-
ing Project Performance. John and Wiley & Sons, 3
edition.
Offen, R. J. and Jeffery, R. (1997). Establishing software
measurement programs. IEEE Software, 14(2):45–53.
Olsson, T. and Runeson, P. (2001). V-GQM: A feed-back
approach to validation of a GQM study. In Proceed-
ings of the 7th International Software Metrics Sympo-
sium, pages 236–245. IEEE.
Pauwels, K., Ambler, T., Clark, B. H., LaPointe, P., Reib-
stein, D., Skiera, B., Wierenga, B., and Wiesel, T.
(2009). Dashboards as a Service. Journal of Service
Research, 12(2):175–189.
Rowe, A. and Whitty, R. (1993). Ami: promoting a quan-
titative approach to software management. Software
Quality Journal, 2:291–296.
Shaw, M. (2003). Writing good software engineering re-
search papers. In 25th International Conference on
Software Engineering (ICSE 2003), pages 726–736,
Portland, Oregon. IEEE.
Susman, G. and Evered, R. D. (1978). An Assessment of the
Scientific Merits of Action Research. Administrative
Science Quarterly, 23(4):582–603.
Tennant, G. (2001). Six Sigma: SPC and TQM in Manufac-
turing and Services. Gower, Burlington, USA.
Wiegers, K. E. (2006). More about Software Requirements:
Thorny Issues and Practical Advice. Microsoft Press,
Washington.
An Approach for Deriving, Analyzing, and Organizing Requirements Metrics and Related Information in Systems Projects
203
