
Aiding Irrigation Census in Developing Countries by Detecting Minor
Irrigation Structures from Satellite Imagery
Chintan Tundia, Pooja Tank and Om Damani
Indian Institute of Technology - Bombay, Mumbai, India
Keywords:
Minor Irrigation Census, Object Detection, Deep Learning, Remote Sensing, Computer Vision.
Abstract:
Minor irrigation structures such as well and farm ponds play very important roles in agriculture growth in
developing countries. Typically, a minor irrigation census is conducted every five years to take inventory of
these structures. It is essential that an up to date database of these structures be maintained for planning and
policy formulation purposes. In this work, we present the design and implementation of an online system for
the automatic detection of irrigation structures from satellite images. Our system is built using three popular
object detection architectures - YOLO, FasterRCNN and RetinaNet. Our system takes input at multiple res-
olutions and fragments and reassembles the input region to perform object detection. Since currently there
exists no dataset for farm pond and the only publicly available well dataset covers a small geographical region,
we have prepared object detection datasets for farm ponds and wells using Google Maps satellite images. We
compare the performance of a number of state of the art object detection models and find that a clear trade-off
exists between the detection accuracy and inference time with the RetinaNet providing a golden mean.
1 INTRODUCTION
In developing countries, irrigation plays an impor-
tant role in farming and agricultural growth (Kirpich
et al., 1999). Minor Irrigation structures account for a
huge part of irrigation infrastructure due to short con-
struction period and low investment required. These
structures, such as wells, check dams, and farm ponds
(NIC , MeitY., 2014), have cultivable command area
up to 2000 hectare, . In India 65% of the agricul-
ture depends on minor irrigation (Frenken, 2012). It
is essential that an up to date database of these struc-
tures be maintained for planning and policy formu-
lation purposes for which minor irrigation census is
conducted every 5 years. The census data is collected
from village level workers/administrators, revenue or
land records and a survey of different government and
private scheme owners. After collection of field data,
the data entry is done on an online portal. State gov-
ernments monitor the progress of field work, data en-
try and validation work. The validated data is again
examined by the Central Government before the final
report generation. Moreover, prior to conducting cen-
sus, training workshops are conducted at central as
well as regional levels. Thus the process of conduct-
ing minor irrigation census involves lot of cost and
effort.
As per (V. K. Bhatia, et. al, 2010) there are sev-
eral obstacles in conducting minor irrigation census.
Census officials face difficulties like unavailability of
village records, villages being located at remote areas,
and difficulty in explaining villagers technical terms.
Sometimes there is a delay in data collection due to
lack of sufficient staff, non-cooperation by farmers,
elections, and floods. These problems make census
lengthy, error prone and costly. Further, the persistent
fall in groundwater level means that any rapid change
in number of these structures must be detected early
on for the government to take regulatory actions to
prevent competitive extraction and storage of ground
water in farm ponds, leading to the tragedy of the
commons (Prasad and Sohoni, 2018).
This scenario calls for the development of an au-
tomatic system for detection, mapping, and record-
ing of irrigation structures. Using Remote Sensing,
Computer Vision, and Deep Learning techniques, we
have built an online web based object detection sys-
tem that assists users to get locations and counts of
these structures on a GIS based interface. Currently,
our system provides detection of two important struc-
tures, dug wells and farm ponds and we have incor-
porated three deep learning architectures - YOLO,
FasterRCNN and RetinaNet. We next discuss the mo-
tivation behind choosing these structures.
208
Tundia, C., Tank, P. and Damani, O.
Aiding Irrigation Census in Developing Countries by Detecting Minor Irrigation Structures from Satellite Imagery.
DOI: 10.5220/0009421302080215
In Proceedings of the 6th International Conference on Geographical Information Systems Theory, Applications and Management (GISTAM 2020), pages 208-215
ISBN: 978-989-758-425-1
Copyright
c
2020 by SCITEPRESS – Science and Technology Publications, Lda. All rights reserved
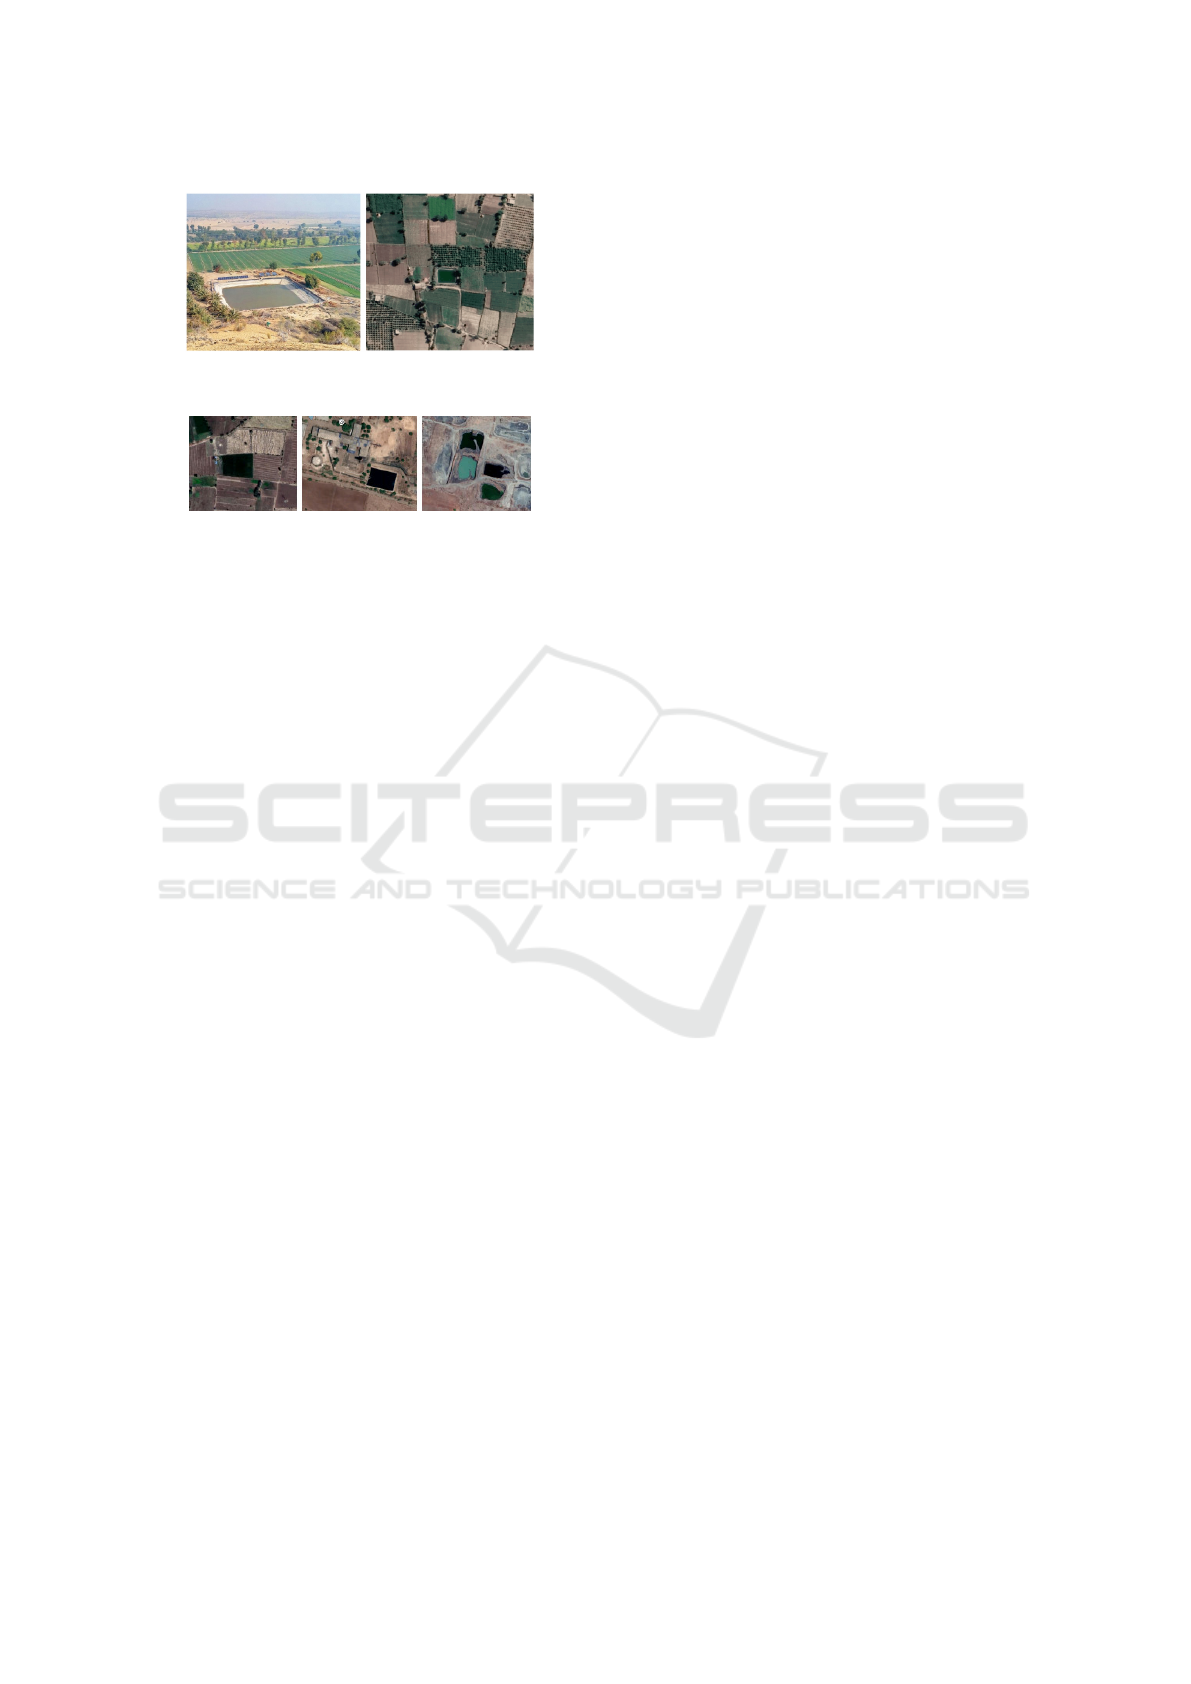
Figure 1: Distinction between a Farm Pond in a Normal
Photograph Vs a Farm Pond in a Satellite Image.
Figure 2: Farm Ponds Can Be Confused with a Farm or an
Industrial Unit or a Stone Quarry.
Farm Ponds: It is a surface structure dug out
in the earth, usually square or rectangular in shape,
which harvests rainwater for future use as a drought
proofing tool. Construction of farm ponds have been
receiving a great push from the Indian governmentt
for the past few years (Abhay N, 2016), but serious
concerns are also being raised against this drive. The
use of farm ponds has long drifted from its objective
of storing rainwater for protective irrigation. In sev-
eral areas, farm ponds are being used as storage tanks
for pumped out groundwater exposing this precious
underground resource to evaporation losses (Prasad
and Sohoni, 2018). Thus accurate and timely detec-
tion and geo-tagging of farm ponds is essential.
Automatic detection of farmponds is a challenging
task. Any given time, some farm ponds are dry being
empty while others are wet being filled with water.
These may or may not have plastic lining. Moreover,
several objects can be confused with farm ponds such
as farms, industrial units, and stone quarries as seen
in Figure 2.
Dug Wells: It is a groundwater extraction struc-
ture created by digging or drilling to tap the underly-
ing aquifer. It is an important source of potable water
in rural areas where they are used for multiple pur-
poses. Also, in developing countries, the estimation
of groundwater level in rural area is done with the
help of observation wells.
Detecting dug wells from satellite images is also a
challenging problem. These are very small structures
contained in an area of approximately 40 x 40 pixels
in a satellite image of spatial resolution 15 - 30 cm.
The wells in satellite images look like dark circular
shaped objects with a thin white lining around it. An-
other challenge is that generally they look very simi-
lar to trees or shadows of the trees. The most difficult
ones are those which are found next to or covered by
the shadow of a tree.
2 RELATED WORK
Object detection refers to the task of localizing all rel-
evant objects present in an image (Russakovsky et al.,
2015). Detecting objects from satellite images is a
challenging task and is receiving significant attention
in recent years. It suffers from several difficulties in-
cluding the large variations in the visual appearance
of objects caused by viewpoint variation, occlusion,
background clutter, illumination, shadow, etc. (Cheng
and Han, 2016). Due to low resolution in satellite
images, earlier it was difficult to detect separate land
use and land cover objects. With advances in remote
sensing, satellites like IKONOS, SPOT-5, and Quick-
bird have been providing very high resolution (VHR)
aerial images with detailed spatial and textural infor-
mation. Due to progress of deep learning, object de-
tection in satellite imagery has found several applica-
tions such as building detection ((Vakalopoulou et al.,
2015),(Yuan, 2018)), road detection (Saito and Aoki,
2015), solar panel detection((Yuan et al., 2016)), ve-
hicle detection ((Dorrer et al., 2019),(Audebert et al.,
2017)). Most of these works use traditional convo-
lutional neural networks and require large dataset to
train the models.
In recent years, object detection techniques have
greatly improved in terms of accuracy and speed
due to better image representation structures and im-
proved deep learning architectures. Latest deep learn-
ing based detectors can be categorized into one-stage
and two-stage detectors. In two-stage detectors, the
first stage produces a sparse set of candidate object
proposals, and the second stage classifies object pro-
posals into target classes or background. Selective
Search(Uijlings et al., 2013), Spatial Pyramid Pool-
ing Network(SPPNet) (He et al., 2014), Feature Pyra-
mid Network (FPN) (Lin et al., 2017) and Region
based Convolutional Neural Network(RCNN) (Gir-
shick et al., 2014) are the most prominent two-stage
detectors. RCNN became particulary popular for the
region based tasks and FastRCNN (Girshick, 2015)
and FasterRCNN (Ren et al., 2017) are evolved ver-
sion of RCNN with improved detection speed. While
two-stage detectors dominate the modern object de-
tection they lack in speed compared to the one-stage
detectors. In one-stage detectors, the division of input
image into regions and probabilistic prediction of ob-
ject presence with candidate bounding box is done si-
multaneously. These detectors consist of models like
Single Shot Multibox Detector (Yang et al., 2019) and
You Only Look Once (YOLO)(Redmon et al., 2016).
This improvement in detection speed comes at the
expense of localization accuracy compared to two-
stage detectors, especially for small objects. How-
Aiding Irrigation Census in Developing Countries by Detecting Minor Irrigation Structures from Satellite Imagery
209
ever, there is a recent one-stage detector RetinaNet
(Lin et al., 2017) which is able to match the speed
of previous one-stage detectors while surpassing the
accuracy of all existing two-stage detectors.
In this paper, we compare and evaluate three state-
of-the-art detectors FasterRCNN, YOLO and Reti-
nanet on well and farm pond datasets developed by
us. These methods cover the spectrum of accuracy vs
detection speed trade-off.
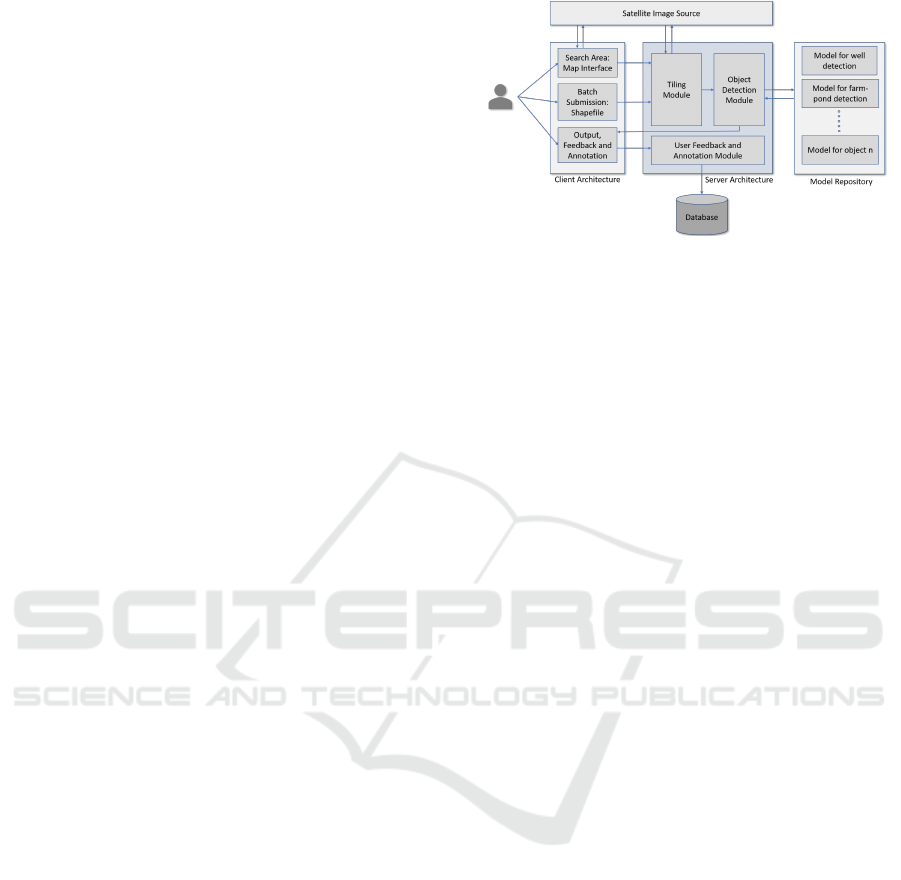
3 SYSTEM ARCHITECTURE
Our system is a web-based application which is in-
spired by and a significant improvement over the
SIAS - Satellite Image Annotation System (Wagh
et al., 2019). SIAS supported the well detection from
satellite images in a fixed-sized (640x640 pixels) win-
dow and performed detection in small regions only
whereas our system performs detections over large ar-
eas of size of cluster of many villages. Most impor-
tantly, compared to SIAS system which takes roughly
5 minutes to download and process 100 images, our
multi-threaded architecture takes only 10 seconds. In
addition, our system provides a better user interface
thus improving user experience.
The architecture of our system is shown in Fig-
ure 5. The system has features to search and select
an area from the map interface. The users can also
provide a shape-file of the concerned region as input.
Detection is performed by loading model’s weights
into the architecture from the model repository which
contains trained weight files of detection models and
results are obtained by passing images of the target
area to the model. The detection result is provided
as the geo-referenced bounding-boxes i.e. the pixel
coordinates of the object are converted to latitude-
longitude points. The geo-referenced bounding boxes
of the detected objects are then overlaid on the map
interface and thus visible to the users on the map it-
self. The system has a feature to take feedback from
the user about the correctness of the detection. User
can also annotate the missing objects. Moreover, the
users have an option to download the report contain-
ing latitude-longitude coordinates of the detected and
annotated objects in the form of a comma-separated
values(CSV) file. The system’s backend is built us-
ing Django Framework and frontend is built using
HTML, JavaScript and CSS.
3.1 Client Architecture
As shown in Figure 5, the client side module provides
a map interface. The user can also specify area in
Figure 3: System Architecture of the Proposed System.
the form of shapefile. The user can select an object
type and a detection model. All the detection models
discussed later in section 4.2 are available for users
to choose from. The details of modules involved in
client architecture are as listed below:
Search Area: It provides users an online platform to
select any area for detection. It creates a fixed-sized
window which contains the satellite view of any
particular area. Users can search for the required area
by dragging the map on the window or by typing
the name of the area in the search box provided.
Output by the detection model is overlaid on the
map interface window in the form of a marker and
bounding box.
Batch Submission - Shapefile: The system also
supports shapefile input. Shapefile is a file that
contains the boundary of the village or boundary of
the area that needs to be selected for detection in the
form of vector data.
Feedback and Annotation: The System gives a fa-
cility to add missing objects. User can draw a bound-
ing box on the map interface or can put a marker by
clicking on the map interface. The system also sup-
ports votes from the user. Additionally the user can
also remove any misidentified objects.
3.2 Server Architecture
Server architecture consists of the following modules
that handles requests from user and perform detection
on the inputs given from client side:
Tiling Module: It accepts the input area provided by
users which can be an area selected in the map in-
terface window or provided by a shape-file. As our
model works on satellite view image with a resolu-
tion of 0.3m/pixel, we divide the required area into
tiles of size 640x640 pixels and download the satel-
lite images at that resolution. To get the center points
GISTAM 2020 - 6th International Conference on Geographical Information Systems Theory, Applications and Management
210
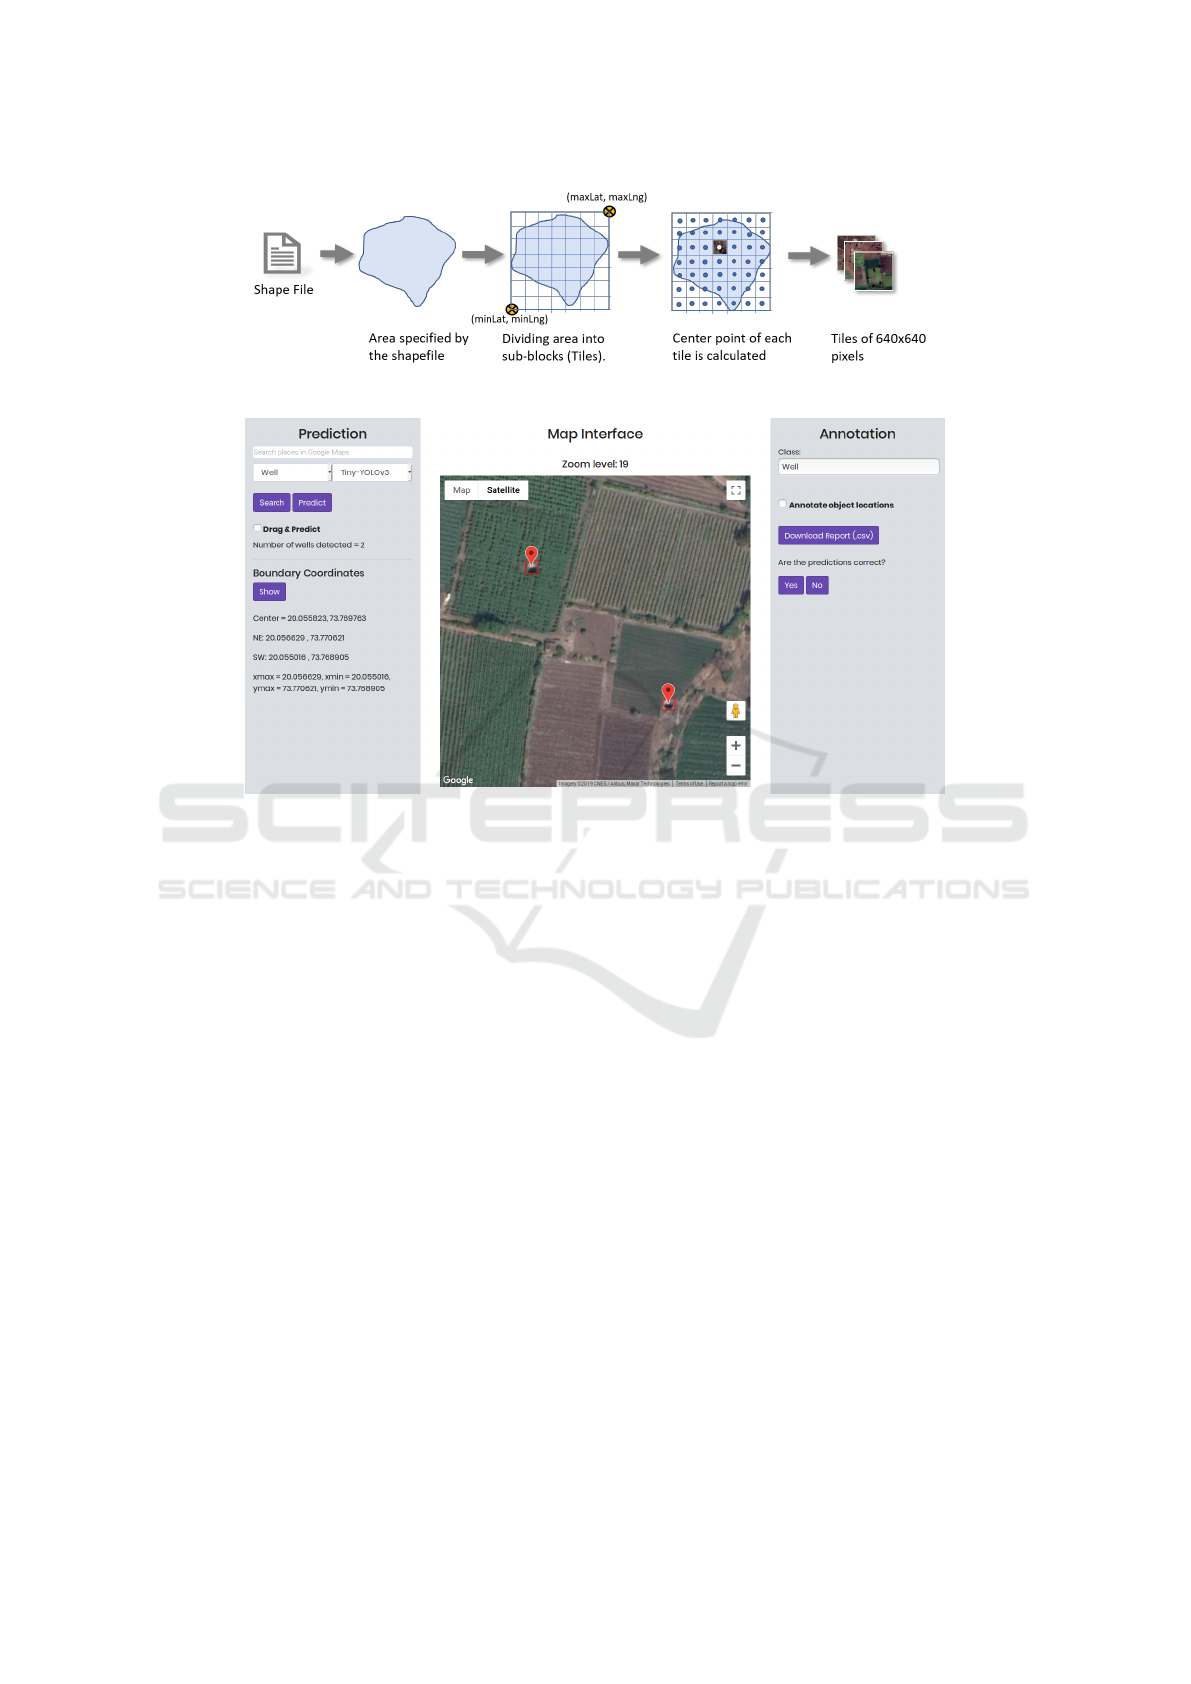
Figure 4: Process to Get Tiles from a Shapefile.
Figure 5: Screenshot of Proposed System.
of these tiles, we follow the following steps:
1. Take the latitude-longitude coordinates of the
bottom-left corner and top-right corner of the area.
2. Calculate latitude and longitude offset based on the
resolution required for each tile and the size of the
tile in terms of pixels.
3. Starting with the point in the bottom-left corner
add offset to it to get the next point. Continue
this process until we reach the top-right corner and
cover the entire area as depicted in the Figure 4.
We then download images centered around the points
obtained as seen in the Figure 4. These images are
then provided to object detection module for further
process of detection. We observed that one of the
major bottlenecks in SIAS was the time required to
download satellite images. This becomes even worse
when we download a large number of images. De-
pending on the size of the village it requires ∼ 600
to 2000 images to cover the entire area. SIAS took
∼ 5 minutes to download and detect objects for 100
satellite images. Furthermore, we observed that while
downloading images, CPU remains idle.
We use multithreading for downloading and
detection tasks. Our problem is similar to the
famous producer-consumer problem. In our case
the producer is the process to download images
and consumer is the process to perform detection
on each downloaded image. This reduces the time
for downloading and detection in images from 301
seconds to just 22 seconds for 100 images. Our
system uses 8 threads to download the images and 8
threads to process and predict object from images.
Object Detection Module: Object detection module
takes object type to detect ( i.e. Well, Farm Pond
etc.), and detection model from user and image tiles
provided by tiling module. It uses trained model
repository to get pre-loaded weights and network
architecture of the required object detection model. It
processes the images and gets the pixel coordinates
of the detected object and bounding box for the same.
These coordinates are converted into geo-referenced
points and then output is provided to client view.
User Feedback and Annotation Module: The given
feedback by the user about the correctness of the
detection data is stored in the database as human-
verified objects. Also manually added objects which
were missing in the detection results, are stored in the
database. This data can be used for further training of
the model to improve the accuracy.
Aiding Irrigation Census in Developing Countries by Detecting Minor Irrigation Structures from Satellite Imagery
211

4 OBJECT DETECTION
EXPERIMENTS
4.1 Dataset Description
There is a scarcity of public dataset of minor irrigation
structures. We introduce two datasets with respect to
the two agricultural structures, i.e. Dug-Wells Dataset
and Farm-Ponds Dataset created using data collected
from all the districts with agriculture of the state.
Creating a dataset using satellite images is not
straightforward. It involves choosing set of the im-
ages of target area, cropping the images in required
size and annotating objects in the images. To ease
this process, we created a Satellite Image Labeling
tool that helps an annotator to perform all the above
tasks efficiently. This tool provides an interface to
navigate through a map layer, annotate objects using
different shapes like circle and polygon on the layer
and then save images and annotations to the database.
The interface has been built using Django as back-
end and HTML, Javascript, JQuery and Google Maps
APIs(Google Static Maps, 2019) for frontend.
We used the geo-tagged data of works done by
the Jalyukta Shivar Abhiyan (MRSAC, 2015). which
is the flagship programme of the state of Maharash-
tra government of India, aim of which is to make
5,000 villages free of water scarcity by installing or
strengthening decentralized water bodies like wells
and farm ponds to enhance the groundwater recharge
(Anjali Marar, 2019). The labeling interface was cus-
tomized to set map layer according to geo-tagged lo-
cations thereby reducing the search space required by
annotators. The annotations were done by many dif-
ferent experts to prevent bias in the data. The details
of the datasets are as follows:-
• Dug Wells: Dug Wells being hollow circular ob-
jects are annotated using shape as circle. The
dataset consists of total 1011 images consisting of
1614 wells from 34 districts of the state. Each im-
age size is of 640x640 pixels and is extracted from
Google Static Maps taken at a zoom level of 19.
This dataset can be used for image classification,
object detection and instance segmentation tasks.
• Farm Ponds: Farm Ponds are found to be in dif-
ferent sizes, shapes and types. The annotations
are done using polygons. Since both dry and wet
farm ponds can be lined or unlined we get four
classes of objects:
– Dry Farm Pond - Lined and Unlined
– Wet Farm Pond - Lined and Unlined
The dataset consists of 1018 images consisting
of 370 instances of each type totaling 1480 farm
ponds from 34 districts of Maharashtra. Each im-
age size is of 640x640 pixels and extracted from
Google Static Maps taken at a zoom level of 18.
Apart from our purpose of detection this dataset
can also be used for multi-class image classifica-
tion and multi class instance segmentation tasks
4.2 Model Architectures
FasterRCNN: Faster RCNN(Ren et al., 2017) is an
evolved model from the Region-based CNN (RCNN)
family of detectors and it is the modified version of
Fast RCNN (Girshick, 2015) with the main difference
being the use of CNN based Region Proposal Net-
work(RPN) instead of Selective Search to generate
a set of region proposals. Faster RCNN model
architecture consists of three main parts: Convolution
layers that are responsible for extracting features,
RPN for region proposals and fully connected layers
for classifying objects and predicting the bounding
boxes(regression).
We implement Faster RCNN with ResNet-50 back-
bone having 50 convolutional layers with skip
connections and adapt stochastic gradient descent
optimizer with an initial learning rate of 0.005, the
momentum of 0.9 and weight decay rate of 0.0005.
We train the model for 10 epochs of batch size 3.
YOLOv3: You Only Look Once(YOLO) (Redmon
and Farhadi, 2018) is one of the fastest object detec-
tion model and belongs to the class of single-stage
models. Yolov3 is the latest model in the YOLO fam-
ily known for its fast real-time multi-object detection.
The main improvement in YOLOv3 is that it uses
three different scales to detect objects of different
sizes. It adapts a FPN(Feature Pyramid Network)-
like structure for multi-scale detection. The use
of residual blocks (ResNet-like structure) in this
model simplifies the complexity of feature learning.
Tiny YOLOv3 is a simplified version of YOLOv3
which reduces the depth of the convolutional layer
and therefore is lighter and suitable for real-time
detection at the cost of reduced accuracy.
We follow the implementation of (Redmon and
Farhadi, 2018) for YOLOv3 and Tiny YOLOv3. We
do not rescale the input and use the original input size
of 640x640. We use learning rate of 0.001 and Adam
optimizer and train the model for 100 epochs with a
batch size of 4 for both the models.
RetinaNet: RetinaNet(Lin et al., 2017) is another
single-stage object detection model with FPN(Lin
et al., 2017) and Focal loss for dense object detection.
The FPN above the ResNet network helps to generate
GISTAM 2020 - 6th International Conference on Geographical Information Systems Theory, Applications and Management
212

a multi-scale feature pyramid, two subnetworks above
this backbone is used for classification and bounding
box regression. The use of Focal loss helps to focus
more on difficult and mis-classified samples and to re-
duce the relative loss on well-classified samples.
We follow the implementation of (Lin et al., 2017).
We experiment this model with ResNet-101 and
ResNet-50 network architecture. We train our model
for 100 epochs and batch size of 16 with learning rate
1e-5 and Adam optimizer. we use the input image size
of 640x640 for both the models.
4.3 Implementation Details
For training the models, we use transfer learning ap-
proach where we adapt pre-trained models (as dis-
cussed in subsection 4.2) and fine-tune using our well
and farm pond datasets. Both the datasets were split
into randomly choosing 80% train and 20% test sam-
ples i.e. 809 training and 202 test examples for Wells
dataset and 814 training and 204 test examples. Back-
bone of all the architectures are loaded by pre-trained
weights on MS-COCO dataset(Lin et al., 2014). All
the models were trained on Tesla K80 GPU with
12GB VRAM.
5 RESULTS
5.1 Evaluation Metric
For evaluation and comparison of the models experi-
mented on our dataset, we use Pascal-VOC 2012 met-
ric of object detection (Everingham et al., 2012). In-
tersection Over Union (IOU) is a measure that eval-
uates the overlap between two bounding boxes. It
requires a ground truth bounding box B
gt
and a pre-
dicted bounding box B
p
. With the help of IOU we can
tell if a detection is acceptable (True Positive) or not
(False Positive). IOU is given by the overlapping area
between the predicted bounding box and the ground
truth bounding box divided by the area common be-
tween them:
IOU =
(area(B
p
∩ B
gt
)
(area(B
p
∪ B
gt
)
• True Positive (TP): IOU >= threshold
• False Positive (FP): IOU < threshold
• False Negative (FN): A ground truth not detected
• True Negative (TN): Correct detection of a nega-
tive instance. Concept inapplicable in our setting
Precision is a measure of the ability of a model to
identify only the relevant objects. It is the percentage
of correct object detection among all detection. Recall
is the ability of a model to detect all the relevant ob-
jects (all ground truth bounding boxes). It is the per-
centage of the relevant objects that are correctly de-
tected. To understand the performance of object de-
tectors we use the metric the Area Under the Curve
(AUC) of the Precision x Recall Curve (Everingham
et al., 2012). Average Precision (AP) is obtained
by interpolating the precision at each recall level r,
taking the maximum precision whose recall value is
greater or equal than r + 1. This estimated area under
the curve is calculated for each object class. Finally
the mean of AP of all classes gives mean Average Pre-
cision (mAP), the metric being used to compare dif-
ferent object detectors.
5.2 Test Evaluation
We perform evaluation on test examples as per the
split as defined in section 4.3) and compare archi-
tectures defined in section 4.2 . For comparison be-
tween the model architectures we report their infer-
ence speed in terms of GPU time and accuracy in
terms of AP as defined in section 5.1. We have set
IOU threshold to 0.5 to define true positives for all
the architectures. All models provide a confidence
score for each predicted bounding box which tells
how confident the model is about the bounding box.
We tested different confidence scores from 0.001 to
0.5 and found that 0.5 gives least number of false pos-
itives. All test results have been reported on confi-
dence score 0.5.
Table 1: Results on Well Dataset. FasterRCNN Gives
the Best Accuracy but Performs Poor in Terms of Speed
Whereas YOLO Models Though Being Faster Lags in Ac-
curacy.
Model AP
Inference
time
(ms/image)
YOLOv3 61.0 % 60.5
tinyYOLOv3 82.8 % 18.9
FasterRCNN 94.0 % 146.6
RetinaNet (Resnet50) 86.9 % 64.1
RetinaNet (Resnet101) 89.5 % 84.4
Table 1 and Table 2 show overall performance of all
the models on Well dataset and Farm Ponds dataset
respectively in terms of accuracy and speed. In terms
of accuracy, FasterRCNN performs the best at 94%
for wells and 95.9% accuracy for farm ponds whereas
YOLOv3 has the lowest accuracy in both the datasets.
Figure 6 and Figure 7 show the detection results ob-
tained on all models on well dataset and farm pond
dataset respectively. FasterRCNN result has the cor-
rect prediction with tighter bounds with ground truth
Aiding Irrigation Census in Developing Countries by Detecting Minor Irrigation Structures from Satellite Imagery
213
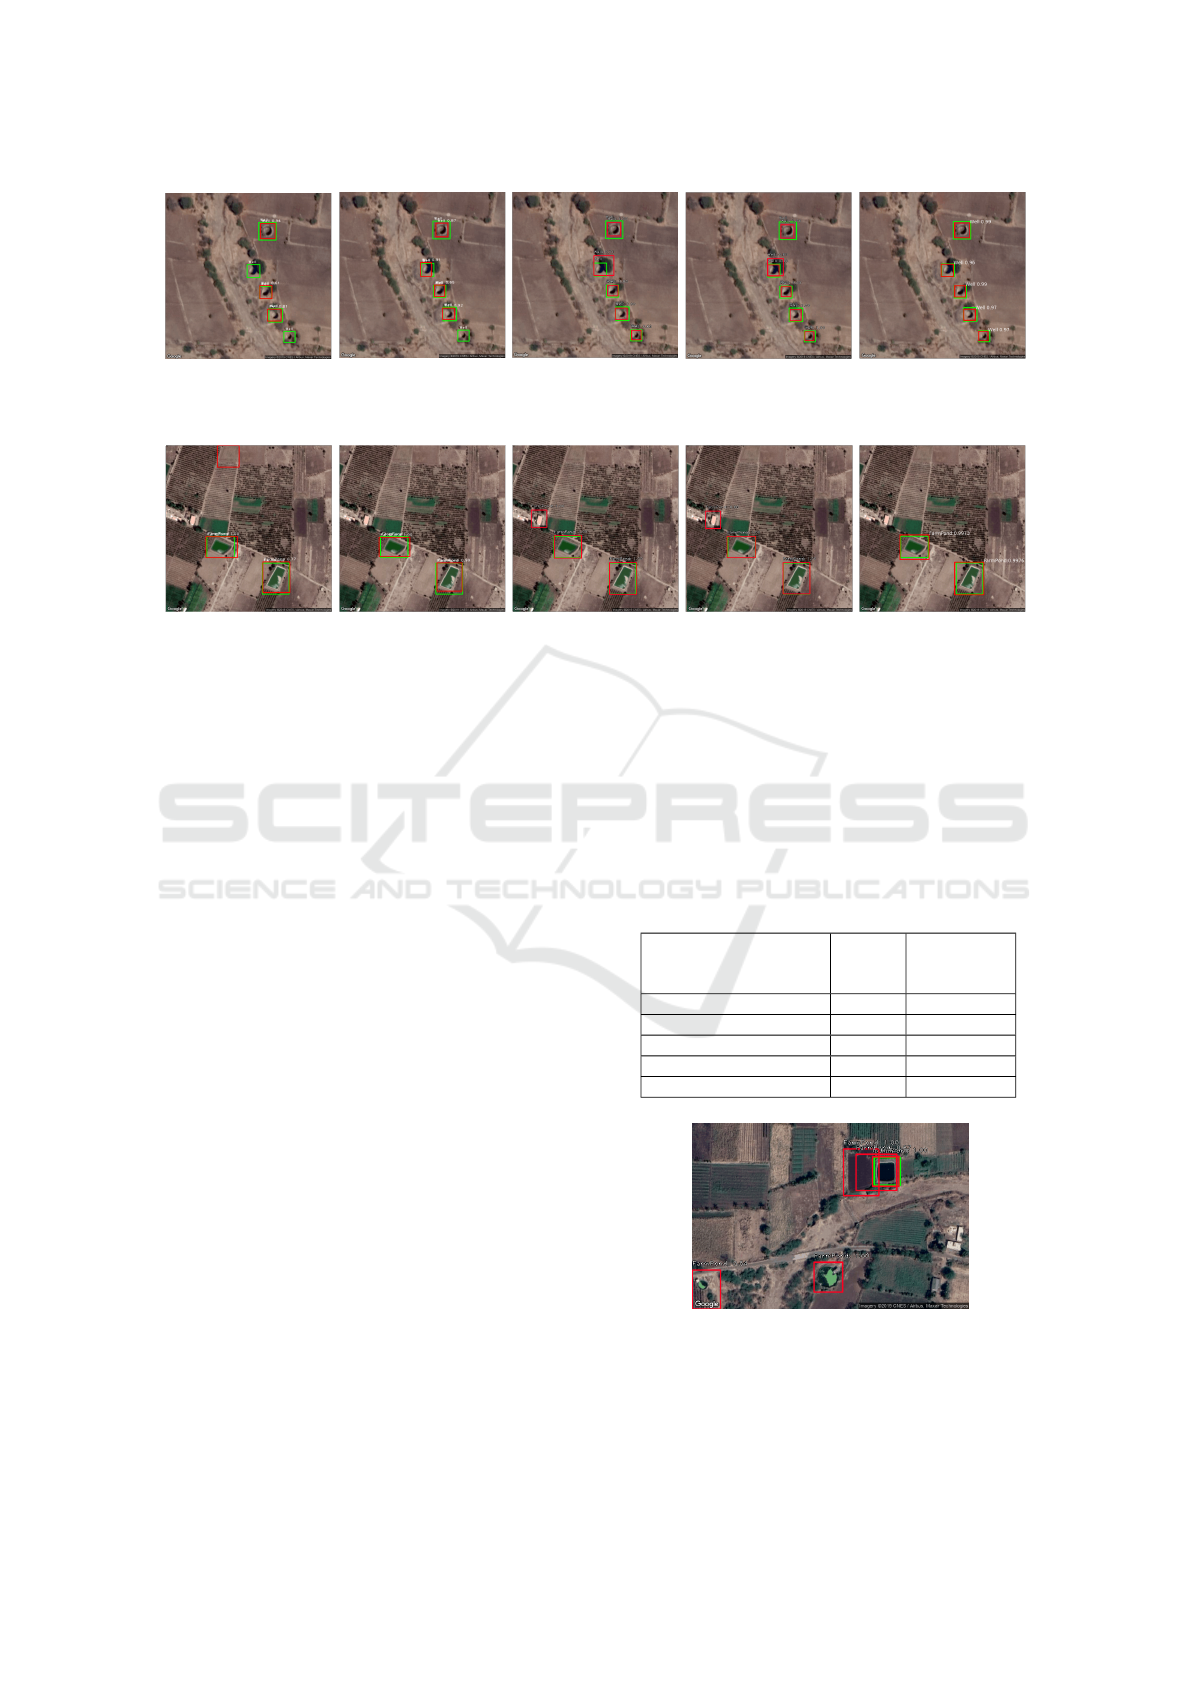
Figure 6: Results on Well Dataset. In Left to Right Order: YOLOv3, tinyYOLOv3, RetinaNet(ResNet50), Reti-
naNet(Resnet101), FasterRCNN. Green Rectangles Denotes Ground Truth and Red Rectangles Denotes Prediction. In
YOLOv3 and tinyYOLOv3 Some Wells Have Been Missed out.
Figure 7: Results on Farm Pond Dataset. In Left to Right Order: YOLOv3, tinyYOLOv3, RetinaNet(ResNet50), Reti-
naNet(Resnet101), FasterRCNN. Green Rectangles Denotes Ground Truth and Red Rectangles Denotes Prediction.
whereas other models either have False negatives or
False positives. Note that our results do not confirm
with (Lin et al., 2017) where they had achieved best
accuracy on RetinaNet models trained compared to
FasterRCNN on COCO dataset whereas in our case
FasterRCNN still leads in accuracy. RetinaNet mod-
els lag by a huge margin for wells but show competi-
tive accuracy for farm ponds although we found some
results on farm ponds with spurious detection. As
seen in Figure 8 farm and bigger sized wells were de-
tected as farm ponds. RetinaNet(Resnet101) though
having more layers does not necessarily perform bet-
ter than RetinaNet(Resnet50) atleast in case of farm
ponds. Also YOLOv3 misses out many wells and
gives poor recall value thus affects the average pre-
cision. It seems that farm ponds achieve good accu-
racy compared to wells for all the models. This may
be because wells are smaller in size as compared to
farm ponds and more challenging to predict due to the
presence of similar looking structures like trees and
shadow of trees which accounts to more false posi-
tives.
In terms of speed, as seen in the table, YOLO
models are faster in inference time as compared to
FasterRCNN and RetinaNet models though strug-
gling with accuracy. We can see that tinyYOLO
model takes the least amount of time in both the
datasets due to tinyYOLO’s lighter design and less
number of convolutional layers. Though FasterRCNN
performs very well in case of accuracy but lags in
inference time due to its structure of two stage de-
tection. RetinaNet known for finer accuracy and
speed has inference time similar to YOLO mod-
els for RetinaNet(ResNet50). RetinaNet(Resnet101)
has decent accuracy but is slower compared to Reti-
naNet(Resnet50). Since, RetinaNet(Resnet50) has
accuracy simil ar to FasterRCNN and speed similar to
YOLOv3, it provides a sweet spot between accuracy
vs speed tradeoff and can be considered as a choice
when both speed and accuracy are important.
Table 2: Results on Farm Pond Dataset. FasterRCNN Has
the Slowest Inference Time among All the Models Whereas
tinyYOLOv3 Is the Fastest.
Model AP
Inference
time
(ms/image)
YOLOv3 81.7 % 63.0
tinyYOLOv3 92.2 % 18.4
FasterRCNN 95.9 % 151.2
RetinaNet (Resnet50) 95.2 % 62.7
RetinaNet (Resnet101) 94.3 % 99.7
Figure 8: Some Spurious Detections Leading to False Pos-
itives in Results of RetinaNet(Resnet50) on Farm Pond
Dataset. Green Rectangles Denote Ground Truth, Red De-
note Prediction.
GISTAM 2020 - 6th International Conference on Geographical Information Systems Theory, Applications and Management
214

6 CONCLUSIONS
We have built a web-based innovative system for au-
tomatic recognition of structures like wells and farm
ponds. Our system has better accuracy as well as
faster detection time compared to earlier systems. We
have introduced two new public datasets, using which
we explore the trade-off between object detection ac-
curacy and inference time. We find FasterRCNN to
be giving the best accuracy though very high infer-
ence time, tinyYOLOv3 to be the fastest but lagging
in accuracy, and RetinaNet providing the golden mean
having both good accuracy as well as reasonable in-
ference time.
REFERENCES
Abhay N (2016). How to get shettale subsidy for farm pond
in 2016. URL: http://indiamicrofinance.com/shettale-
subsidy-farm-pond-2016.htm. Online; Accessed 15-
02-2019.
Anjali Marar, T. I. E. (2019). Explained: Jalyukta shivar key
for maharashtra, but still has a long road ahead. URL:
https://indianexpress.com/article/explained/jalyukta-
shivar-key-for-maharashtra-but-still-has-a-long-road-
ahead/. Online; Accessed: 2019-12-20.
Audebert, N., Le Saux, B., and Lef
`
evre, S. (2017).
Segment-before-detect: Vehicle detection and classi-
fication through semantic segmentation of aerial im-
ages. Remote Sensing, 9(4).
Cheng, G. and Han, J. (2016). A survey on object detection
in optical remote sensing images. ISPRS Journal of
Photogrammetry and Remote Sensing, 117.
Dorrer, G., Koriukin, M., Yushkova, S., and Sviridova, L.
(2019). Vehicle detection in aerial images. IOP Conf.
Series: Earth and Environmental Science.
Everingham, M., Van Gool, L., Williams, C. K. I., Winn,
J., and Zisserman, A. (2012). The PASCAL Visual
Object Classes Challenge 2012 Results.
Frenken, K. (2012). Irrigation in Southern and Eastern Asia
in figures - AQUASTAT Survey 2011.
Girshick, R. (2015). Fast r-cnn. In 2015 IEEE Intl. Conf.
on Computer Vision.
Girshick, R., Donahue, J., Darrell, T., and Malik, J. (2014).
Rich feature hierarchies for accurate object detection
and semantic segmentation. In IEEE Conf. on Com-
puter Vision and Pattern Recognition.
Google Static Maps (2019). Google maps javascript api
v3 reference. URL: https://developers.google.com/
maps/documentation/ javascript/reference/3.37. On-
line;Accessed 04-January-2020.
He, K., Zhang, X., Ren, S., and Sun, J. (2014). Spatial pyra-
mid pooling in deep convolutional networks for visual
recognition. Lecture Notes in Computer Science.
Kirpich, P. Z., Haman, D. Z., and Styles, S. W. (1999). Prob-
lems of irrigation in developing countries. Journal of
Irrigation and Drainage Engineering, 125(1).
Lin, T., Doll
´
ar, P., Girshick, R., He, K., Hariharan, B., and
Belongie, S. (2017). Feature pyramid networks for
object detection. In IEEE Conf. on Computer Vision
and Pattern Recognition.
Lin, T.-Y., Goyal, P., Girshick, R., He, K., and Dollar, P.
(2017). Focal loss for dense object detection. In The
IEEE Intl. Conf. on Computer Vision.
Lin, T.-Y., Maire, M., Belongie, S., Bourdev, L., Girshick,
R., Hays, J., Perona, P., Ramanan, D., Zitnick, C. L.,
and Doll
´
ar, P. (2014). Microsoft coco: Common ob-
jects in context.
MRSAC (2015). Maharashtra remote sensing ap-
plication centre. jalyukt shivar , water con-
servation department, mantralaya, mumbai.
URL:http://mrsac.maharashtra.gov.in/jalyukt/. On-
line; Accessed: 2019-09-15.
NIC , MeitY. (2014). National informatics centre. fifth
census of minor irrigation schemes. URL: http://
mi5census-data.nic.in/nologin/introduction.action.
Online; Accessed: 2019-09-20.
Prasad, P. and Sohoni, M. (2018). Farmponds for horticul-
ture: Boon or curse? analysing impact on farm prof-
itability, resource sustainability and social welfare. In
Proc., 36th Intl. Conf. of the System Dynamics Society.
Redmon, J., Divvala, S., Girshick, R., and Farhadi, A.
(2016). You only look once: Unified, real-time ob-
ject detection. In Conf. on Computer Vision & Pattern
Recognition.
Redmon, J. and Farhadi, A. (2018). Yolov3: An incremental
improvement. arXiv.
Ren, S., He, K., Girshick, R., and Sun, J. (2017). Faster
r-cnn: Towards real-time object detection with region
proposal networks. volume 39.
Russakovsky, O., Deng, J., Su, H., Krause, J., Satheesh, S.,
Ma, S., Huang, Z., Karpathy, A., Khosla, A., Bern-
stein, M., Berg, A. C., and Fei-Fei, L. (2015). Im-
agenet large scale visual recognition challenge. Intl.
Journal of Computer Vision (IJCV), 115(3).
Saito, S. and Aoki, Y. (2015). Building and road detection
from large aerial imagery. In Lam, E. Y. and Niel,
K. S., editors, Image Processing: Machine Vision Ap-
plications VIII, volume 9405. SPIE.
Uijlings, J., Sande, K., Gevers, T., and Smeulders, A.
(2013). Selective search for object recognition. Intl.
Journal of Computer Vision, 104.
V. K. Bhatia, et. al (2010). Evaluation of Rationalization
of Minor Irrigation Statistics (RMIS) Scheme, Indian
Agriculture Statistice Research Institute, New Delhi.
Vakalopoulou, M., Karantzalos, K., Komodakis, N., and
Paragios, N. (2015). Building detection in very high
resolution multispectral data with deep learning fea-
tures. In 2015 IEEE Intl. Geoscience and Remote
Sensing Symposium (IGARSS).
Wagh, P., Das, D., and Damani., O. (2019). Well detec-
tion in satellite images using convolutional neural net-
works. In Proc., 5th Intl. Conf. on Geographical Infor-
mation Systems Theory, Applications & Management.
Yang, F., Chen, H., Li, J., Li, F., Wang, L., and Yan, X.
(2019). Single shot multibox detector with kalman
filter for online pedestrian detection in video. IEEE
Access, 7.
Yuan, J. (2018). Learning building extraction in aerial
scenes with convolutional networks. IEEE Transac-
tions on Pattern Analysis and Machine Intelligence.
Yuan, J., Yang, H. L., Omitaomu, O. A., and Bhaduri, B. L.
(2016). Large-scale solar panel mapping from aerial
images using deep convolutional networks. In 2016
IEEE Intl. Conf. on Big Data.
Aiding Irrigation Census in Developing Countries by Detecting Minor Irrigation Structures from Satellite Imagery
215
