
Software Quality Observation Model based on the ISO/IEC 29110 for
Very Small Software Development Entities
Alexander Redondo-Acu
˜
na and Beatriz Florian-Gaviria
Escuela de Ingenier
´
ıa de Sistemas y Computaci
´
on, GEDI Research Group, Universidad del Valle,
Keywords:
ISO/IEC 29110, Software Development Process, Observation Model, Indicators, Software Metrics, Software
Quality Management Models.
Abstract:
An imbalance exists between quality of software development for researchers on the one hand, and produc-
tivity for software industry on the other hand. However, clients demand to have both. So, this is a gap
between researchers and the software industry. Therefore, it is necessary to attune software quality research to
the productivity. Also it is necessary that software industry can understand the benefit of incorporating quality
practices bonded to productivity. This paper proposes an observation model that allows to model internal prac-
tices of a small software development organization in comparison to those described in the ISO/IEC 29110
standard. It consists of four main components. First a visual frame of three axes: 1) the process domains
and subdomains based on the profile process; 2) Roles and 3) Maturity level. Second, a battery of indicators
on this three-dimensional visual frame. Third, a series of surveys designed for primary data collection from
employees performing roles of the model in Very Small Entities (VSEs), and fourth, results of surveys allow
disclosing values to compute metrics of indicators.
1 INTRODUCTION
The practical impact of software engineering (SE) re-
search is important for the software industry in the
long run. Nevertheless, there is still a wide gap be-
tween SE researchers and the software industry. For
instance, while SE research is more concerned about
software quality, the software industry is more de-
voted to productivity (Ivanov et al., 2017).
The software industry is dealing with practical
ways to understand the relation between software
quality standards, the enhance of its software devel-
opment process, and its relation with productivity and
export. In general, the software industry needs to keep
looking for new niches, customers and export their
products or services. Although, in many countries it’s
necessary to certify the software quality process ac-
cording to some standard. The ISO/IEC 29110 (ISO,
2016) is a standard created to improve the competi-
tiveness and global inclusion of companies dedicated
to software development, especially Very Small Enti-
ties (VSEs), organizations with 25 employees or less
(Laporte and O’Connor, 2016). This standard de-
fines the set of practices and minimum documenta-
tion for VSEs in the software development life cycle
(Munoz et al., 2018). VSEs are called to undertake
ventures with the purpose of reactivating the econ-
omy and building more opportunities of employment
(Merch
´
an and Urrea, 2007). One way of doing so is
that VSEs being able to export, so, VSEs needs to im-
plement ISO / IEC 29110 in the first step.
VSEs face some problems such as shortcomings
in the application of good engineering practices that
allow domestic producers to achieve better ratings
against widely recognized quality models (Toro Lazo,
2013). Due to their characteristics, and limitations,
these VSEs have difficulty in applying methodolo-
gies, techniques and best practices to improve the
quality of their products and their productivity. Thus,
usually this reflected in improvisation, lack of plan-
ning, inadequate sizing, overestimated benefits. The
costs and times underestimated in their projects, be-
come large items, which at the time of implementa-
tion translate into financial overruns or cancellation
(Campo Amaya, 2008).
VSEs require studies and tools that produce de-
tailed and accurate information on all significant vari-
ables to improve the competitiveness of this indus-
try at the regional, national and international levels
(Merch
´
an and Urrea, 2007). In the case of Colombia,
Software industry studies are made by FEDESOFT.
However, these studies are more concerned with big
446
Redondo-Acuña, A. and Florian-Gaviria, B.
Software Quality Observation Model based on the ISO/IEC 29110 for Very Small Software Development Entities.
DOI: 10.5220/0009418504460453
In Proceedings of the 15th International Conference on Evaluation of Novel Approaches to Software Engineering (ENASE 2020), pages 446-453
ISBN: 978-989-758-421-3
Copyright
c
2020 by SCITEPRESS – Science and Technology Publications, Lda. All rights reserved

software companies and not VSEs. VSEs in Colom-
bia are of interest due to they are 80% of the software
industry.
The ISO/IEC 29110 standard is a valuable contri-
bution to the construction of a quality software devel-
opment process for VSEs. However, VESs software
development companies are confused at the process
of understanding and obtaining the ISO/IEC 29110
international standard certification.
The paper (Abuchar Porras et al., 2012) concludes
that knowledge is needed in the use of software devel-
opment quality standards in VSEs, and to train em-
ployees the standard they implement. Also, recom-
mend developing a measurement instrument for mod-
els, methodologies, software development life cycle
and quality standards in software development pro-
cesses.
These needs raise the central question of this re-
search: how to observe the quality of software devel-
opment processes in VSEs?. The objective of this pa-
per is to give them a method to measure their quality
status in the software development process to VSEs;
addressed by the ISO/IEC 29110 Basic Profile and
not to focus on the product quality of the software
described in ISO/IEC 25010. The ISO/IEC 29110
Basic Profile includes very few references to product
quality characteristics as described in ISO/IEC 25010
(Garc
´
ıa-Mireles, 2016). In the systematic review pub-
lished in (Munoz et al., 2018). It has been shown
that have been developed more frameworks than tools
for quality management in software development pro-
cesses. An example of this is (Krouska et al., 2019).
All in all, this paper proposes an observation
model that allows to model internal practices of a
small software development organization in compari-
son to those described in the ISO/IEC 29110 standard.
This work, funded by the Regional Government, it is
intended to be tested for the Valle del Cauca region
in Colombia. But, this observation model could be
applied globally. The proposed observation model al-
lows us to make visible the activities and guides that
the ISO/IEC 29110 standard demands for each matu-
rity level, and disclose which of them are performed
by a VSE. VSEs would be aware of the utility of the
standard, its guides, and the implementation of stan-
dard activities in software development to improve the
software quality process.
This paper is structured as follows. Section 2 de-
scribes the proposed model to measure software qual-
ity development based on ISO/IEC 29110. Section 3
presents the software to gather data, to compute indi-
cators, and to produce data visualization. Section 4
presents the battery of indicators. Section 5 provides
the validation of the battery indicators. Section 6 con-
cludes the paper.
2 PROPOSED MODEL
The evaluation of administration and development of
software projects in VSEs requires the observation
and measurement of performed processes and tasks.
Within the study of the software life cycle, the pro-
cesses and tasks of development, we can find a series
of concepts, actors, and goals or objectives that are
commonly handled by the models, standards, and de-
velopment standards. The ISO/IEC 29110 standard is
devoted to defining processes and tasks for the VSEs
in software development. In this standard deployment
packages (DP) (ISO/IEC, 2011) are a set of artifacts
developed to facilitate the implementation of a set of
practices but, a deployment package is not a complete
process reference model. Moreover, this standard also
defines the roles involved in each process. The stan-
dard defines four levels of maturity that VSEs can
certificate depending on their number of DP and the
number of roles performed.
To observe and evaluate the quality of processes
and tasks performed by different VSEs, the ISO/IEC
29110 is a good conceptual framework to lead it, but
in this standard it is not clear how to measure the qual-
ity of each task. It is necessary to produce a way to
measure or assess the quality of each task and pro-
cess. The set of measures can determine a global as-
sessment of the quality of the VSEs, and to establish
how far are these VSEs to achieve a certification that
allows it to export software. Finally, visual represen-
tation to understand the evaluation points could allow
VSEs to be more aware of their overall quality condi-
tion. The observation model of three axes was created
to be able to visualize the assessment of software de-
velopment tasks performed by a VSE and to be able to
observe the general level of maturity of the VSE. The
sections below explain in detail the three axes of the
proposed observation model and its relationship with
the ISO/IEC 29110 standard.
2.1 Process Domains and Subdomains
Process domains don’t need to have a sequence in
their construction, they do not have process depen-
dencies. Therefore, process domains can be built
or not depending on the needs or the profile of the
VSE. Existing nine process domains in the obser-
vation model focuses on the Software Implementa-
tion process. Thus, process domains in the proposed
model are: 1) Requirements Analysis (RA), 2) Archi-
tecture and Detailed design (DA), 3) Construction and
Software Quality Observation Model based on the ISO/IEC 29110 for Very Small Software Development Entities
447

Unit Testing (CT), 4) Integration and Testing (IT), 5)
Verification and Validation (VV), 6) Version Control
(VC), 7) Self-Assessment (SA), 8) Product Delivery
(PD). 9) Project Manager (PMD).
Each process domain has subdomains that are
performed by one or more roles. In observation
model, subdomains must be developed within each
process domain. As the subdomains can be met
in different ways, it can not be a simple check-
list. It is necessary to create indicators to measure
since companies have different practices to do subdo-
mains. All subdomains of the SI process will list next.
Requirements Analysis (RA)
1. Review the project plan with the work team(WT).
2. Elicit acquirer and other stakeholders’ requirements
and analyze system context.
3. Review stakeholders’ requirements specifications with
the project manager(PMR).
4. Baseline stakeholders’ requirements specification.
5. Capture system requirements and interfaces.
6. Capture system element(s) and interface requirements.
7. Verify and obtain WT agreement on the system require-
ments specification.
8. Validate that system requirements specification satisfies
stakeholders’ requirements specification.
9. Define or update traceability between requirements.
Architecture and Detailed Design (DA)
1. WT review of the project plan to determine task assign-
ment.
2. Design the system functional architecture and associ-
ated interfaces, allocation of the functional to the phys-
ical architecture.
3. WT review of the system requirements specifications.
4. Functional and physical design verified and defects cor-
rected.
5. Verified IVV plan (integration, verification, validation,
qualification) and verification procedures.
6. Traceability between the functional architecture defi-
nition and the System Requirements and between the
physical architecture definition, the system elements
and the functional architecture definition.
7. Design products placed under configuration manage-
ment.
Construction and Unit Testing(CT)
1. WT review of the project plan to determine task assign-
ment.
2. Work team review of the physical design.
3. Hardware System Elements to be developed and tested.
4. Software system elements to be developed and tested.
5. Traceability between hardware construction, software
construction and physical architecture.
Integration and Testing (IT)
1. Understand test cases and test procedures.
2. Set or update the testing environment.
3. Integrates the software using software components and
defines or updates test cases and test procedures for in-
tegration.
4. Perform tests using test cases and test procedures for
integration and document results in a test report.
Verification and validation (VV)
1. Verification of design, test cases and test procedures.
2. Verify software construction.
3. Software test for integration.
4. Verification of maintenance documentation.
Version Control (VC)
1. Planning and setting up repository
2. Version identification
3. Change control
Self-Assessment (SA)
1. Analysis of process coverage.
2. Identification of improvement opportunities.
3. Walk-through before performing a process.
4. Walk-through after performing a process.
Product Delivery (PD)
1. Assign tasks to the work team members related to their
role, according to the current project plan.
2. Understand software configuration.
3. Document the maintenance documentation or update
the current one.
4. Verification of the maintenance documentation.
5. Incorporate the maintenance documentation as a base-
line for the software configuration.
6. Perform delivery according to delivery instructions.
Project Manager (PMD)
1. Project planning process.
2. Project plan execution.
3. Project assessment and control process.
4. Project closure.
2.2 Roles
A defined function that a member of the project team
must perform (noa, 2017). This is the alphabeti-
cal list of the roles in the proposed model: Ana-
lyst (AN), customer, designer (DES), the programmer
(PR), project manager (PMR), technical leader (TL),
work team (WT). Table 2 is an alphabetical list of the
roles, abbreviations and description of required com-
petencies.
ENASE 2020 - 15th International Conference on Evaluation of Novel Approaches to Software Engineering
448
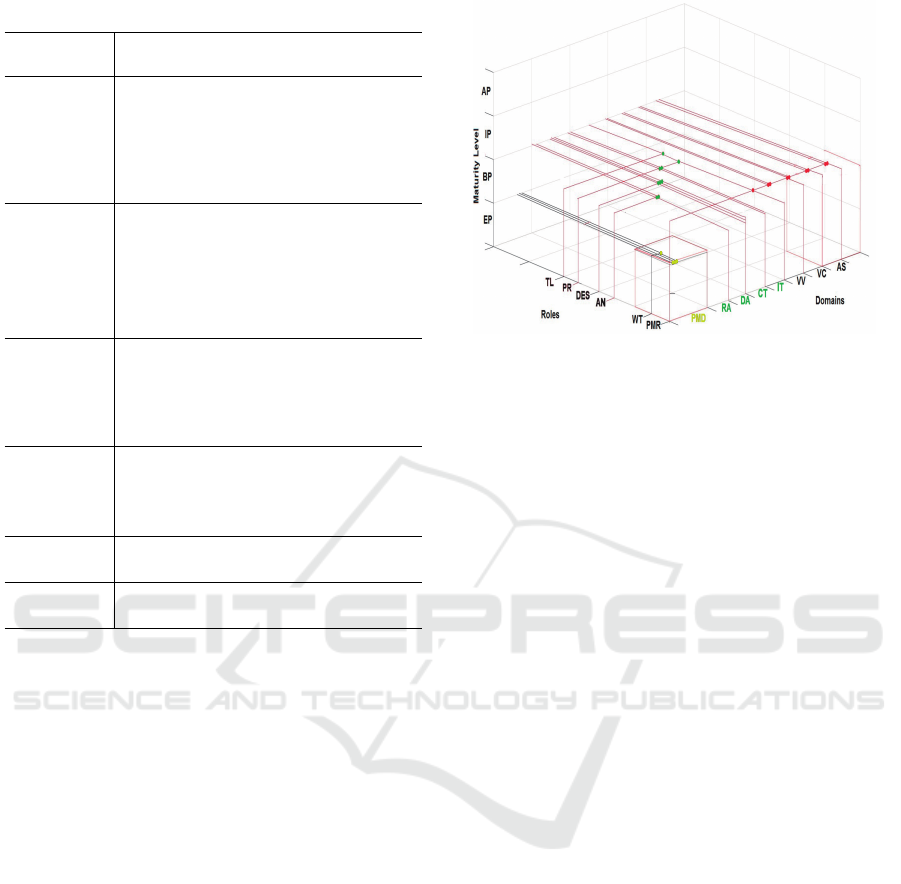
Table 1: Role Description. Based on ISO/IEC 29110.
Role
Competencies
Analyst (AN)
Knowledge and experience eliciting, specifying
and analyzing the requirements.
Knowledge in designing user interfaces.
Knowledge of the revision, editing techniques and
experience on software development and mainte-
nance.
Designer
(DES)
Knowledge and experience in the software compo-
nents and architecture design.
Knowledge and experience in the planning and per-
formance of integration and system tests.
Knowledge of the revision, editing techniques and
experience on software development and mainte-
nance.
Programmer
(PR)
Knowledge and/or experience in programming, in-
tegration and unit tests.
Knowledge of the revision, editing techniques and
experience on software development and mainte-
nance.
Project man-
ager (PMR)
Leadership capability with experience making de-
cisions, planning, personnel management, delega-
tion and supervision, finances and software devel-
opment.
Technical
leader (TL)
Knowledge and experience in software develop-
ment and maintenance.
Work team
(WT)
Knowledge and experience according to their roles
on the project: AN, DES, and/or PR.
2.3 Maturity Levels of VSEs
Maturity levels are the stages of maturation of pro-
cesses that appear in the progressive path towards
growth and stability as independent and competitive
software development. In the proposal model, matu-
rity levels are in agreement with some profile of the
ISO/IEC 29110 standard: Entry level (EL) is targeted
to VSEs working on small projects and for start-up
VSEs. Basic level (BL) describes the development
practices of a single application by a single project
team. Intermediate Level (IL) is targeted at VSEs de-
veloping multiple projects with more than one team.
Advanced Level (AL) is targeted at VSEs wishing
to sustain and grow as independent competitive busi-
nesses. This set of four levels, providing a progressive
approach to satisfying the requirements of a generic
profile group, is based on (O’Connor and Laporte,
2017).
Figure 1 shows the data visualization of an ex-
ample of a VSE assessment using this observation
model. Indicators of the observation model are calcu-
lated and placed according to the axes of the model.
Figure 1: Visualization of a VSE assessment.
Source: The authors
3 WEB APPLICATION
A web software application is under construction to
primary source data collection, to compute indicators,
and to produce data visualizations. It has a first func-
tional module of surveys. Surveys must be applied to
people performing each one of the roles of software
development within the VSEs. The second part of the
web application is the one that computes the indica-
tors, produces their interpretations and appropriate vi-
sualizations.
To gather solid and valid data, that can be analyzed
uniformly and coherently, an adequate instrument is
needed to standardize the process. The instruments
used are surveys for each role. The phases or steps
in the data gathering recommended by Ruiz (Bol
´
ıvar,
2002) were used. Surveys will serve to collect inputs
of indicators. Each indicator will need one or more
questions that capture the needed values to compute
the metric of the indicator. Surveys are delivered by
roles, in total there are six surveys constructed, ques-
tions can be updated. Figure 2 shows the preliminary
design for the analyst role survey.
The presentation of results (indicators and other
reports) in the user interface uses elements such as
tables, graphs, files and info-graphics. “Dashboards
and visualization are cognitive tools that improve
your ‘span of control’ over a lot of business data.
These tools help people visually identify trends, pat-
terns and anomalies, reason about what they see and
help guide them toward effective decisions. As such,
these tools need to leverage people’s visual capabili-
ties.” (Brath and Peters, 2004)
Figure 3 shows the example of visualization for
the indicator ”advance of the execution” in the re-
quirements analysis domain.
Software Quality Observation Model based on the ISO/IEC 29110 for Very Small Software Development Entities
449
Table 2: Characteristics of the 22 proposed indicators.
ID Name Metric unaccepted accept optimal
01 RA-1-AN-PB Advance of execution of
tasks of analysis of require-
ments
A = Tasks total;
B = Tasks already completed;
PA = % of advances planned tasks
PA = (B/A) *100
<70% >70% >90%
02 RA-2-AN-PB Annual average of advances
of analysis of requirements
PA
i
= % de avance RA by project;
n
proyectos
= # of project by year;
PAA =
∑
PA
i
/ n
proyectos
<70% >70% >90%
03 DA-1-DES-PB Number of information se-
curity incidents
NIS = # totaltotal incidents SI ;
NIA = # failed access attempts ;
NIC = # incidents unauthorized access ;
NID = # destruction or loss of data.
NIS = NIA + NIC + NID
>100 <50 <30
04 DA-2-DES-PB Average of operating sys-
tems
Xi = # operating systems (OS) to support by projects;
A = # annual projects;
X = average OS;
X =
∑
X
i
/ A
0 1 >1
05 DA-3-DES-PB Average number of different
programming languages im-
plemented in the project
A = # functional requirements;
Xi = programming language to implement the requirement;
PTI =
∑
X
i
/ A
>100 <50 <30
06 CT-1-PR-PB Test coverage
A = # of test cases of the testing plan;
B = # of test cases performed;
TC = (A/B)
<0.7 >0.7 >0.8
07 CT-2-PR-PB Successful corrections
A = # corrections did not resolve bugs;
B = # corrections resolve bugs, but inject new defect;
C = # faulty corrections;
C = A+ B;
D = # total corrections made;
E = # total successful corrections;
E = D −C;
PCE = (E/D) ∗100
<70% >70% >80%
08 IT-1-PR-PB % of corrected incidents
B = # of incidents found;
A = # incidents to correct;
X = (A/B) ∗100
<70% >70% >90%
09 IT-2-TL-PB Response time
A = time Design specifications;
B = time to test the complete route of a transition;
C = time to test complete product modules;
X = A +B +C(h)hour
>24h <16h <8h
10 IT-3-PMR-PB Sufficiency of the tests
A = # of test cases in the testing plan;
B = # of required test cases;
X = A/B
<70% >70% >90%
11 VV-1-PMR-PB Obvious functions
A = # of obvious functions to the user.
B = # total functions.
X = A/B
<0.7 >0.7 >0.8
12 VV-2-PMR-PB Change Registrant
A = # confirmed changes;
B = # total changes modified;
X = A/B
<0.7 >0.7 >0.9
13 VC-1-PMR-PB Percentage of artifacts for
version control created by
project
PA = # total of planned artifacts;
CA = # created artifacts;
PCA = (AR/AP) ∗100
<0.7 >0.7 >0.9
14 VC-2-PMR-PB Average number of possible
artifacts created in the year
NP = # projects;
PCA
i
= % artifacts by projects;
NPA = average artifacts created by year;
NPA =
∑
PCA
i
/NP
<70% >70% >90%
15 SA-1-PMR-PB Functionality coverage
C = Functionality coverage;
A = # of missing functionalities detected in the evaluation;
B = # of functionalities established in the specification;
C = 1 − A/B
<0.7 >0.7 >0.9
16 SA-2-PMR-PB Average number of possible
artifacts created in the year
NP = # number of projects;
NPA
i
= number of possible artifacts created by project;
NPA = (
∑
NPA
i
)/NP
<0.7 >0.7 >0.9
17 PD-1-PMR-PB Sum of projects accepted by
the client during the year
n = # of project by year;
PA = # Projects accepted;
PA = PA/n
<0.7 >0.7 >0.9
18 PD-2-PMR-PB Ease of software installation
FI = Flexibility and customization of the software installation capacity;
A = # of installation operations implemented;
B = # of installation operations required;
FI = A/B
<0.7 >0.7 >0.9
19 PMD-1-PMR-PE % compliance with estab-
lished quality characteristics
A = # quality requirements implemented;
B = # total quality requirements established;
X = (A/B) ∗100
<70% >70% >90%
20 PMD-2-PMR-PE % of time required to com-
plete project
A = Time used to carry out the project;
B = Planned time for the realization of the project;
X = (A/B) ∗100
<70% >70% >90%
21 PMD-3-WT-PE Advance of execution of
planned activities
A = # of complete tasks;
B = # of proposed task;
X = (A/B) ∗100
<70% >70% >90%
22 PMD-4-WT-PE Difference between planned
and actual tasks
A = # task planned;
B = # actual task does;
X = A −B
>A/2 <A/2 0
ENASE 2020 - 15th International Conference on Evaluation of Novel Approaches to Software Engineering
450
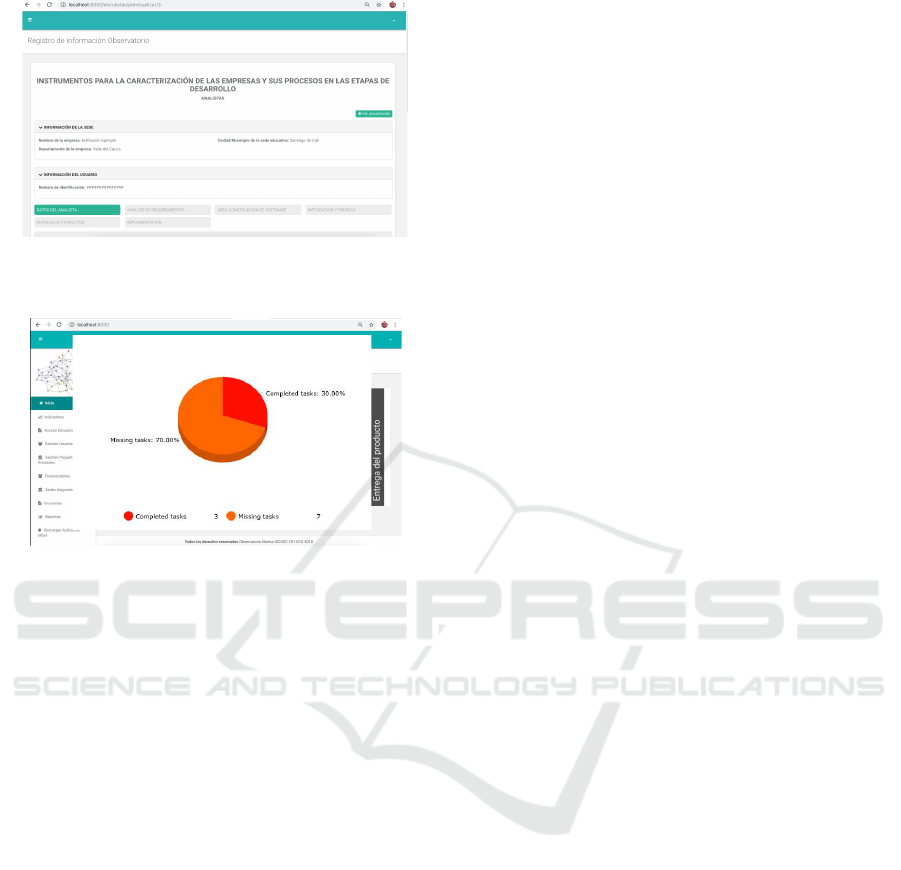
Figure 2: Survey header in the prototype software made for
the role: Analyst.
Figure 3: Example of data visualization for an indicator.
4 BATTERY OF INDICATORS
An indicator is an instrument that provides quantita-
tive evidence about whether a completed condition
exists or whether a certain result has been achieved
or not. In the case of not achieving the result allows
to evaluate the progress made. In this case, compli-
ance with the standard must be measured about man-
agement and implementation activities made by the
VSE, concerning the software life cycle.
At the time of the conceptual analysis, 22 in-
dicators were identified based on the needs of the
government sector from which 6 indicators emerged:
(MinTic, 2015), 10 indicators of the ISO standards
(12207, 29110)(Singh, 1996) (ISO/IEC, 2015) and
academic concepts such as (Kan, 2002) were built
into 6 indicators.
To select the appropriate indicators, the following
strategy was used. 1. Seek indicators used by govern-
ment, academy, and private industry. 2. Select from
that set of indicators those that could be calculated us-
ing variables collected by data from primary harvest
(surveys).
After applying this strategy, the resulting indica-
tors were arranged in the observation cube. Ergo the
proper domain process, subdomain, role, and matu-
rity level where selected for each indicator in the set.
Thereby, indicators are located at some point within
the observation cube see Figure 1. An indicator posi-
tion depends on the process domain/sub-domain, the
role, and the maturity level of the observed company.
It is important to notice that, although many indi-
cators were discarded for this study, because it was
not feasible to calculate them using surveys to em-
ployees, other indicators can be added to the three-
dimensional observation model if another source of
calculation were possible in the future.
In this first version, the battery of indicators is
more devoted to the project manager role, because it
is the role with more interaction throughout the soft-
ware development, although there are a few indicators
for other roles. Also, in this first version of the battery
of indicators, the maturity level entry profile and ba-
sic profile were preferred, because they are currently
the profiles for which the standard defines guidelines
and documentation.
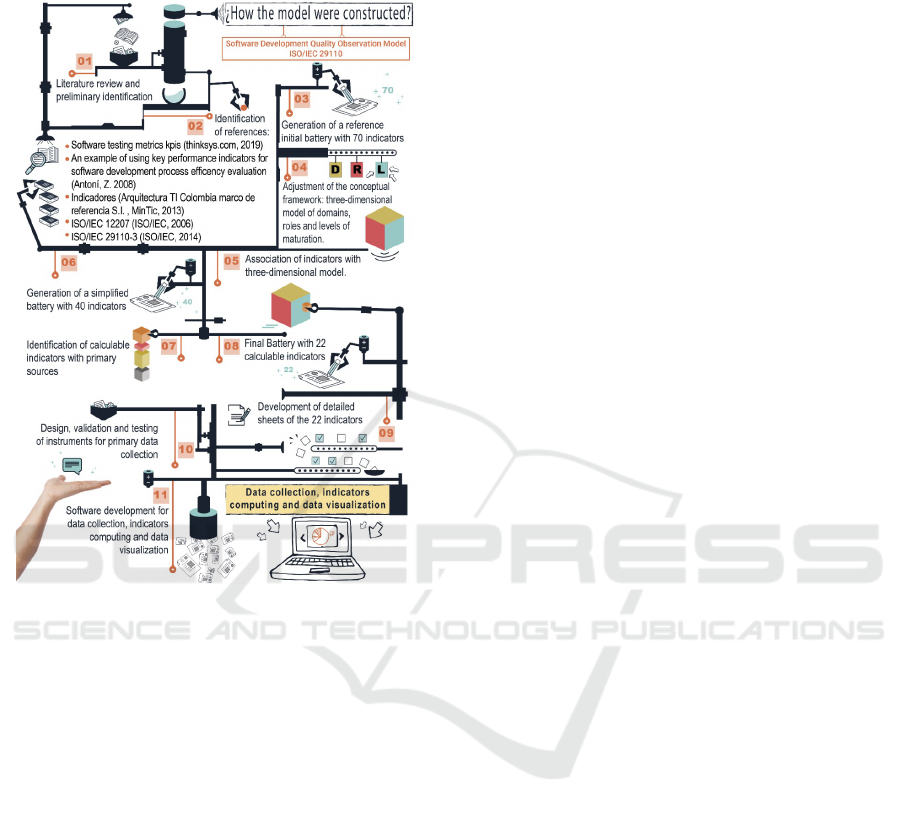
Figure 4 portrays the methodology used to con-
struct and validate the model and its indicators in
eleven steps.
It is important to describe the detailed informa-
tion that describes the indicators and it is contained
in the indicator’s sheet. Characteristics described in
these sheets are: Acronym identifier, name, descrip-
tion of use, how often it is needed to measure it, met-
ric, input-data for computing, information about how
to interpret it as well as not to misinterpret it, type
of measure (numerical, percentage, etc.), process do-
main, subdomain (task), role (person who performs
the task), maturity level (entry or basic), link to the
reference.
Due to this extension, it is not possible to show
completely the 22 sheets of indicators in this paper.
However, the authors present here a simplification of
sheets in Table 2. This table presents some character-
istics of the 22 indicators. From the original sheets
were filtered 6 columns. Column (ID) is the indicator
identifier. It consists of an acronym in which the first
two letters are the initials of the domain, followed by
a consecutive number, followed by the initials of the
role and finally the level of maturity. Column (Name),
Column (Metric) is the identifier of the metric applied
to compute the indicator. The 22 metrics of these indi-
cators are detailed in Table 2. To interpret the result of
an indicator’s metric, three levels were defined for all
indicators, namely: column unacceptable, column ac-
ceptable, and column optimal. These levels bring an
interpretation more useful than just a Boolean evalu-
ation that qualifies if the enterprise complies with the
task or not. In Figure 1 the color point represents the
assessment of indicators. The three levels of evalu-
ation are represented with three colors namely: red
Software Quality Observation Model based on the ISO/IEC 29110 for Very Small Software Development Entities
451
for unacceptable level, yellow for an acceptable level,
and green for optimal level.
Figure 4: Construction methodology of model and its indi-
cators.
5 INDICATORS’ VALIDATION
To validate the battery of indicators, a spreadsheet
was created to allow VSEs to assess whether indi-
cators met or not 12 quality criteria. The evaluation
criteria were: 1) Is the indicator easy to understand?,
2) Is the indicator of interest for VSEs?, 3) Is ade-
quate the time in which the indicator should be col-
lected?, 4) Is the indicator unambiguous?, 5) Can the
indicator be validated?, 6) Can the indicator observa-
tion be trustworthy?, 7) Is the metric to compute the
indicator correct?, 8) Can results of computing be in-
terpreted correctly?, 9) Is the indicator well classified
on its domain?, 10) Is the indicator well classified in
its role?, 11) Is the indicator well classified on its ma-
turity level?, 12) Does the indicator express what it
wanted to measure? The criteria for the election were
based on (Kerzner, 2013). VSEs evaluate these cri-
teria and allow detecting errors in the proposed indi-
cators. If the VSEs considered a quality criterion not
met, a comment of explanation or justification was de-
manded.
For this validation, at least 15 VSEs were in-
vited. Only 3 of them accept to be part of the valida-
tion study: CEO Orlando Rinc
´
on, on behalf of PAR-
QUESOFT (VSEs of software development cluster),
GreenHorizon, and RADY. The three VSEs validated
the quality criteria for the battery of indicators. The
validation results showed three main errors. First,
”missing variables in 3 metrics” (Criterion 7). Sec-
ond, ”the description of what the metric in 3 indica-
tors is short” (Criterion 12 and Criterion 1), and ”for
15 indicators the columns of levels of interpretation
are not filled” (Criterion 8). All 21 errors where fixed
to produce the last version of the battery of indica-
tors. In detail, all metrics were looked over by com-
paring with reference metrics. New variables were
added for some indicators. All interpretations of met-
rics were looked over and it was changed to those that
had not the three levels of interpretation (optimum,
acceptable, unacceptable).
6 CONCLUSIONS
This paper proposes an observation model that al-
lows to model the internal practices of an organiza-
tion and compare those with those described in the
ISO/IEC 29110 standard. The artifact visualizes the
evaluation of quality tasks expected to be performed
by VSEs in order to obtain the ISO/IEC 29110 stan-
dard certification. This work vision is to contribute
to attune software quality research with necessities
and worries of the software industry. The observa-
tion model is a three-dimensional model having 22
indicators to assess quality tasks for VSEs. The as-
sessment depends on a series of surveys that people
with specific roles in the entity fill in. Indicators are
computed with data collected from surveys. The as-
sessment interpretation for each indicator has three
levels (optimum, acceptable, unacceptable). A three-
dimensional visualization shows the assessment of the
set of indicators for a VSE. The levels of interpreta-
tion are represented in colors (green, yellow and red)
respectively. Besides, each indicator has a particular
visualization and a complete sheet of characteristics.
A software tool is being developed to promote this
observation model for VSEs on their way to ISO/IEC
29110 quality certification. Globally, this software
tool and its observation model would contribute to
have studies and reports on the real tasks and practices
performed by VSEs in the software development pro-
cess. Moreover, it would encourage the integration
of VSEs of software development to strengthen col-
laboration and research. Besides, it would allow the
training of trained persons. An empirical validation of
ENASE 2020 - 15th International Conference on Evaluation of Novel Approaches to Software Engineering
452

the model, including its battery of indicators, seems to
show the complacency of VSEs of software develop-
ment with the proposed model of assessment. More
data are needed in order to have a quantitative valida-
tion of the model. But it is very difficult to involve
enterprises in research steps. The gap we mentioned
early is in both sides, from researchers to the software
industry, and the other way round. This observation
model is not exclusive for Colombia, it could be ap-
plied globally by any VSEs of software development
to interpret its level of agreement with the ISO/IEC
29110 standard.
ACKNOWLEDGMENT
The authors want to acknowledge to Gobernaci
´
on
del Valle del Cauca, INFIVALLE, PACIFITIC, and
UNIVERSIDAD DEL VALLE for the master thesis
scholarship granted to Alexander Redondo Acu
˜
na in
the frame of Agreement CI-115-2016. Also, thanks
to VSEs for their helping in model validation (Or-
lando Rinc
´
on (CEO PARQUESOFT), GreenHorizon,
RADY). The authors are grateful to CIER-SUR and
the GEDI research group for sharing their prelimi-
nary research on the education innovation observatory
project.
REFERENCES
(2016). Iso/iec tr 29110-1, systems and software engineer-
ing — lifecycle profiles for very small entities (vses)
— part 1: Overview [technical report].
(2017). ISO/IEC/IEEE 24765: 2017(E): ISO/IEC/IEEE In-
ternational Standard - Systems and software engineer-
ing–Vocabulary. IEEE.
Abuchar Porras, A., C
´
ardenas Quintero, B., and L
´
opez,
D. A. (2012). Observatorio de pr
´
acticas de desarrollo
de software en minpyme y pymes de bogot
´
a. Ciencia
e Ingenier
´
ıa, pages 114–130.
Bol
´
ıvar, C. (2002). Instrumentos de investigaci
´
on educativa.
procedimiento para su dise
˜
no y evaluaci
´
on. CIDEC.
Capanegra, H (2002), El Gobierno electr
´
onico ha-
cia una verdadera reforma del estado.[Documento
en l
´
ınea] Disponible en: http://www. clad. org.
ve/fulltext/0043101. pdf [con acceso el 20-09-2004].
Brath, R. and Peters, M. (2004). Dashboard design: Why
design is important. DM Direct, 85:1011285–1.
Campo Amaya, L. F. (2008). Modelos de capacidad y
madurez y la industria del software en colombia. Gen-
eraci
´
on Digital, 7:22–25.
Garc
´
ıa-Mireles, G. A. (2016). Addressing product quality
characteristics using the iso/iec 29110. In Trends and
Applications in Software Engineering, pages 25–34.
Springer.
ISO/IEC (2011). Systems and software engineering — Life-
cycle profiles for Very Small Entities (VSEs) — Part
5-1-2: Management and engineering guide: Generic
profile group: Basic profile. Joint Technical Com-
mittee ISO/IEC JTC 1, Information technology, Sub-
committee SC 7, Software and systems engineering.,
Switzerland.
ISO/IEC (2015). Systems and software engineering — Life-
cycle profiles for Very Small Entities (VSEs) — Part
3-1: Assessment guide. ISO/IEC JTC 1/SC 7 Soft-
ware and systems engineering, Las Vegas, US.
Ivanov, V., Rogers, A., Succi, G., Yi, J., and Zorin, V.
(2017). What do software engineers care about? gaps
between research and practice.
Kan, S. H. (2002). Metrics and models in software qual-
ity engineering. Addison-Wesley Longman Publish-
ing Co., Inc.
Kerzner, H. (2013). Project Management Metrics, KPIs,
and Dashboards: A Guide to Measuring and Moni-
toring Project Performance.
Krouska, A., Troussas, C., and Virvou, M. (2019). A liter-
ature review of social networking-based learning sys-
tems using a novel iso-based framework. Intelligent
Decision Technologies, 13(1):23–39.
Laporte, C. Y. and O’Connor, R. V. (2016). Implementing
process improvement in very small enterprises with
iso/iec 29110: A multiple case study analysis. In 2016
10th International Conference on the Quality of Infor-
mation and Communications Technology (QUATIC),
pages 125–130.
Merch
´
an, L. and Urrea, A. (2007). Caracterizaci
´
on de
las empresas pertenecientes a la industria emergente
de software del sur occidente colombiano caso red
de parques parquesoft. Avances en sistemas e in-
form
´
atica, 4:10.
MinTic (2015). Marco de referencia de arquitectura empre-
sarial para la gesti
´
on de tecnolog
´
ıas de la informaci
´
on
(ti), a adoptar en las instituciones del sector p
´
ublico
colombiano.
Munoz, M., Mejia, J., and Ibarra, S. (2018). Tools and prac-
tices to software quality assurance: A systematic liter-
ature review.
Munoz, M., Mejia, J., and Lagunas, A. (2018). Implemen-
tation of the iso/iec 29110 standard in agile environ-
ments: A systematic literature review. In 2018 13th
Iberian Conference on Information Systems and Tech-
nologies (CISTI), pages 1–6.
O’Connor, R. V. and Laporte, C. Y. (2017). The evolution
of the iso/iec 29110 set of standards and guides. In-
ternational Journal of Information Technologies and
Systems Approach (IJITSA), 10(1):1–21.
Singh, R. (1996). International standard iso/iec 12207 soft-
ware life cycle processes. Software Process: Improve-
ment and Practice, 2(1):35–50.
Toro Lazo, A. (2013). Caracterizaci
´
on del proceso de de-
sarrollo de software en colombia: una mirada desde
las pymes productoras. Revista P
´
aginas de la UCP,
92:92–98.
Software Quality Observation Model based on the ISO/IEC 29110 for Very Small Software Development Entities
453
