
Spatial Entity Resolution between Restaurant Locations and
Transportation Destinations in Southeast Asia
Emily Gao and Dominic Widdows
Grab Inc, Singapura
Keywords:
Southeast Asia, Points of Interest, Restaurants, Entity Resolution.
Abstract:
As a tech company, Grab has expanded from transportation to food delivery, aiming to serve Southeast Asia
with hyperlocalized applications. Information about places as transportation destinations can help to improve
our knowledge about places as restaurants, so long as the spatial entity resolution problem between these
datasets can be solved. In this project, we attempted to recognize identical place entities from databases
of Points-of-Interest (POI) and GrabFood restaurants, using their spatial and textual attributes, i.e., latitude,
longitude, place name, and street address. Distance metrics were calculated for these attributes and fed to tree-
based classifiers. POI-restaurant matching was conducted separately for Singapore, Philippines, Indonesia,
and Malaysia. Experimental estimates demonstrate that a matching POI can be found for over 35% of restau-
rants in these countries. As part of these estimates, test datasets were manually created, and RandomForest,
AdaBoost, Gradient Boosting, and XGBoost perform well, with most accuracy, precision, and recall scores
close to or higher than 90% for matched vs. unmatched classification. To the authors’ knowledge, there are no
previous published scientific papers devoted to matching of spatial entities for the Southeast Asia region.
1 INTRODUCTION
Location matters in many businesses and services to-
day, particularly for transportation and delivery, sce-
narios in which it is important to find the correct pick-
up and drop-off locations very quickly. User expe-
rience can be negatively affected if the location in-
formation is inaccurate or insufficient. Inaccuracies
can originate from imprecise GPS data, manual error
happening in the process of data entry, or the lack of
effective data quality control. Insufficiencies can also
take many forms, including lack of coverage, and lack
of detail — for example, we may know the latitude
and longitude of a restaurant location in a mall, but
this might not include information about where pas-
sengers should be dropped off, or where a delivery
courier should park to collect food for delivery. Or
the location of a business may be known, but not its
contact details or opening hours.
One core problem in managing and improving
spatial datasets is recognizing when two records refer
to the same real-world entity. Solving this problem
can improve precision by removing duplicates, and
can enrich detail by (for example) merging a phone
number from one record with the hours of operation
from another, once these records are known to refer
to the same thing. This problem is referred to as en-
tity resolution (see (Talburt, 2011)), and it occurs with
various datasets, including those representing people,
products, works of literature, etc.
For Grab, one entity resolution problem that arises
for spatial data is the alignment of transportation des-
tinations and restaurants. Currently Grab maintains
two tables separately for transportation and food de-
livery, because each use case requires some specific
features, i.e., food delivery needs information about
the estimated delivery time, cuisine types, and open-
ing hours which are absent in the POI table. However,
it is highly likely that some entities from both tables
refer to the same place, and how to figure that out is
related to the study of entity resolution.
Matching restaurant and POI is beneficial for
some use cases in Grab. The first one is about auto-
matic geolocation correction update that could hap-
pen in both transportation and food delivery. As
shown in Figure 1 below, as Driver1 takes the passen-
ger to the KFC, i.e., the restaurant destination, he/she
may find it very difficult to drop off the passenger be-
cause of the incorrect POI suggested by POI table.
Driver1 can return this feedback to Grab transporta-
tion team, then that POI gets corrected and updated.
Sometime later, Driver2 needs to pick up a food or-
der from the same KFC, and he/she might experience
the same difficulty to quickly locate the restaurant be-
cause of the inaccurate POI returned from restaurant
table. This unhappy user experience could be avoided
92
Gao, E. and Widdows, D.
Spatial Entity Resolution between Restaurant Locations and Transportation Destinations in Southeast Asia.
DOI: 10.5220/0009416600920103
In Proceedings of the 6th International Conference on Geographical Information Systems Theory, Applications and Management (GISTAM 2020), pages 92-103
ISBN: 978-989-758-425-1
Copyright
c
2020 by SCITEPRESS – Science and Technology Publications, Lda. All rights reserved

if the same restaurant and POI entities are matched up
so that any update or change for an entity from one ta-
ble can be automatically transferred to another.
Another use case that can benefit from matching
restaurant and POI is the deduplicated search of same
place entity inside both tables. A user searching for
a specific restaurant will trigger the search action in
both the restaurant and the POI tables. If this restau-
rant has a matched POI, and this matching relation
has been identified, one of the two searches could be
avoided, allowing a faster return of the search results
and avoiding duplication of results for users.
Motivated by the above use cases, we attempted to
conduct entity matching between restaurant and POI
tables. The whole process includes several subtasks
such as data exploration, preprocessing, distance met-
rics calculation, labelling, as well as supervised learn-
ing. These will be elaborated in the following sec-
tions.
2 PRIOR WORK IN RECORD
LINKAGE FOR SPATIAL DATA
The problem of determining whether two records re-
fer to the same or different entities is called Record
Linkage or Entity Resolution, and sometimes Entity
Conflation. As a literary problem it goes back for
several centuries, with questions such as the identity
of the poet Homer (“Were the Iliad and the Odyssey
written by the same person?”). The formal study of
entity resolution goes back to the 1940s, leading to a
canonical statistical formulation for aligning medical
records being attributed to (Newcombe et al., 1959)
(see also (Talburt, 2011) for an in-depth summary).
2.1 Entity Resolution in Metric Spaces
A typical entity resolution approach is to model each
entity using a collection of features, to train a similar-
ity or distance function based on these features, and
then to merge entities whose similarity is above some
threshold, perhaps transitively using a clustering al-
gorithm. That is, given a distance function between
records, a simple application of this to entity resolu-
tion comes from assuming that two records represent
the same entity if the distance between them is be-
neath some threshold. (Conversely, for a similarity
function, if the similarity between the two, is above
some threshold.)
This process is sometimes more reliable if the dis-
tance function satisfies the metric properties. Mathe-
matically speaking, a metric on a space M is a func-
tion d : M × M → R
≥0
which satisfies the proper-
ties of symmetry (d(x, y) = d(y, x)), identity (d(x, y) =
0 ⇐⇒ x = y), and the triangle inequality (d(x, z) ≤
d(x, y) + d(y, z) for all x, y, z ∈ M. Metric spaces can
be particularly useful for record linkage problems be-
cause the notion of proximity can lend itself to sen-
sible clustering properties. For an accessible intro-
duction to metric spaces for informatics practitioners,
including some well-known caveats, see (Widdows,
2004, Ch 4). For example, standard similarity func-
tions such as cosine similarity are not metrics because
cos(x, x) = 1, and conceptual ‘distances’ often do not
obey the symmetric rule. In high-dimensional spaces
with many features, the triangle inequality also be-
comes a very weak condition that can allow distantly-
related points to become transitively linked (Ch
´
avez
et al., 2001).
The general notion of a distance function that
combines several features was used throughout the
experiments reported in this paper. However, since
the problem addressed in this paper is bipartite match-
ing between two separate datasets, a distance measure
that supports clustering within datasets was not a re-
quirement, and so no attempt was made to ensure that
metric properties were satisfied.
Note that not all spatial record linkage problems
can be posed in this similarity-based form, especially
for moving objects. The challenge of recognizing the
trajectories of individual moving objects from differ-
ent observations arises in computational astronomy
(Kubica et al., 2007), and is an increasing focus for
human-generated datasets (Basık et al., 2017).
2.2 Blocking Features and Identifiers
When inferring pairwise matches from a distance or
similarity function, comparing every record to ev-
ery other record can be intractable and unnecessary.
Sometimes there might be ‘blocking’ features, which
are necessary for matching, in the sense that two
records are prevented from matching if these features
do not have identical values (for example, the year-
of-birth of a person, if this is available in the dataset
and known to be recorded accurately). Some block-
ing attributes may even be considered to be sufficient
for matching, especially if an attribute is meant to be
a unique identifier — for example, two products with
the same barcode might be expected to be identical (as
in (Bilenko et al., 2005)). Blocking can also be used
as an early-out in computation to reduce a quadratic
problem (comparing every pair of items) to a linear
problem (grouping together all items with identical
or at least similar values of the blocking attribute).
In practice, however, it is rarely the case that any at-
tribute can be trusted entirely with this responsibility.
Spatial Entity Resolution between Restaurant Locations and Transportation Destinations in Southeast Asia
93
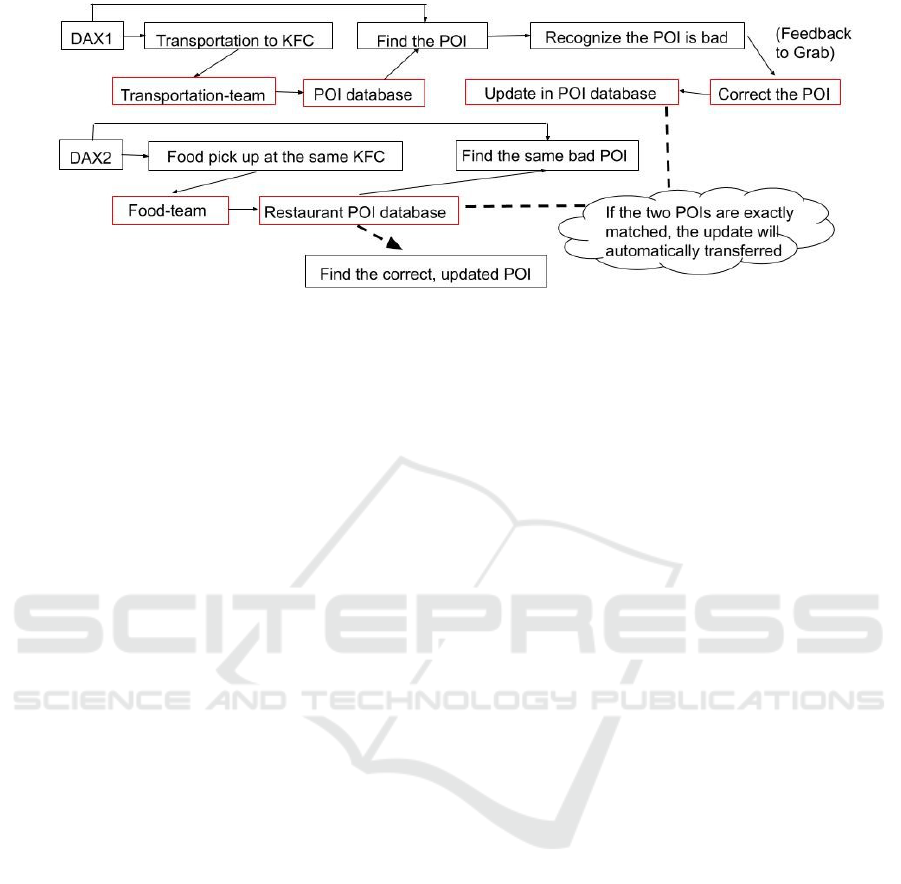
Figure 1: Use Case Illustration for Automatic Geolocation Update.
2.3 Special Considerations for Spatial
Datasets
With spatial datasets, blocking can be particularly
tricky, because there is not a standard system of is-
suing unique identifiers. Buildings do not have ISBN
numbers or Driver’s License Numbers! Many have
street addresses, which can sometimes be considered
as a taxonomic path to finding the building (see (Wid-
dows, 2004, Ch 3)), but these are not unique identi-
fiers and usually have many spelling variants (“9 High
Street”, “9 High St”, etc.). An obvious class of pro-
posals for blocking functions for spatial datasets are
sharing geographic areas — the same city, state or re-
gion, or at least the same country. However, there are
two problems with relying on these as blocking func-
tions:
• The names in these fields might not match. Sur-
prisingly, this happens with some regularity, for
example, a store near the boundary between
Bellevue and Redmond may be listed in either.
This problem is particularly apparent in some of
our datasets for Southeast Asia.
• The input datasets might not be parsed into these
fields. There are approaches for performing such
parsing automatically (see e.g., (Borkar et al.,
2001)). We are working on this challenge as well,
though the results are not yet ready to be used as
input for restaurant POI matching.
Entity resolution for spatial datasets therefore typi-
cally involves largely statistical and continuous mea-
sures of similarity. The work described here is typical
in this respect, and in terms of methodology is quite
similar to that of (Sehgal et al., 2006). One class of
similarity is spatial proximity: provided that each en-
tity record has latitude and longitude coordinates, the
great circle distance between these points can easily
be calculated and used as a feature. Another class of
similarity is textual similarity: whether a string of text
represents a business name, a street number, a street
name, or a city name, we still expect a high similarity
between two different textual descriptions of the same
entity.
Another common difficulty to note is that decid-
ing whether two records refer to the same entity —
and even deciding if two entities are identical at all —
is less straightforward than one might assume. Some
of the problems in geo-ontology engineering, and es-
pecially problems that arise when trying to combine
this with statistical methods, are discussed in (Janow-
icz, 2012). A restaurant and the building it occupies
are conceptually two different things, as demonstrated
by cases where the building takes on a different ten-
ant, or the restaurant moves to different premises. Of
course, we say “We are going to the restaurant”, rather
than “We are going to the building that houses the
restaurant”, but when we try to build formal compu-
tational models that start with such everyday conve-
niences, difficulties soon arise, a case-in-point being
the challenge of building a formal model for reason-
ing from crowdsourced OpenStreetMap tags (Code-
scu et al., 2011).
These theoretical and practical difficulties are im-
portant to keep in mind, not because we should de-
spair of ever solving this matching problem, but be-
cause they place sensible limits on what sort of re-
sults we should expect. This motivates the right ques-
tion from a human-centered technology point of view
— we are not asking “Can we build a perfect match-
ing system”, but rather “Can we build a matching sys-
tem whose results will improve the experience of our
users?”
GISTAM 2020 - 6th International Conference on Geographical Information Systems Theory, Applications and Management
94

3 DATA SOURCES USED
The two main tables this work focuses on are points-
of-interest (POI) and restaurants.
3.1 Points of Interest
Grab uses POIs as the drop-off / pick-up location rec-
ommendations to drivers for both the transportation
and food delivery purposes. The POIs are licensed
externally from Google, Foursquare, Nokia, Azure,
OpenStreetMap, and Aapico, and also internally by
operation teams. Right now most POIs come from
external sources, and Grab’s own data collection ac-
tivities are growing. Specific to the database of POI,
each POI entity is identified by its unique id, and has
dozens of attributes describing its geolocation, clas-
sification, and lifecycle milestones. The POI dataset
contains approximately 150M records at the time of
writing.
Efforts to deduplicate these records are ongoing, a
problem that effectively subsumes the work on restau-
rant matching (because the restaurant dataset could be
considered as just another data source).
3.2 Restaurants
The restaurant table contains the most updated infor-
mation about those restaurants that have registered to
GrabFood. Restaurant information provided by mer-
chant owners are merged with the spatial informa-
tion from Map Operation team, and then entered to
database and cloud data warehouse through a series
of internal platforms. Like POI, each restaurant entity
has its unique id, the geolocation information, and the
lifecycle milestones, but with some extra attributes
such as status information and owner information, etc.
The restaurant dataset contains approximately 200K
records at the time of writing.
The two tables exist to support different opera-
tions, i.e., the POIs are used for transportation and
the restaurants are used for food delivery.
3.3 Name Variation
Many of the records within these datasets vary consid-
erably in representation. To give examples at the city
and regional level, Table 1 shows some spelling dif-
ferences that regularly appear with some of the larger
cities in Indonesia.
4 MATCHING APPROACH
At a high level, our approach to matching is sim-
ple: annotate suitable (POI, restaurant) pairs as either
matching or non-matching, and use this to train and
evaluate classifiers that rely on basic textual and spa-
tial features. It is important to note that the classifiers
trained in this fashion classify pairs of (POI, restau-
rant) to say whether they match or not: it is not just
a classifier that tells if a restaurant can be matched
to any POI, but a classifier that tells us if a particular
match is a good one.
This turns the matching problem into a classi-
fication problem over the Cartesian product of two
sets. In practice, however, the number of potential
(POI, restaurant) pairs is prohibitively large, and the
chance that any randomly selected pair is a match is
correspondingly small, so we sample down to make
these numbers tractable and sensible by reducing the
matching candidates. The steps are outlined as fol-
lows.
4.1 Early-out Blocking on Geohash
Given approximately 150M POIs and 200K restau-
rants, there are approximately 30 trillion potential
(POI, restaurant) pairs — far too many to consider all
of them! To reduce the number of potential matches,
we start with a blocking strategy based on geohash.
A geohash is a rectangle in the latitude / longitude
coordinate space, where rectangles at different levels
have predictable alphanumeric identifiers (Liu et al.,
2014). For these experiments, we found that taking
geohashes at level 6 was a suitable tradeoff between
computational performance and thoroughness. A 6-
level geohash at the equator encloses an area of ap-
proximately 1.2 km × 0.6 km.
The restaurant and POI are paired up by joining on
the same geohash that is of level 6. A holistic compar-
ison between each restaurant to all the other POIs is
unnecessary because two locations that are thousands
of miles away could never be the identical entities.
We adopted geohash to join a restaurant only to POIs
that have the same geohash, thus reducing the com-
parison space dramatically.
4.2 Features Used
The spatial and non-spatial attributes used to iden-
tify the same place entities include latitude and longi-
tude, place name, and street name, which are common
fields in the POI and restaurant tables. Some distance
metrics were derived from the above attributes. The
distance metrics are great circle distance calculated
Spatial Entity Resolution between Restaurant Locations and Transportation Destinations in Southeast Asia
95

Table 1: Examples of Name Variations Found in Indonesia.
First Name Variant Second Name Variant Notes
Jakarta Djakarta The spelling ‘Djakarta’ is usually considered obsolete but
still appears
Solo Surakarta Alternative names for the same city
Lampung Bandar Lampung ‘bandar’ means ‘city’ in Malay, these are like ‘New York’
and ‘New York City’
Aceh Banda Aceh ‘banda’ and ‘bandar’ are used similarly
Lubuklinggau Lubuk Linggau The space is optional
Palangkaraya Palangka Raya The space is optional
from latitude and longitude, Levenshtein and Jaro dis-
tances for place name, and Levenshtein distance for
street name. These metrics are the input features for
machine learning model, and a restaurant-POI pair
with lower distance values is more likely to be identi-
cal place entity. Levenshtein distance is calculated by
counting the number of operations needed to convert
one string into another and the edit operations include
adding, deleting, and replacing. The Jaro similarity is
another string similarity measure that has been used
successfully for name-matching (see (Cohen et al.,
2003)). It is defined as follows:
Jaro(θ
1
, θ
2
) =
1
3
c
|θ
1
|
+
c
|θ
2
|
+
c −
t
2
c
(1)
where θ
i
are the strings, c is the number of characters
that match within a given distance, and t is the num-
ber of transpositions needed to put the overlapping
characters back in the same order. Jaro distance is
derived from Jaro similarity by subtracting Jaro sim-
ilarity from the value of 1. Both Levenshtein and
Jaro distances are character level based, but Jaro dis-
tance focuses more on local similarities between two
strings. For example, Levenshtein distance between
‘ab’ and ‘ba’, which is normalized by the sum of their
lengths, is 0.5, and Jaro distance between ‘ab’ and
‘ba’ is 1 because within half of the string length we
cannot find any identical character pairs from the two
strings.
Some preparations are conducted for name and
street address strings to convert characters to lower
case, remove blank spaces and special characters,
etc. Notably, the Levenshtein distance between two
strings is normalized by the sum of lengths of two
strings. This is because Levenshtein distance as a
metric is more generous to shorter strings. For in-
stance, Levenshtein distance between ‘a’ and ‘b’ is
1, which is seemingly smaller than the Levenshtein
distance (i.e., 3) between ‘abczzzzzzzzzzzzzz’ and
‘fghzzzzzzzzzzzzzz’. However, we tend to recognize
that the later pair is more similar compared to the sim-
ilarity for ‘a’ and ‘b’.
Great circle distance and Levenshtein distance for
street name are more associated with spatial close-
ness of a restaurant and a POI. Nevertheless, being
spatially close does not necessarily mean two place
entities are identical. This is particularly the case
where stores usually get crowded in densely popu-
lated metropolis such as Singapore. Therefore, sim-
ilarity between names for two places is an important
feature to be incorporated into our evaluation system.
We consider both Levenshtein and Jaro distances for
place name to increase the weight of non-spatial at-
tribute in determining place entity similarity.
Figure 2 displays distributions of features for the
different countries (i.e., Indonesia, Malaysia, Singa-
pore, and Philippines). The samples plotted in the
figure is a subset randomly selected from the final
population of POI-restaurant pairs. The final pop-
ulation was obtained after applying early-out block-
ing on geohash and a few other predefined rules that
help to reduce the unmatched POI-restaurant popula-
tion size (which will be elaborated in the section 4.4).
Due to the predefined downsampling rules there is
remarkable clustering of geolocation distance within
200 meters and the clear cutoff of Levenshtein dis-
tance for name at 0.4 (i.e., the threshold we used to
filter out POI-restaurant pair samples that possess low
probability to be identical place entities). Interest-
ingly, while the distribution of Levenshtein distance
for name tends to be skewed to the high-value end,
Jaro distance for name mimics more a bell shaped dis-
tribution, which indicates that for this specific study
when the same group of string pairs are evaluated us-
ing Jaro distance instead of Levenshtein distance, a
greater portion of POI name and restaurant name are
considered to be more similar. This is the true case for
two strings like ‘ab’ and ‘abcd’, for which the Lev-
enshtein distance is 1/3 whereas the Jaro distance is
1/6. We observed significant number of POI name and
restaurant name pairs falling into this format category,
i.e., in the case where a POI refers to the same place as
a restaurant the POI name is an exact substring of the
restaurant name because a restaurant name is usually
appended with a street address that is not included in
GISTAM 2020 - 6th International Conference on Geographical Information Systems Theory, Applications and Management
96

the POI name.
4.3 Countries Considered
The countries where Grab offers both transportation
and food delivery services that were considered for
this study are Indonesia, Malaysia, Singapore, Philip-
pines, Vietnam and Thailand. The model training and
results reported here are restricted to the first four of
these. Vietnam and Thailand were not investigated in
this pilot study due to the difficulty of the character
sets. See section 6 for further discussion of this point.
4.4 Annotation / Labeling with
Downsampling
This project aims to match restaurant and POI through
a supervised learning process. Since labels are not
available for the restaurant-POI pairs joined on the
same geohash, i.e, we do not know in prior whether
a restaurant and a POI is matched or not, manual an-
notation is a necessary step before training/testing the
models. We decide the relationship between a restau-
rant and a POI mainly based on latitude&longitude
(i.e., distance), name, street.
The relationship between a POI and a restaurant
can be classified into two categories (see Table 2).
Two place entities should refer to the same one if they
have similar name and similar street address or spa-
tially close locations. On the other hand, if it is obvi-
ous that the restaurant and the POI cannot be the same
place given the different names, even though they are
spatially close, they are marked as not matching.
Even after applying geohash to block out the
unmatched restaurant-POI pairs, the percentage of
matched restaurant-POI pairs out of the total pairs is
still expected to be very low. Take Singapore for ex-
ample, the total population of restaurant-POI pairs for
comparison is about 220 millions and total number of
unique restaurant entity is about 8K. Suppose every
restaurant can find a matched POI, then the match-
ing percentage is still as low as 0.0037%. Therefore,
the whole restaurant-POI pairs population turns out
rather imbalanced with the much lower rate of occur-
rence of matched samples. This poses the difficulty in
the manual annotation, as one has to label more than
10000 pairs of restaurant-POI to hopefully get about
37 matched samples. Manually labeling 10000 pairs
of samples requires too much human labor, which is
both time consuming and error prone.
We proposed two predefined rules to exclude or
downsample a great portion of restaurant-POI pairs
that are expected to be unmatched. This is based on
two underlying assumptions. The first one is that a
POI that is closer to a restaurant is more likely to
be matched with the restaurant than another POI that
is further away. Therefore, we only consider the top
K nearest POIs as the potential matching candidates.
Secondly, a restaurant-POI pair with name Leven-
shtein distance greater than 0.4 tend to be unmatched.
A special case is ‘abc’ and ‘def’, which has the nor-
malized Levenshtein distance of 0.5. As one of the
strings gets longer, that ratio will be higher than 0.5,
moving further from being matched. We chose 0.4
as the threshold to apply stricter penalty to name edit
distance. After prescreening the restaurant-POI pairs
based on the above predefined rules, the whole pop-
ulation for comparison is reduced significantly, i.e.,
about 32K. This is beneficial to identifying consider-
able number of matched restaurant-POI pairs without
having to label a huge amount of pairs.
The manual labeling follows three steps. We first
randomly select 500 samples from the population for
comparison, compare through each pair of restaurant
and POI, and assign a label to the pair which could
be matched and unmatched that is coded as 1 and 0
respectively. The 500 pre-labeled samples are applied
to train and test a Decision Tree, which is used to sub-
sequently predict for another randomly selected 2000
samples. Among the 2000 samples, the restaurant-
POI pairs predicted as matched are manually rectified
if any of the predicted labels are wrong. In this way,
for each country we could collected over 1000 pre-
labeled samples that could be used for training and
testing.
4.5 Model Training
Each dataset was divided between training and test-
ing with the ratio of 4:1, that is, 20% of the datasets
were held aside for evaluation. All models were
trained using Scikit Learn in Python (Pedregosa et al.,
2011). The implementation uses PySpark for dis-
tributed computing where appropriate.
4.6 Computational Resources
Preprocessing to get the final population of restaurant-
POI pairs appeared to be the most computationally
time consuming and memory demanding process.
This includes but not limited to joining restaurants
and POIs based on geohash, calculating distance met-
rics, applying predefined rule-out conditions to de-
crease unmatched pair population, saving parquet and
CSV files to AWS S3. These operations were con-
ducted on a Spark cluster of 20 machines. Although
suitable partition strategies were utilized, depending
on the population sizes of restaurant and POI for the
Spatial Entity Resolution between Restaurant Locations and Transportation Destinations in Southeast Asia
97
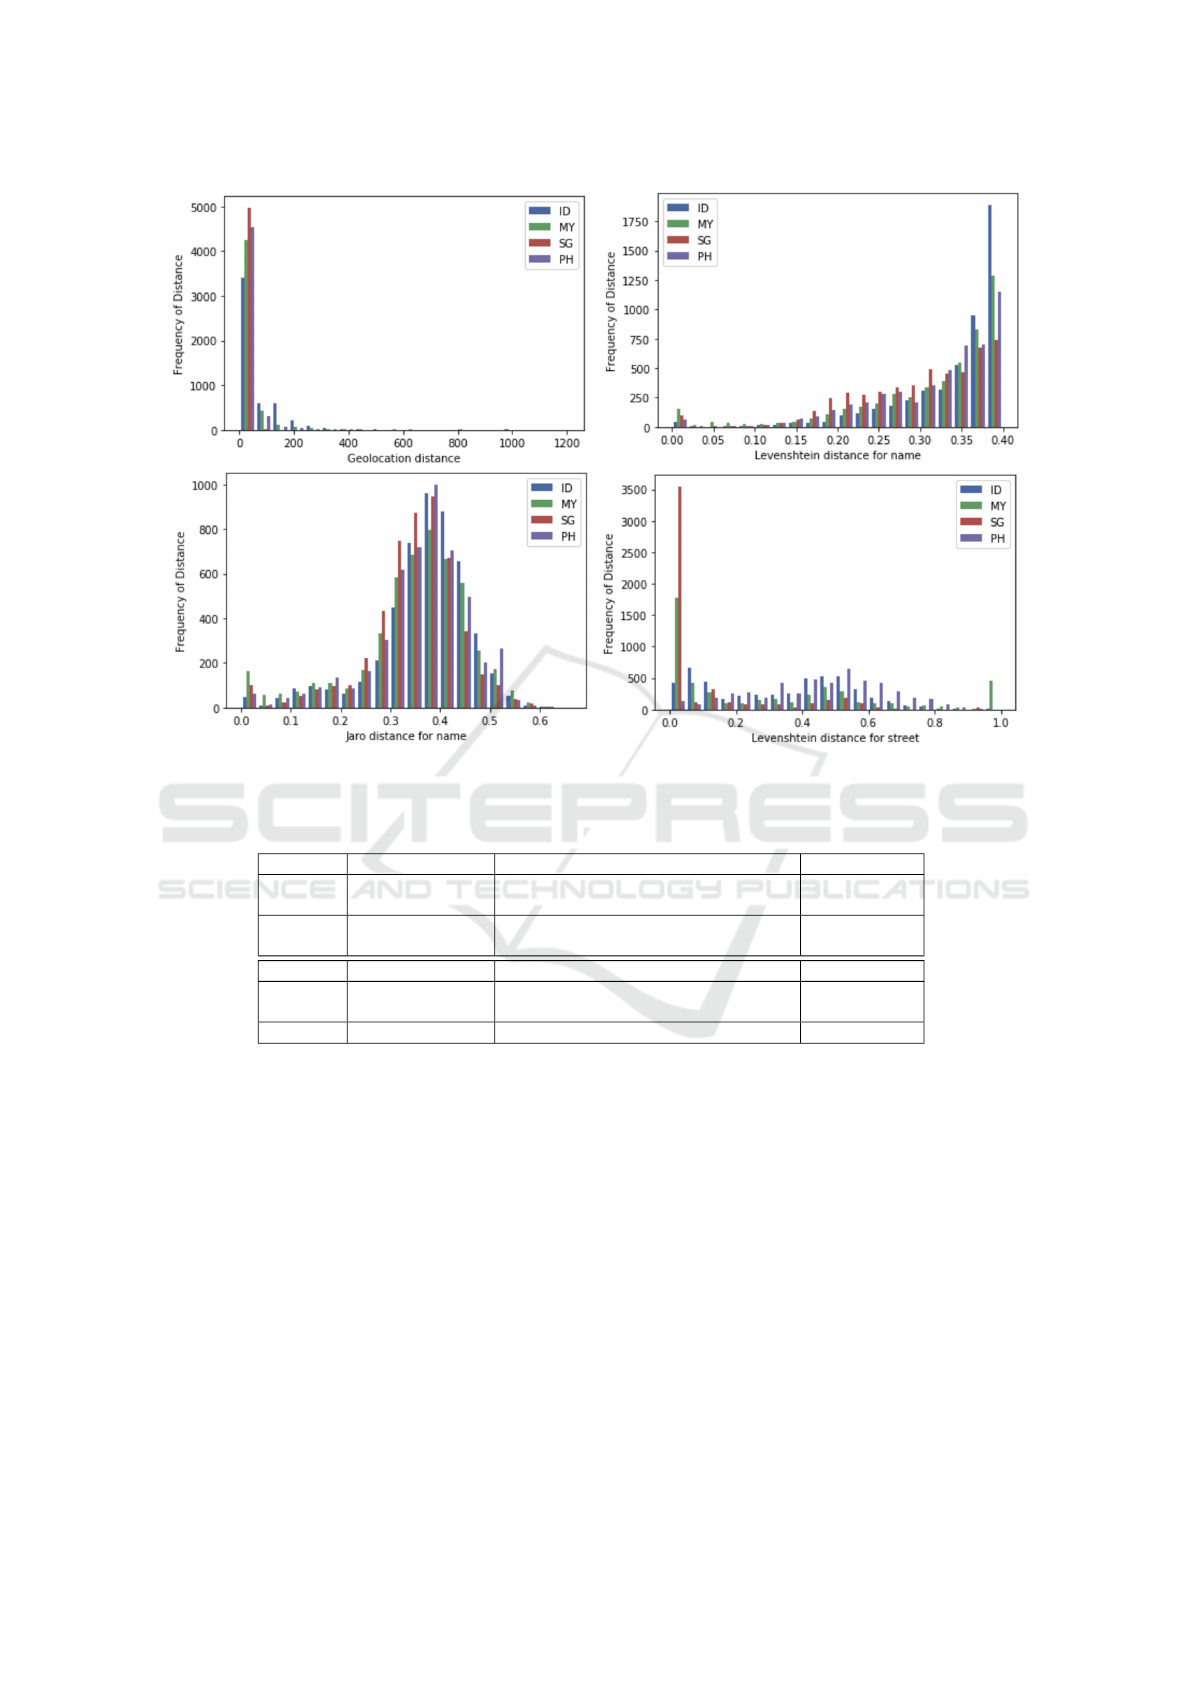
Figure 2: Histograms for Features of Geolocation Distance (in Meters), Levenshtein Distance, and Jaro Distance (ID: Indone-
sia; MY: Malaysia; SG: Singapore; PH: Philippines).
Table 2: Restaurant-POI Relationship Types.
Matched Name Street Distance (meters)
Restaurant
fore coffee
- bintarof
jl. boulevard bintaro jaya ruko kebayoran arcade 2
blok b3 no 51 pd. jaya pd. aren tangerang selatan
0.0
POI
fore coffee
- 20fit bintaro
jl. boulevard bintaro jaya ruko kebayoran
arcade 2 blok b3 no 51 pondok aren
Unmatched Name Street Distance (meters)
Restaurant
mie setan ’noodle and
dimsum’ - tlogomas
jl. raya tlogomas no. 31 tlogomas
lowokwaru malang
15.92
POI
KFC- tlogomas jalan raya tlogo mas
different countries, running time on Spark could last
for a few hours, with the longest to be 4 hours for In-
donesia. 10 GB and 40 GB memory was allocated to
master and executors respectively to evade the out-of-
memory failure. Since the final comparison domain
was considerably reduced, training and testing the
tree-based models and making predictions ran very
quickly and lasted for several minutes.
5 RESULTS AND DISCUSSION
This section reports the results for each country for
which supervised classifiers were trained and tested
(as shown in Table 3). Here Class 1 refers to the un-
matched and Class 2 to the matched pairs. As can
be seen, results of test accuracy are uniformly quite
high regardless of countries. The lowest accuracy is
still over 93%, a great improvement from a random
guess based on the proportion of major category (i.e.,
non-matching class taking up 70-80% of the popula-
tion). A comparison of precision and recall across the
different countries shows that Malaysia has the weak-
est non-matching results, and the weakest matching
results are found in the Philippines. The tree-based
classifiers perform the best for matching restaurants
and POIs in Indonesia in terms of precision and recall
scores for the matched class. This is demonstrated
in Figure 3 that lists some randomly selected sam-
ples of restaurant-POI pairs predicted as matched in
Indonesia. After examining on Google map, it is ob-
GISTAM 2020 - 6th International Conference on Geographical Information Systems Theory, Applications and Management
98

served that all the pairs are correctly predicted even
though there are many variations in names and street
addresses between restaurants and POIs. Some of
the cases are hazy to be identified as matched when
checking with human eyes. For example, the first
pair has the quite different street address expressions
and the geolocation distance is also relatively further
than the other pairs. However, the model could still
make a correct prediction through the experience it
learned from the training set. Some POIs have void
street addresses, but the model is able to recognize the
matched pairs based on the close geolocation distance
combined with similar name strings.
Using Random Forest to predict the matching of
all restaurant-POI candidate pairs, we estimated the
number of matchable restaurants in each country con-
sidered. These were approximately 37% (Indonesia),
53% (Malaysia), 51% (Philippines) and 23% (Sin-
gapore). On average 38% of restaurants in the four
countries can be found to match with at least one POI,
implying a great potential to enhance user experience
for drivers and passengers if those restaurants happen
to be the popular ones. The reason for the low match-
ing rate in Singapore is still under investigation. It is
important to note that the precision and recall scores
measure the recall of the automatic classifier com-
pared with the manual matching efforts during the an-
notation process. So for example, achieving high 90’s
recall for Malaysia means that of the whole popula-
tion of matched restaurant-POI pairs, over 90% were
also captured by the classifier. It does not mean that
over 90% of restaurants have been matched to a cor-
responding POI.
Notably, the role played by each input feature
weights differently when Random Forest was used to
classify the relationship between merchants and POIs,
as shown in 4. For each country, the same order of the
importance of features can be observed, i.e. Jaro dis-
tance of name appears the most important, followed
by Levenshtein distance of name, then great circle ge-
olocation distance, and minimal role played by Lev-
enshtein distance of street name. It is an interesting
finding that Jaro distance of name outweighs Leven-
shtein distance of name in determining if a merchant-
POI pair is matched or not. Compared to Leven-
shtein distance, Jaro distance focuses more on local
similarity of two strings and is more likely to assign
lower distance score to two strings with identical sub-
strings. As a result of the fact that many restaurant en-
tries have their name concatenated with a street name
(as discussed in the section 4.2, Jaro distance turns
out to be a better measurement of the similarity be-
tween restaurant and POI names). As for geolocation
distance, its much smaller importance score seems
surprising. However, remember that some previous
early-out blocking actions were already executed on
the geolocation distance, so the real role of geoloca-
tion distance should turn out to be much more promi-
nent than what the figure shows.
A map representing GrabFood restaurants in Sin-
gapore is displayed in Figure 5. The red dots stand
for restaurants that do not have matched POIs, and
the green dots represent restaurants that have matched
POIs. Spatial distribution of the two categories
of restaurants shows that there is no special clus-
ters of certain type of restaurant, and the restau-
rants with/without matched POIs are mixed with each
other.
Finally, we ran an experiment to see if results im-
proved or deteriorated when datasets from each coun-
try were not kept separate. We expected that the ex-
tra data for training could be beneficial, but that us-
ing training data from another country could lead to
poorer results from inappropriate extrapolation. What
we found is that on the whole results became less
reliable (Table 3), with the exception being that re-
call rate of matching results in Malaysia improved a
little. One hypothesis is that the similarity between
Malaysian and Indonesian addresses and street names
may contribute to the usefulness of Indonesian data
for Malaysia. The impaired matching result after
merging all countries together could be attributed to
the different distributions of features across the dif-
ferent countries (see Figure 2). For instance, Leven-
shtein distance between names for Singapore is dis-
tributed relatively more homogeneously, whereas for
other countries there is concentration of high value
Levenshtein distance of name. Distributions of Jaro
distance for name do not exactly coincide with each
other for the different countries, so do for the distribu-
tions of Levenshtein distance for street name. Hence,
there is regional variations across the different coun-
tries we are working on in terms of spatial distribution
patterns of restaurant vs. POI, the name and street ad-
dress format conventions, etc. This leads to the con-
sequence that the Levenshtein distance for name with
the value of 0.1 could indicate the matched POI and
restaurant in Indonesia, but being unmatched in Sin-
gapore.
6 CHALLENGES WITH THAI
Matching restaurants and POIs in Thailand is more
challenging than in the countries evaluated above, be-
cause of the non-Roman character set. Other ma-
jor languages in countries where Grab operates that
use non-Roman character sets include Burmese and
Spatial Entity Resolution between Restaurant Locations and Transportation Destinations in Southeast Asia
99

Table 3: Tree-based Model Performance for Different Countries.
Classifiers
Test
accuracy
F1 score
(class1)
F1 score
(class2)
Precision
(class1)
Precision
(class2)
Recall
(class1)
Recall
(class2)
Malaysia
RandomForest 93.1% 95.2% 87.6% 96.0% 85.7% 94.4% 89.6%
AdaBoost 95.5% 96.9% 91.8% 97.2% 91.2% 96.6% 92.5%
GradientBoost 94.7% 96.4% 90.2% 96.1% 90.9% 96.6% 89.6%
XGBoost 94.7% 96.3% 90.5% 97.1% 88.6% 95.5% 92.5%
Indonesia
RandomForest 97.0% 98.1% 92.6% 97.6% 94.3% 98.6% 90.9%
AdaBoost 96.6% 97.8% 91.9% 98.1% 91.1% 97.6% 92.7%
GradientBoost 98.1% 98.8% 95.5% 99.0% 94.6% 98.6% 96.4%
XGBoost 97.7% 98.6% 94.5% 98.6% 94.5% 98.6% 94.5%
Philippines
RandomForest 97.0% 98.2% 90.1% 99.6% 83.7% 96.9% 97.6%
AdaBoost 96.3% 97.8% 88.2% 99.6% 80.4% 96.1% 97.6%
GradientBoost 96.7% 98.0% 89.1% 99.6% 82.0% 96.5% 97.6%
XGBoost 97.0% 98.2% 90.1% 99.6% 83.7% 96.9% 97.6%
Singapore
RandomForest 97.6% 98.6% 90.6% 98.3% 92.3% 98.9% 88.9%
AdaBoost 96.2% 97.8% 85.7% 98.3% 82.8% 97.2% 88.9%
GradientBoost 97.1% 98.3% 89.3% 98.9% 86.2% 97.8% 92.6%
XGBoost 97.6% 98.6% 90.9% 98.9% 89.3% 98.3% 92.6%
Merge all four countries
RandomForest 95.9% 97.5% 87.2% 98.4% 83.1% 96.6% 91.7%
AdaBoost 95.4% 97.2% 86.0% 98.6% 80.4% 95.9% 92.3%
GradientBoost 95.5% 97.3% 86.3% 98.7% 80.6% 95.9% 92.9%
XGBoost 95.6% 97.3% 86.6% 98.7% 81.0% 96.0% 92.9%
Khmer, while Vietnamese script is based on Ro-
man characters with many diacritical accent and tone
marks. Each of these scripts is challenging for unfa-
miliar readers and computers to process. This section
considers issues with Thai which are somewhat repre-
sentative of the kinds of problems encountered across
different languages and especially different scripts.
6.1 Transliteration vs. Translation
Non-Roman character sets are more challenging not
just because it makes the characters harder for unfa-
miliar users, but because it influences the structure of
names, which often contain repetitions of local and
Roman character versions. For example, the name
‘Starbucks’ may appear in a title repeated in Roman /
English and Thai characters, as in ‘Starbucks (สตาร์-
บัคส์)’, which makes string overlap techniques behave
differently. This also illustrates the point that translat-
ing business names and addresses as if they were reg-
ular paragraph texts often works badly — for exam-
ple, a good translation of ‘Starbucks (สตาร์บัคส์)’ into
English would not be ‘Starbucks (Starbucks)’. Proper
names often should not be translated at all. For ex-
ample, the (short) Thai name for Bangkok is ‘กรุง-
เทพ’ (Krung Thep), which means ‘city of angels’, but
showing this translation to English speakers would
possibly lead to confusion between Bangkok and Los
Angeles! In practice, restaurants with the Thai name
‘กรุงเทพ’ (which are relatively common worldwide)
are for more likely to be rendered as ‘Krung Thep’
for English speakers, which is a phonetic translitera-
tion rather than a semantic translation.
A more familiar example for Europeans is perhaps
the famous Avenue des Champs-
´
Elys
´
ees in Paris. To
render this as ‘Elysian Fields Avenue’ on an English-
language streetmap would be much more likely to
confuse than to inform, partly because it’s less famil-
iar, and partly because it doesn’t correspond to the
physical street signs.
Understanding which phrases should be translated
semantically, which should be transliterated between
character sets, and which should be left alone appears
to be an open area for research. It is at least fair to
note that current machine translation systems are not
designed to recognize and respond appropriately to
GISTAM 2020 - 6th International Conference on Geographical Information Systems Theory, Applications and Management
100
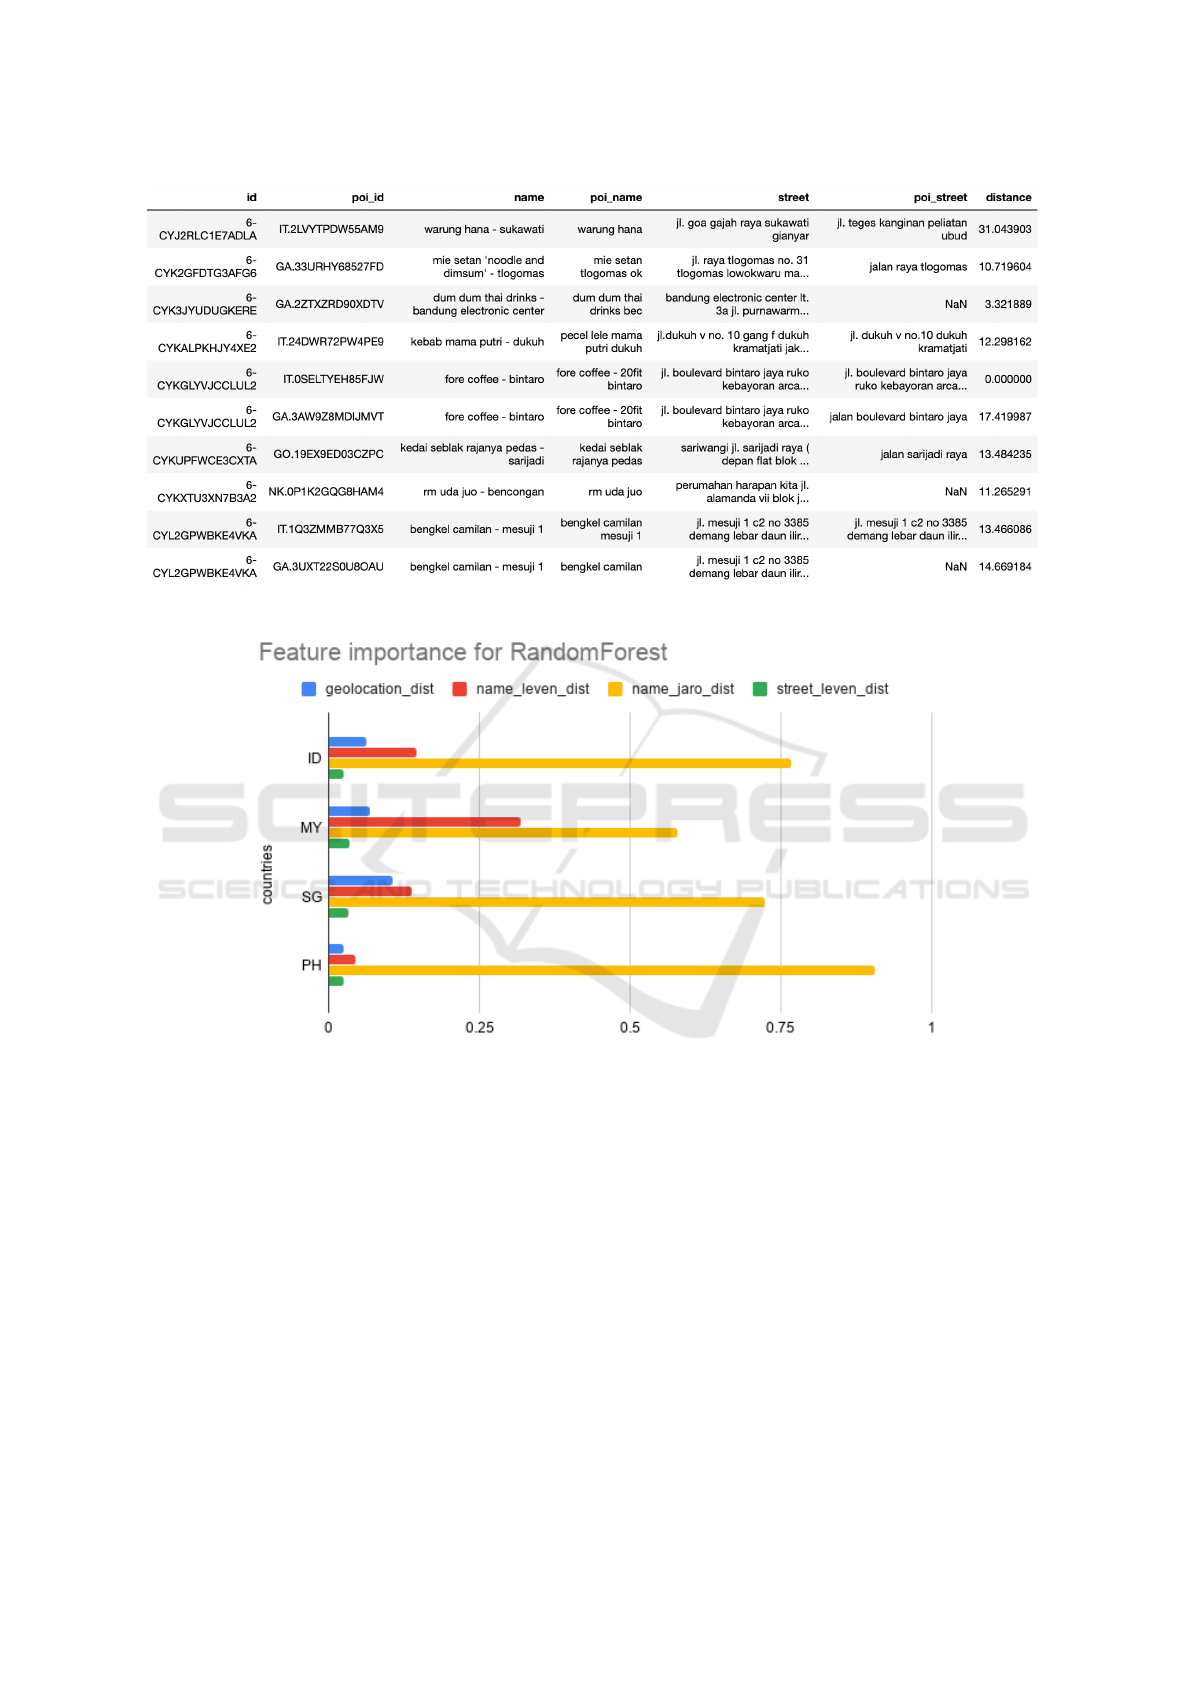
Figure 3: Example of Restaurant-POI Pairs Predicted as Matched for Indonesia.
Figure 4: Feature Importance Scores in Classification Using Random Forest.
these differences, and should not be trusted for these
purposes without manual review. For reasons such as
this, adapting our methods to Vietnamese and Thai
(and eventually Burmese and Khmer) is left for future
work.
6.2 Non-symmetric Overlap Measures
The relationship between the name ‘Starbucks’ and
‘Starbucks (สตาร์บัคส์)’ is clearly an asymmetric con-
tainment relationship. Symmetric measures such as
Levenshtein and Jaro do not naturally capture this
(though as remarked above, Jaro gives more credit for
matching substrings). In other work at Grab for ma-
chine translation and intent recognition for search, it
is also apparent that the relationship between a source
and a target (for example, a food query and a menu
item) is often asymmetric. Symmetric distance mea-
sures sometimes can be enhanced by taking this into
account — for example, smartphone users in informal
situations often leave out diacritical marks in Viet-
namese and vowels in Indonesian. A thorough anal-
ysis of such phenomena is beyond the scope of this
paper.
7 CONCLUSIONS
This paper has demonstrated that relatively good
matching results between restaurants and points of
Spatial Entity Resolution between Restaurant Locations and Transportation Destinations in Southeast Asia
101
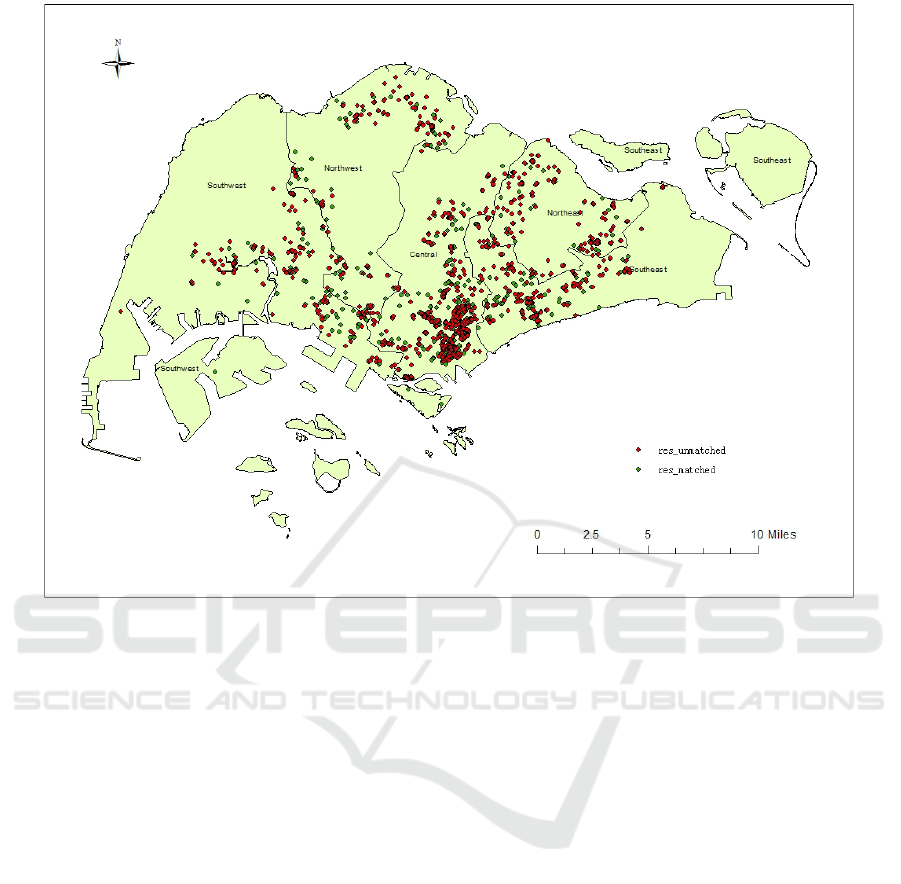
Figure 5: Spatial Distribution of Sampled Restaurants With/without Matched POIs in Singapore.
interest in Southeast Asia can be obtained by train-
ing tree-based classifiers iteratively on a few hundred
pairs. This is an encouraging start. These results
approximate human performance at finding matching
pairs given available search tools. An open question
this leaves is how close this gets to exhausting the
matching possibilities — when no match for a restau-
rant is found in the POI dataset, does this indicate
that matching need to be improved, or that the POI
data itself is lacking? If the latter is the cause of no-
match restaurants, a next step may be just to add the
unmatched restaurants as POIs.
Many local questions can be asked about the ef-
ficiency of raw string matching, because many ad-
dress names vary systematically. For example, the
word ‘Jalan’ in Malay languages (including Indone-
sian and Malaysian) means ‘Street’ and can be abbre-
viated as ‘Jl’ and ‘Jln’ without any change in mean-
ing. Such variants should be considered identical for
matching. This is also an example of a general ques-
tion for knowledge discovery and natural language
processing in Southeast Asia — when is it helpful to
treat Indonesian and Malaysian separately, and when
is it useful to treat them as part of the same language
group?
Finally, we have clearly worked only with the
Southeast Asian countries and languages that use the
Roman alphabet (without extensive diacritic modifi-
cations, as in Vietnamese). Adapting this work to
other countries with different alphabets and various
transliteration methods will be important for extend-
ing coverage throughout the region.
ACKNOWLEDGEMENTS
The authors would like to thank colleagues from Grab
for guidance and help throughout this work, including
Xiaonan Lu, Kristin Tolle, Jagan Varadarajan, Wenjie
Xu, Sien Yi Tan, Sidi Chang, and Jacob Lucas.
REFERENCES
Basık, F., Gedik, B., Etemo
˘
glu, C¸ ., and Ferhatosmano
˘
glu,
H. (2017). Spatio-temporal linkage over location-
enhanced services. IEEE Transactions on Mobile
Computing, 17(2):447–460.
Bilenko, M., Basil, S., and Sahami, M. (2005). Adap-
tive product normalization: Using online learning
for record linkage in comparison shopping. In
GISTAM 2020 - 6th International Conference on Geographical Information Systems Theory, Applications and Management
102

Fifth IEEE International Conference on Data Mining
(ICDM’05). IEEE.
Borkar, V., Deshmukh, K., and Sarawagi, S. (2001). Auto-
matic segmentation of text into structured records. In
ACM SIGMOD Record (Vol. 30, No. 2, pp. 175-186).
ACM.
Ch
´
avez, E., Navarro, G., Baeza-Yates, R., and Marroqu
´
ın,
J. L. (2001). Searching in metric spaces. ACM com-
puting surveys (CSUR), 33(3):273–321.
Codescu, M., Horsinka, G., Kutz, O., Mossakowski, T., and
Rau, R. (2011). Osmonto — an ontology of Open-
StreetMap tags. State of the map Europe (SOTM-EU).
Cohen, W. W., Ravikumar, P., and Fienberg, S. E. (2003).
A comparison of string distance metrics for name-
matching tasks. In 2003 International Conference on
Information Integration on the Web (pp. 73-78). II-
Web.
Janowicz, K. (2012). Observation-driven geo-ontology en-
gineering. Transactions in GIS, 16(3):351–374.
Kubica, J., Denneau, L., Grav, T., Heasley, J., Jedicke, R.,
Masiero, J., Milani, A., Moore, A., Tholen, D., and
Wainscoat, R. J. (2007). Efficient intra-and inter-night
linking of asteroid detections using kd-trees. Icarus,
189(1):151–168.
Liu, J., Li, H., Gao, Y., Yu, H., and Jiang, D. (2014). A
geohash-based index for spatial data management in
distributed memory. In 22nd International Conference
on Geoinformatics (pp. 1-4). IEEE.
Newcombe, H. B., Kennedy, J. M., Axford, S. J., and James,
A. P. (1959). Automatic linkage of vital records. Sci-
ence, 130(3381):954–959.
Pedregosa, F., Varoquaux, G., Gramfort, A., Michel, V.,
Thirion, B., Grisel, O., Blondel, M., Prettenhofer, P.,
Weiss, R., Dubourg, V., and Vanderplas, J. (2011).
Scikit-learn: Machine learning in python. Journal of
machine learning research, 12:2825–2830.
Sehgal, V., Getoor, L., and Viechnicki, P. D. (2006). En-
tity resolution in geospatial data integration. In 14th
annual ACM international symposium on Advances in
geographic information systems (pp. 83-90). ACM.
Talburt, J. R. (2011). Entity resolution and information
quality. Morgan Kaufmann, San Francisco.
Widdows, D. (2004). Geometry and meaning (Vol. 773).
Stanford: CSLI publications.
Spatial Entity Resolution between Restaurant Locations and Transportation Destinations in Southeast Asia
103
