
Towards a Taxonomy for Big Data Technological Ecosystem
Vitor Afonso Pinto
1 a
and Fernando Silva Parreiras
2 b
1
Technology Department, Operational Technology for Mine, Plant and Expedition, Vale Mozambique, Tete, Mozambique
2
Laboratory for Advanced Information Systems, FUMEC University, Rua do Cobre, Belo Horizonte, Brazil
Keywords:
Big Data, Taxonomy, Mapping Study, Cross-case Analysis.
Abstract:
Data is constantly created, and at an ever-increasing rate. Intending to be more and more data-driven, com-
panies are struggling to adopt Big Data technologies. Nevertheless, choosing an appropriate technology to
deal with specific business requirements becomes a complex task, specially because it involves different kinds
of specialists. Additionally, the term Big Data is vague and ill defined. This lack of concepts and standards
creates a fuzzy environment where companies do not know what exactly they need to do and on the other hand
consultants do not know how to help them to achieve their goals. In this study the following research question
was addressed: Which essential components characterize Big Data ecosystem? To answer this question, Big
Data terms and concepts were first identified. Next, all terms and concepts were related and grouped creating
a hierarchical taxonomy. Thus, this artifact was validated through a classification of tools available in the mar-
ket. This work contributes to clarification of terminologies related to Big Data, facilitating its dissemination
and usage across research fields. The results of this study can contribute to reduce time and costs for Big Data
adoption in different industries as it helps to establish a common ground for the parts involved.
1 INTRODUCTION
Emerging technologies have made all devices, equip-
ment, and systems to be smart, communicable, and in-
tegrated. Because of that, data is constantly created,
and at an ever-increasing rate. Mobile phones, so-
cial media, imaging technologies and other examples
create new data which must be stored somewhere for
future usage(Dietrich et al., 2015). The total amount
of data in the world increased from 2.8 zettabytes in
2012 to 8 zettabytes by 2015 (Duckett, 2016) and is
expected to reach 44 zettabytes by 2020. Organiza-
tions are now carrying out studies that were impossi-
ble to conduct in the past due to data availability (Liu
et al., 2016).
If on the one hand there is data available, on the
other hand a solid definition of Big Data is still re-
quired. The term Big Data is vague and ill defined.
It is not a precise term and does not carry a particular
meaning other than the notion of its size (Demchenko
et al., 2014). Big Data has been variously defined in
the literature however these definitions lack ontolog-
ical clarity. This lack of concepts along with an in-
creasing list of new technologies creates a fuzzy en-
a
https://orcid.org/0000-0002-2731-0952
b
https://orcid.org/0000-0002-9832-1501
vironment for organizations that want to process data
in their best interest.
Data-driven technologies continue to evolve at a
rapid pace, with an ever vibrant ecosystem of star-
tups, products and projects. The ”2019 Data & AI
Landscape”, compiled by Matt Turck, includes 1335
Big Data companies (Turck, 2018). From the organi-
zational point of view, decision makers need to nav-
igate the myriad choices in compute and storage in-
frastructures as well as data analytics techniques, and
security and privacy frameworks. Thus, choosing ap-
propriate technologies to deal with specific business
requirements may become a complex task. This study
aims to explain existing roles for technologies inside
a Big Data technological ecosystem.
This research intends to answer the following re-
search question: ”Which essential components char-
acterize Big Data ecosystem?”. By addressing this
research question, this study make three contribu-
tions: first, main components related to Big Data are
identified in the literature. Second, a taxonomy for
classifying Big Data tools is formalized. Finally, the
taxonomy is evaluated and used to classify real-world
Big Data tools. By using the proposed taxonomy, or-
ganizations should be able to understand the role of
each Big Data tool and how they fit in a Big Data
technological ecosystem. This study is structured as
294
Pinto, V. and Parreiras, F.
Towards a Taxonomy for Big Data Technological Ecosystem.
DOI: 10.5220/0009416302940305
In Proceedings of the 22nd International Conference on Enterprise Information Systems (ICEIS 2020) - Volume 2, pages 294-305
ISBN: 978-989-758-423-7
Copyright
c
2020 by SCITEPRESS – Science and Technology Publications, Lda. All rights reserved

follows: Section 2 presents methods used in this re-
search. In section 3, research results are presented.
These results are discussed in section 4. This study is
concluded and future work is suggested in section 5.
2 METHODS
This study follows the Design Science Research
(DSR) approach. Design science research is a re-
search paradigm in which a designer answers ques-
tions relevant to human problems via the creation of
innovative artifacts, thereby contributing new knowl-
edge to the body of scientific evidence (Hevner and
Chatterjee, 2010). In this scenario, this research in-
tends to formalize an artifact capable to answer the
following research question: ”Which essential com-
ponents characterize Big Data ecosystem?”. In or-
der to answer this research question, this study is di-
vided in three steps. Firstly, Big Data constructs are
raised through a systematic mapping study. Then,
these constructs are ordered through a taxonomy cre-
ation process. Finally, the taxonomy artifact is vali-
dated through a cross-case study using existing tools
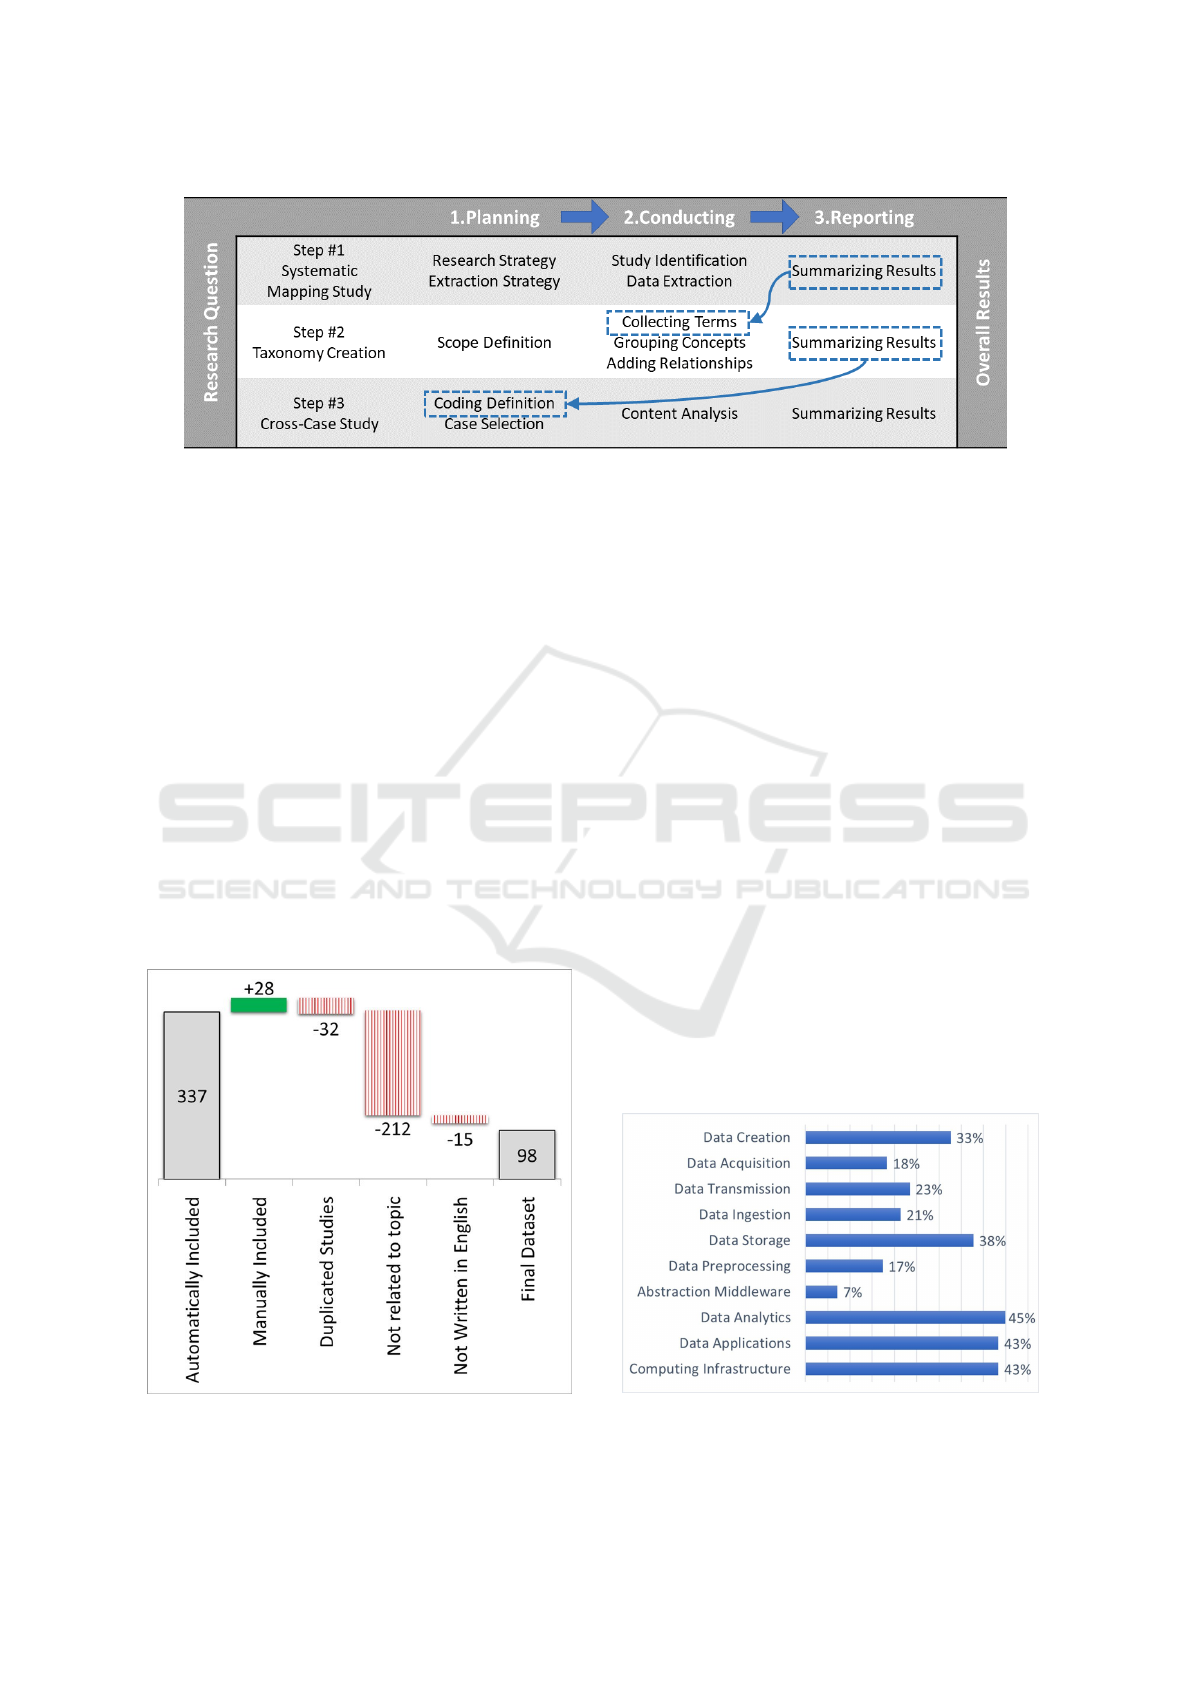
available in the market. Figure 1 presents the meth-
ods applied on each research step and highlights how
overall results are related to outcomes of each step.
2.1 Systematic Mapping Study
The outcome of a mapping study is an inventory of
papers on the topic area, mapped to a classification.
Hence, a mapping study provides an overview of the
scope of the area, and allows to discover research gaps
and trends. The main research question defined to
be addressed by this research step was: ”What prior
knowledge is available about Big Data taxonomy”.
As research strategy, string ”Big Data Taxonomy”
was used to search on Mendeley catalog and refer-
ences were manually added. Studies returned by au-
tomatic search were included, except those not writ-
ten in English, not related to research topic or dupli-
cated. For data extraction, we developed an extrac-
tion form using software START, intending to iden-
tify main constructs related to Big Data (Fabbri et al.,
2016). Figure 2 illustrates transformation of raw re-
sults in the final list of primary studies.
2.2 Taxonomy Creation
In this research step, we analyzed the dataset created
in section 2.1 to collect terms, group similar concepts
and add relationships. The main research question de-
fined to be addressed by this research step was: ”How
can we represent a Big Data taxonomy?”. In this
step, guidelines proposed by (Redmond, 2013) were
applied to build a Big Data taxonomy. Thus, scope
was defined and then terms and concepts were col-
lected. Next, concepts were grouped and related to
each other.
2.3 Cross-case Analysis
In this step of the research, procedures followed a
qualitative approach trough an exploratory descriptive
cross-case study research. The main research ques-
tion of this step was defined as: ”Is the proposed
taxonomy sufficient for describing components of ex-
isting tools?”. For data collection, websites of Big
Data products were analysed and scrutinised accord-
ing to categories proposed in section 2.2. We assessed
fifty websites of randomly selected tools from land-
scape compiled by Matt Turck (Turck, 2018). Table
1 presents a list of tools selected for taxonomy val-
idation. Considering the volume of collected data,
content analysis techniques were used to facilitate the
understanding and this process was supported by We-
bQDA software (WebQDA, 2019).
3 RESULTS
This section presents answers for each research ques-
tion raised on each step of this study. Firstly Big
Data constructs raised through the systematic map-
ping study conducted in section 2.1 are detailed.
Then, the taxonomy artifact built in section 2.2 is
showed. Finally, results of cross-case study con-
ducted in section 2.3 are presented.
3.1 What Prior Knowledge is Available
about Big Data Taxonomy?
The Systematic Mapping Study, presented in section
2.1 unveiled ten major roles technologies may per-
form inside a Big Data technological ecosystem: data
creation, data acquisition, data tranmission, data
ingestion, data storage, data preprocessing, ab-
straction middleware, data analytics, data applica-
tions and computing infrastructure. Figure 3 shows
how these components were covered by selected stud-
ies. Next subsections present qualitative details of
each role considered by this study along with its cate-
gories.
Towards a Taxonomy for Big Data Technological Ecosystem
295
Source: Authors
Figure 1: Applied methods on this study.
3.1.1 Technologies for Data Creation
In order to discuss Big Data, it is relevant to under-
stand how data is created. Technologies that perform
this role are responsible for creating data. Consider-
ing just the internet, data is constantly being generated
by posts in forums, blog messages, searching queries,
among others. Online social networks are immensely
prevalent and have now become a ubiquitous and im-
portant part of the modern, developed society (How-
den et al., 2014). With the rapid proliferation of vari-
ous social network services, it has become very com-
mon for people to express their thoughts or opinions
on various issues using brief comments (Lee, 2016).
At the same time, with the trend going on in ubiqui-
tous computing, everything is going to be connected
to the Internet and its data will be used for various
progressive purposes. Most real-world data are not in
Source: Authors
Figure 2: Selection of Primary Studies.
a form that can be directly recorded by a computer.
These quantities typically include temperature, pres-
sure, distance, velocity, mass, and energy output (such
as optical, acoustic, and electrical energy) (Austerlitz,
2003). A physical quantity must first be converted to
an electrical quantity (voltage, current, or resistance)
using a sensor or transducer. Thus, transducers and
sensors are used to convert a physical phenomenon
into an electrical signal (voltage or current) that will
be then converted into a digital signal used for the next
stage such as a computer, digital system, or memory
board (Emilio, 2013). In parallel, value also relies
on corporate data, that is, all data maintained by any
of the companies including, but not limited to, data
related to its finances, taxes, employees, customers,
suppliers and the business. Corporate data may reveal
answers to most problems organizations face. Ad-
ditionally, data generated by automated interactions
between systems can also generate value as lots of
events are registered in log files and each event can
be related to a specific situation or to meta-data, for
instance. Big Data typically consists of data from a
variety of related and unrelated sources that can be
quite complex. Table 2 presents a summary for each
category of Data Creation, found on literature.
Source: Authors
Figure 3: Coverage of Big Data Constructs by Publications.
ICEIS 2020 - 22nd International Conference on Enterprise Information Systems
296

Table 1: Selected Tools for Taxonomy Validation.
ID Assessed Tool Reference
1 1010Data (1010Data, 2019)
2 23andMe (23andMe, 2019)
3 3Scan (3Scan, 2019)
4 6Sense (6Sense, 2019)
5 Actifio (Actifio, 2019)
6 ActionIQ (ActionIQ, 2019)
7 Active.AI (Active.Ai, 2019)
8 Acxiom (Acxiom, 2019)
9 Aerospike (Aerospike, 2019)
10 Affirm (Affirm, 2019)
11 AICure (AiCure, 2019)
12 Airobotics (Airobotics, 2019)
13 Airtable (Airtable, 2019)
14 Apache Drill (Apache, 2019a)
15 Apache Flink (Apache, 2019d)
16 Apache Hive (Apache, 2019b)
17 Apache Mesos (Apache, 2019c)
18 Augury (Augury, 2019)
19 Berkeley (Oracle, 2019)
20 Birst (Birst, 2019)
21 Cignifi (Cignifi, 2019)
22 Cloudera (Cloudera, 2019)
23 CyberX (CyberX, 2019)
24 Darktrace (Darktrace, 2019)
25 Elastic (Elastic, 2019)
ID Assessed Tool Reference
26 Estimote (Estimote, 2019)
27 Garmin (Garmin, 2019)
28 Cloud Dataflow (Google, 2019)
29 Helium (Helium, 2019)
30 Human API (HumanAPI, 2019)
31 Illumio (Illumio, 2019)
32 MariaDB (MariaDB.org, 2019)
33 MEMSql (MemSQL, 2019)
34 Microstrategy (MicroStrategy, 2019)
35 MongoDB (MongoDB, 2019)
36 Neo4j (Neo4J, 2019)
37 Objectivity (Objectivity, 2019)
38 OpenTSDb (OpenTSDB, 2019)
39 PTC (PTC, 2019)
40 Recorded (RecordedFuture, 2019)
41 Riak (Riak, 2019)
42 Samsara (Samsara, 2019)
43 SecurityScorecard (SecurityScorecard, 2019)
44 SentinelOne (SentinelOne, 2019)
45 Sentry (Sentry, 2019)
46 Sift (Sift, 2019)
47 Signifyd (Signifyd, 2019)
48 SlamData (SlamData, 2019)
49 SparkCognition (SparkCognition, 2019)
50 Uptake (Uptake, 2019)
3.1.2 Technologies for Data Acquisition
Technologies that perform this role acquire Big Data
from multiple sources. Data may have different struc-
tures, depending on how they are created, for in-
stance. Structured data is both highly-organized and
easy to digest. Traditional structured data, such as the
transaction data in financial systems and other busi-
ness applications, conforms to a rigid format to en-
sure consistency in processing and analyzing it. Un-
structured data cannot simply be recorded in a data
table, thus typically it is not a good fit for a main-
stream relational database and requires more special-
ized skills and tools to work with. Semi-structured
data is a data type that contains semantic tags, but
does not conform to the structure associated with typi-
cal relational databases (Sawant and Shah, 2013). Big
Data is the amount of structured, semi-structured and
unstructured data coming from multiple sources such
as online access, mobile devices, social media, scien-
tific devices, and other inputs in addition to existing,
traditional data sources (Bari et al., 2014). Acquiring
data from separate data sources consists in accessing
several applications. Some applications may be cus-
tom developed in-house while others are bought from
third-party vendors. The applications probably run
on multiple computers, which may represent multi-
ple platforms, and may be geographically dispersed.
Some of the applications may be run outside of the
enterprise by business partners or customers. Some
applications may need to be integrated even though
they were not designed for integration and cannot be
changed. These issues and others like them are what
make data acquisition difficult. Table 3 presents a
brief description for each category of Data Acquisi-
tion.
3.1.3 Technologies for Data Transmission
The movement of data between origin and destina-
tion is possible because of technologies that perform
this role. Information from new sources needs to be
transmitted from their origin to a place where it can
be processed or consumed. Bandwidth should be a
critical element of Big Data strategies, because it is
not possible to support the heavy traffic demands of
streamed or file-based Big Data payloads without the
pipelines needed to carry them. Bandwidth means
the maximum amount of data transmitted through a
communication channel at one time. Data transmis-
Towards a Taxonomy for Big Data Technological Ecosystem
297

Table 2: Categories of Data Creation Component.
Category Description
Social
Interactions
Data generated by individuals or
group of individuals. It also in-
cludes social network interactions,
scientific researches, among others
Sensor
Readings
Data generated by sensors, also
known as “things”. Includes
data that come from industry,
agriculture, traffic, transportation,
medical care, public departments,
among others
Corporate
Data
Content generated by enterprises
operations. Includes production
data, inventory data, sales data, fi-
nancial data, etc
Systems
Interactions
Data automatically generated by
systems interactions. Includes
metadata, log files, online trading
data, etc
Data as
a Service
Data collected, assessed and sold
for usage as input for data-
consumers applications
Source: Authors
Table 3: Categories of Data Acquisition Component.
Category Description
Web
Search
Log analysis, page tagging, linked
data, among others
Messaging Transferring of data packets in a
frequently, immediately, reliably
and asynchronously way, using
customizing formats
Remote
Procedure
Invocation
Interfaces that allow interaction
between any application to running
applications
Database
Integration
Two or more applications share
common tables. One may write to
it while the other while the other
simply reads from these tables
File
Transfer
Two or more applications share a
common file system. One may
write to it while the other may poll
the file system to read it
Source: Authors
sion is the movement of data (bits) between at least
two digital devices. Wired transmission can be imple-
mented through twisted-pair wire (copper wire used
for telephone and data communication), coaxial ca-
ble (consists of copper wire surrounded by insula-
tion and braided wire), Fiber-optic cable (consists of
thin strands of glass or plastic that carry data through
pulses of light), among others. Wireless transmission
Table 4: Categories of Data Transmission Component.
Category Description
Wired Depends on physical cabling to en-
able data transmission. May include:
Ethernet, Serial, USB, FireWire,
among others
Wireless Does not depend on physical cabling
to enable data transmission. May
include: Bluetooth, WiFi 802.11,
GSM, ZigBee, RFID, LoRa, NB-IoT,
Satellite, among others.
Source: Authors
can be implemented through infrared (Wireless trans-
mission medium that carries data through the air us-
ing light beams), radio and Bluetooth (enables music,
photos, and voice to travel through the air as radio
frequency or radio waves), microwaves (transmit data
via electromagnetic radio waves with short frequen-
cies), satellites (microwave relay stations in space that
transmit data through microwave signals), among oth-
ers. Table 4 presents a brief description for each cate-
gory of Data Transmission.
3.1.4 Technologies for Data Ingestion
Technologies that perform this role determine strate-
gies for handling acquired data. Different dynamics
of data may require different security approaches or
different computing platforms to provide meaningful
insights. The type of technology required to deal with
data at rest or data in motion may be different. Data
at rest is placed in storage rather than used in real
time and requires batch processing. Data in motion
(or streaming data) moves across a network or in-
memory for processing in real time. Streaming data
means high speed both in data arrival rate and in data
processing. There are examples of streaming data
ranging from data coming from equipment sensors to
medical devices to temperature sensors to stock mar-
ket financial data and video streams. This aspect also
determines latency strategies and data workflow. La-
tency is the time it takes for data packets to be stored
or retrieved. It needs to be adjusted to answer busi-
ness requirements. An adequate data latency allows
organizations to make business decisions in a timely
manner. Workflows are used to allocate and schedule
execution of Big Data applications in an optimized
manner (Rani and Babu, 2015). These engines pro-
vide an effective tool to define and manage large sets
of processing tasks (Palazzo et al., 2015). Workflow
management systems enable the creation and the ex-
ecution of adaptive analytics (Kantere and Filatov,
2015). Increased volume of streaming data as well
as the demand for more complex real-time analytics
ICEIS 2020 - 22nd International Conference on Enterprise Information Systems
298

Table 5: Categories of Data Ingestion Component.
Category Description
Data
in motion
Data in motion is collected and
processed in real-time as the data-
creating event happens
Data
at rest
Data at rest is collected in batches
as sets of records and processed as a
unit after the data-creating event has
occurred
Source: Authors
require for execution of processing pipelines among
heterogeneous event processing engines as a work-
flow (Ishizuka et al., 2016). Table 5 presents a brief
description for each category of Data Ingestion.
3.1.5 Technologies for Data Storage
Technologies that perform this role organize elements
of data. A storage model is the core of any big-
data related systems. It affects the scalability, data-
structures, programming and computational models
for the systems built on top of any Big Data-related
systems. Different data systems implement different
storage models. Each one has advantages and disad-
vantages. NoSQL data models: Key-Value, Column
families and Document-based models has looser con-
sistency constraints as a trade-off for high availability
and/or partition-tolerance in comparison with that of
relational data models. In addition, NoSQL data mod-
els have more dynamic and flexible schemas based
on their data models while relational databases use
predefined and row-based schemas. Lastly, NoSQL
databases apply the BASE models while relational
databases guarantee ACID transactions. There are
two major categories to represent stored data: rela-
tional and NoSQL, acronym for ”not only SQL”. Ta-
ble 6 presents a brief description for each category of
Data Storage.
3.1.6 Technologies for Data Preprocessing
Technologies that perform this role deal with quality
of data used to create models. Data preprocessing is
one of the most time-consuming steps in a typical data
mining project (Luis, 2017). Real-world databases
are highly susceptible to noisy, missing, and inconsis-
tent data due to their typically huge size (often several
gigabytes or more) and their likely origin from mul-
tiple, heterogeneous sources. Low-quality data will
lead to low-quality mining results (Han et al., 2012).
Much of the raw data contained in databases is un-
processed, incomplete, and noisy. For example, the
databases may contain: a) fields that are obsolete or
redundant; b) missing values; c) outliers; d) data in
Table 6: Categories of Data Storage Component.
Category Subcategory Description
Relational
Conventional Data is represented in
terms of tuples and
grouped into relations
with high focus on
relational operations and
transactions
In Memory Also known as
NewSQL. Data is
represented in terms
of tuples and grouped
into relations with
lower focus on rela-
tional operations and
transactions
No SQL
Key Value Key-Value pairs, in
which, keys are unique
IDs for each data and
also work as indexes
during accessing the
data
Document The unit of data is called
a document which can
contains an arbitrary set
of fields, values and even
nested objects and arrays
Column Data are considered as
tables with rows and col-
umn families in which
both rows and columns
can be split over multiple
nodes
Graph Uses graph structures
with nodes, edges, and
properties to represent
and store data
Source: Authors
a form not suitable for the data mining models; e)
values not consistent with policy or common sense
(Larose and Larose, 2015). Dimensionality reduction
is relevant to decrease the computational cost of mod-
els, increase the performance of models, reduce irrel-
evant and redundant dimensions (Garcia et al., 2015).
Table 7 presents a brief description for each category
of Data Preprocessing.
3.1.7 Technologies for Data Analytics
Technologies that perform this role enable the cre-
ation, improvement and deployment of models and
applications. A model is a representation of a state,
process, or system that we want to understand and
reason about. Models can be equations linking quan-
Towards a Taxonomy for Big Data Technological Ecosystem
299

Table 7: Categories of Data Preprocessing Component.
Category Description
Transformation Technologies for enriching data
in order to make analysis more
effective, focusing on cleaning
up the data or creating new vari-
ables that may bring useful in-
formation for the analysis steps
Reduction Technologies to reduce volume
of data by using: principal com-
ponent analysis, factor analy-
sis, multidimensional analysis,
sampling rows, variable selec-
tion, feature and instance selec-
tion, among others
Source: Authors
tities that we can observe or measure. They can also
be a set of rules (Forte, 2015). When approaching a
data mining problem, a data mining analyst may al-
ready have some a priori hypotheses that he or she
would like to test regarding the relationships between
the variables. However, analysts do not always have
a priori notions of the expected relationships among
the variables (Larose and Larose, 2015). If the client
is a human, it is common to use a variety of mod-
els, tuned in different ways, to examine different as-
pects of data. If the client is a machine though, it will
be probably needed to zero in on a single, canonical
model that will be used in production (Cady, 2017).
Model evaluation is the process of assessing a prop-
erty or properties of a model in terms of its structure
and data inputs so as to determine whether or not the
results can be used in decision making. It encom-
passes: (1) verification, validation, and quality con-
trol of the usability of the model and its readiness
for use, and (2) investigations into the assumptions
and limitations of the model, its appropriate uses, and
why it produces the results it does. (Gass and Harris,
2001). The model is assessed in three stages: business
evaluation, statistical validation and application on
the full population including the corresponding target
variables. (Ahlemeyer-Stubbe and Coleman, 2014).
Once there is confidence on the quality of data min-
ing procedures, they need to be communicated. This
frequently involves: 1) some sort of reporting to other
people within some organization and/or 2) trying to
deploy the outcome of data mining workflow. (Luis,
2017) Building a model is generally not the end of
the project. Even if the purpose of the model is to in-
crease knowledge of the data, the knowledge gained
will need to be organized and presented in a way that
the customer can use it. Depending on the require-
ments, the deployment phase can be as simple as gen-
erating a report or as complex as implementing a re-
Table 8: Categories of Data Analytics Component.
Category Description
Data
Modeling
Technologies for data modeling.
Core components of a model are:
a set of equations with parameters
that need to be tuned; some data
that are representative of a sys-
tem or process; a concept that de-
scribes the model’s goodness of
fit; a method to update the pa-
rameters to improve the model’s
goodness of fit
App
Development
Technologies for development,
validation and deployment of ap-
plications that encapsulate mod-
els. Validation include: holdout,
random subsampling, cross val-
idation, bootstrap estimates, lift
and gain charts, model stabil-
ity, sensitivity analysis, threshold
analytics and confusion matrix,
ROC curves, model complexity,
among others. Deployment pro-
vides the option to deploy the an-
alytical results in to every day de-
cision making process
Source: Authors
peatable data mining process. (Sayad, 2010). Table 8
presents a brief description for each category of Data
Analytics.
3.1.8 Technologies for Abstraction Middleware
Technologies that perform this role provide an ab-
straction layer interposed between the IT infrastruc-
ture and the applications. A Middleware platform
aims to hide the technological details to enable the
application developers to focus on the development
of the applications (Chaqfeh and Mohamed, 2012).
When billions of sensors are connected to the Inter-
net, it is not feasible for people to process all the data
collected by those sensors. Context-awareness com-
puting techniques, such as middleware, are proposed
to better understand sensor data and help decide what
data needs to be processed (Xu et al., 2014). Table 9
presents a brief description for each category of Ab-
straction Middleware.
3.1.9 Technologies for Data Applications
Technologies that perform this role extract worthy in-
sights from low-value data. According to (Gartner,
2015), Big Data applications can be grouped in four
dimensions: Descriptive, Diagnostic, Predictive and
ICEIS 2020 - 22nd International Conference on Enterprise Information Systems
300

Table 9: Categories of Abstraction Middleware Component.
Category Description
Interoperation Technologies that allow the us-
age and sharing of information
across diverse domains of appli-
cations using diverse communi-
cation interfaces
Context
Detection
Technologies for characterizing
the situation of an entity where
an entity can be person, place, or
object relevant to the interaction
between a user and an applica-
tion, including the user and ap-
plications themselves
Security Technologies to ensure confiden-
tiality, authenticity, and nonre-
pudiation across diverse domains
of applications
Portability Technologies to enable organi-
zations migrating their applica-
tions and services to different
platforms.
Device
Discovery
Technologies for enabling any
device in the IoT network to de-
tect all its neighbouring devices
and make its presence known to
each neighbour in the network.
Source: Authors
Prescriptive. Descriptive dimension means the ex-
amination of data or content, usually manually per-
formed, to answer the question “What happened?”
(or ”What is happening?”). Diagnostic dimension is
a form of advanced analytics which examines data
or content to answer the question “Why did it hap-
pen?”. Predictive dimension is a form of advanced
analytics which examines data or content to answer
the question “What is going to happen?” or more pre-
cisely, “What is likely to happen?”. Prescriptive di-
mension examines data or content to answer the ques-
tion “What should be done?” or “What can be done to
make a specific result happen?”. Table 10 presents a
brief description for each category of Applications.
3.1.10 Technologies for Computing Processing
Technologies that perform this role deal with data pro-
cessing and supports all technologies inside Big Data
technological ecosystem. Computing paradigms on
Big Data currently differ at the first level of abstrac-
tion on whether the processing will be done in batch
mode, or in real-time/near real-time on streaming data
(data that is constantly coming in and needs to be pro-
cessed right away). If an application demands “im-
mediate” response to each event as it occurs, some
Table 10: Categories of Applications Component.
Category Description
Descriptive Characterized by traditional busi-
ness intelligence (BI) and visual-
izations such as pie charts, bar
charts, line graphs, tables, or gen-
erated narratives
Diagnostic Characterized by techniques such
as drill-down, data discovery, data
mining and correlations
Predictive characterized by techniques such
as regression analysis, forecast-
ing, multivariate statistics, pat-
tern matching, predictive model-
ing, and forecasting
Prescriptive Characterized by techniques such
as graph analysis, simulation, com-
plex event processing, neural net-
works, recommendation engines,
heuristics, and machine learning
Source: Authors
form of stream processing is needed, which essen-
tially processes the data as it comes in (Murthy et al.,
2014). For this reason, emerging technologies are
largely engaged in processing Big Data using differ-
ent computational environments. The parallel and
cloud computing platforms are considered a better so-
lution for Big Data. The concept of parallel comput-
ing is based on dividing a large problem into smaller
ones and each of them is carried out by one single pro-
cessor individually. In addition, these processes are
performed concurrently in a distributed and parallel
manner (Tsai et al., 2016). In data parallelism, each
node executes the same task on different pieces of dis-
tributed data. Task parallelism focuses on distributing
execution processes across different parallel comput-
ing nodes. Graph parallelism consists of systems that
encode computation as vertex programs which run in
parallel and interact along edges in the graph. Com-
puting processing in Big Data can be implemented on
premises or on cloud. Table 11 presents a brief de-
scription for each category of Computing Processing.
3.2 How Can We Represent a Big Data
Taxonomy?
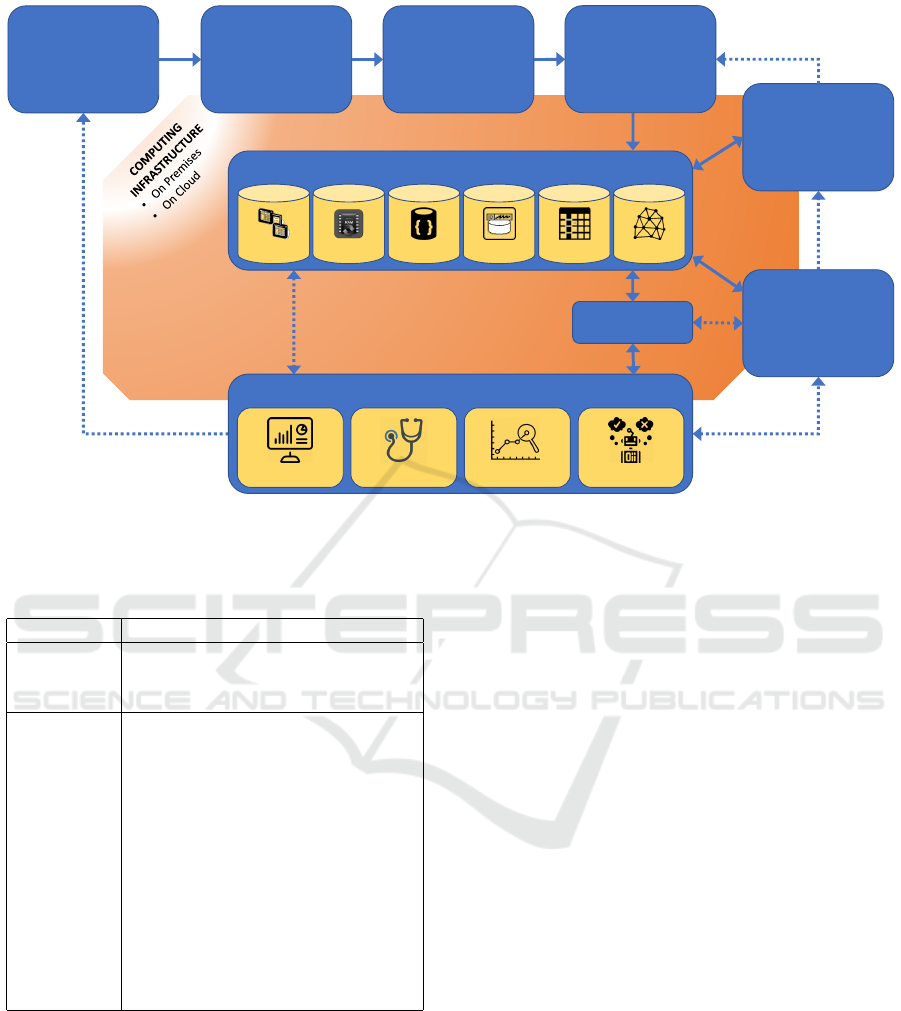
Based on the literature, we consider Big Data as a
group of technological components that interact to
each other. Data acquisition component intends to
collect data from several data sources. Data Trans-
mission component deals with transfering data from
an origin to a destination. Data Ingestion handles
data sending them to Data Storage. Data Prepro-
Towards a Taxonomy for Big Data Technological Ecosystem
301
DATA CREATION
• Logs
• Corporate
• Sensors
• Social
• DaaS
DATA ACQUISITION
• File Transfer
• Database
• Messaging
• Web Search
• API
DATA TRANSMISSION
• Wired
• Wireless
DATA INGESTION
• Data in motion
• Data at rest
DATA PREPROCESSING
• Transformation
• Reduction
DATA ANALYTICS
• Data Modeling
• App Development
DATA APPLICATIONS
DESCRIPTIVE PRESCRIPTIVEDIAGNOSTICS PREDICTIVE
DATA STORAGE
Relational In Memory Document DB Key-Value Columnar DB Graph DB
ABSTRACTION
MIDDLEWARE
Source: Authors
Figure 4: The Big Data Technological Ecosystem.
Table 11: Categories of Computing Processing Component.
Category Description
On
Premises
Each company manage each own
Big Data computing processing us-
ing internal infrastructure
On Cloud Companies pay for using comput-
ing processing infrastructure from
vendors. In public clouds, ven-
dors manage their proprietary data-
centers delivering services built on
top of them. In private clouds,
vendors provide services deployed
over a company intranet or in a pri-
vate data center. In hybrid clouds
there is a composition of two or
more (private or public) clouds that
remain different entities but are
linked together
Source: Authors
cessing component interacts with stored data to ad-
dress missing and noisy data. Depending on the pro-
cess, an interaction between Data Preprocessing and
Data ingestion may occur in order to adjust data pro-
cessing. Data Analytics component cares about data
exploration, development and deployment of applica-
tions. It can request adjustments in Data Preprocess-
ing. Data Applications component extracts value
from stored data. It can create more data, creating
an interaction with Data Creation aspect. It can re-
quest adjustments in deployed applications, creating
interaction with Data Analytics component. Data Ap-
plications component can also interact with Abstrac-
tion Middleware which may interact with Data Stor-
age aspect. Computing Infrastructure aspect inter-
acts with all other aspects as every component needs
computing power to perform its tasks.
After identifying main constructs related to Big
Data, a hierarchical taxonomy for Big Data compo-
nents was created as presented in figure 4. This tax-
onomy considers the roles performed by technologies
inside the Big Data technological ecosystem, that is,
all Big Data components and their interactions in a
high level.
3.3 Is the Proposed Taxonomy Sufficient
for Describing Existing Tools?
Considering the proposed taxonomy as reference we
assessed fifty randomly selected Big Data tools to ver-
ify if this taxonomy is sufficient for describing real-
world existing tools, as described in Table 1. In a
general way, all Big Data tools were fully explained
and their features were categorized into one or more
categories. Most part of tools presented features that
allow the development, deployment or the usage of
applications. There was a single category not used to
explain any of the selected tools: Wired Data Trans-
ICEIS 2020 - 22nd International Conference on Enterprise Information Systems
302

Table 12: Results of Big Data Taxonomy Validation.
Component Category Ratio
Data Creation
Sensors 26%
DaaS 16%
Logs 10%
Social 10%
Corporate 6%
Data Acquisition
Web Search 24%
API 20%
Messaging 16%
File Transfer 10%
Database Integration 10%
Data Transmission
Wireless 6%
Wired 0%
Data Ingestion
Data in Motion 22%
Data at Rest 18%
Data Storage
In Memory 10%
Key Value Pair 8%
Columnar DB 8%
Relational 6%
Graph DB 6%
Document DB 4%
Data Preprocessing
Transformation 20%
Reduction 8%
Abstraction Mid-
dleware
Security 22%
Context Detection 10%
Interoperation 8%
Portability 6%
Device Discovery 2%
Data Analytics
Data Modeling 28%
App Development 24%
Data Applications
Predictive 30%
Prescriptive 24%
Descriptive 22%
Diagnostic 20%
Computing Infras-
tructure
On Cloud 18%
On Premises 8%
Source: Authors
mission. Table 12 summarizes results of this quali-
tative assessment. Column ”Ratio” shows percentage
of tools classified on each category.
4 DISCUSSION
Big Data can be defined as an integrated ecosystem
of technologies performing formal roles with the pur-
pose to create technical conditions for the delivery of
value-added applications based on data. As an inte-
grated ecosystem, each technology has direct or indi-
rect effect both in other technologies and also in final
applications. The roles of technologies in Big Data
Technological Ecosystem can be divided in three ma-
jor groups: 1) data gathering; 2) application devel-
opment; 3) computing infrastructure. The first group
enables the creation, acquisition, transmission, inges-
tion and storage of data. The second group enables
both preprocessing and analysis of data as well as the
development and deployment of value-added applica-
tions. Computing infrastructure supports the whole
ecosystem.
In this regard, each technology should be minutely
chosen in order to extract the most of Big Data ini-
tiatives and to avoid loss of effectiveness and unnec-
essary investments. Value-added applications depend
on certain technical conditions to be developed and
deployed. On the one hand, Big Data is focused on
the technological perspective and explains how tech-
nologies should be organized in order to enable value
creation in Data Science initiatives, for instance. On
the other hand, it seems that organizations need to cre-
ate processes and structures to stimulate the develop-
ment and deployment of value-added applications on
top of Big Data technologies.
It is important to highlight that, according to this
definition, there is not an ideal Big Data technolog-
ical ecosystem. This may explain the difficulties to
define the term Big Data so far. Although Big Data
comprises technologies performing formal roles, the
technologies chosen to perform each role may vary
among organizations. This creates infinite possibil-
ities as each organization is free to define its own
Big Data technological ecosystem based on the most
appropriate technologies for their case. In this re-
gard, taxonomy proposed in this study may be used
to help organizations to choose technologies that best
suit their own interest as it can be used as a reference
for comparison of Big Data technologies. In practical
terms, organizations may use this study to compare
features of different Big Data technologies, keeping
in mind the importance of defining at least one tool
for each role of Big Data technological ecosystem.
5 CONCLUSION
Components of Big Data technological ecosystem can
be classified in ten categories: data creation, data ac-
quisition, data transmission, data ingestion, data stor-
age, data preprocessing, data modeling, abstraction
middleware, data applications and computing infras-
tructure. The taxonomy proposed in this study ex-
plained terms and concepts related to these aspects
based on literature. More than that, taxonomy was
sufficient to classify fifty Big Data tools, randomly se-
lected for this study. This work contributes to the clar-
ification of concepts and terminologies related to Big
Towards a Taxonomy for Big Data Technological Ecosystem
303

Data and facilitates dissemination and usage of Big
Data across research fields. Additionally, this work
helps to establish a common ground for all parts in-
volved in the whole Big Data technological ecosys-
tem. In this regard, knowing the Big Data taxonomy
proposed in this study may direct attention for each
required aspect. The results of this study can con-
tribute to reduce the lack of vocabulary related to Big
Data and help companies to leverage Big Data initia-
tives. Taxonomy proposed in this study may be used
to help organizations to choose technologies that best
suit their own interest as it can be used as a reference
for comparison of Big Data technologies.
This study has limits as it described Big Data
ecosystem from a technological perspective only. In
this context, no managerial, social or organizational
aspect was considered. In this regard, word ”ecosys-
tem” was used to explain only the technological as-
pects of Big Data. Thus, management processes that
oversight availability, usability, integrity and security
of data were not discussed here. Additionally, only
publications written in English had been considered.
It is important to highlight that during the ”collect
terms and concepts” stage, it was necessary to inter-
pret subjective information provided by publications
as they did not present objective details regarding the
topics analyzed. Future works could expand the pro-
posed taxonomy, creating a Big Data ontology or the-
saurus, extending this classification.
REFERENCES
1010Data (2019). Self-service platform for data manage-
ment, analytics and application building.
23andMe (2019). Dna genetic testing & analysis.
3Scan (2019). Discover in 3d with 3scan whole tissue digi-
tization and exploration.
6Sense (2019). Abm orchestration platform.
Actifio (2019). Enterprise cloud data management.
ActionIQ (2019). Enterprise customer data platform - cdp.
Active.Ai (2019). Enterprise ai platform for financial ser-
vices.
Acxiom (2019). Identity resolution & people-based market-
ing.
Aerospike (2019). Aerospike.
Affirm (2019). Affirm.
Ahlemeyer-Stubbe, A. and Coleman, S. (2014). A practical
guide to data mining for business and industry. John
Wiley & Sons.
AiCure (2019). Intelligent observation. better care.
Airobotics (2019). Automated industrial drones.
Airtable (2019). Organize anything you can imagine.
Apache (2019a). Apache drill - schema-free sql for hadoop,
nosql and cloud storage.
Apache (2019b). Apache hive tm.
Apache (2019c). Apache mesos.
Apache (2019d). Stateful computations over data streams.
Augury (2019). Machines talk, we listen.
Austerlitz, H. (2003). Data acquisition techniques using
PCs. Academic Press, San Diego, CA.
Bari, A., Chaouchi, M., and Jung, T. (2014). Predictive
Analytics for Dummies. Wiley, [s.l].
Birst (2019). Business intelligence & analytics, bi software.
Cady, F. (2017). The data science handbook. John Wiley &
Sons, Inc., Hoboken, NJ.
Chaqfeh, M. A. and Mohamed, N. (2012). Challenges in
middleware solutions for the internet of things. In
Collaboration Technologies and Systems (CTS), 2012
International Conference on, pages 21–26. IEEE.
Cignifi (2019). Cignifi transforms mobile behavior into fi-
nancial opportunity.
Cloudera (2019). The enterprise data cloud company.
CyberX (2019). Ics, scada & ot security for the industrial
network.
Darktrace (2019). Darktrace.
Demchenko, Y., de Laat, C., and Membrey, P. (2014).
Defining architecture components of the big data
ecosystem. In 2014 International Conference on Col-
laboration Technologies and Systems (CTS), pages
104–112.
Dietrich, D., Heller, B., and Yang, B. (2015). Data Science
and Big Data Analytics: Discovering, Analyzing, Vi-
sualizing and Presenting. Wiley, [s.l].
Duckett, G. (2016). Data Science: Questions and Answers.
CreateSpace Independent Publishing Platform, [s.l].
Elastic (2019). Open source log management.
Emilio, M. D. P. (2013). Data Acquisition Systems From
Fundamentals to Applied Design. Springer, New
York, NY.
Estimote (2019). Indoor location with bluetooth beacons
and mesh.
Fabbri, S., Silva, C., Hernandes, E., Octaviano, F.,
Di Thommazo, A., and Belgamo, A. (2016). Improve-
ments in the start tool to better support the systematic
review process. In Proceedings of the 20th Interna-
tional Conference on Evaluation and Assessment in
Software Engineering, pages 1–5.
Forte, R. M. (2015). Mastering predictive analytics with R:
master the craft of predictive modeling by developing
strategy, intuition, and a solid foundation in essential
concepts. Packt Publishing, Birmingham, UK.
Garcia, S., Herrera, F., and Luengo, J. (2015). Data prepro-
cessing in data mining. Springer International Pub-
lishing, Cham.
Garmin (2019). Garmin international.
Gartner (2015). Descriptive analytics.
Gass, S. I. and Harris, C. M. (2001). Encyclopedia of op-
erations research and management science. Kluwer
Academic, Boston.
Google (2019). Cloud dataflow - stream & batch data pro-
cessing — cloud dataflow — google cloud.
ICEIS 2020 - 22nd International Conference on Enterprise Information Systems
304

Han, J., Kamber, M., and Pei, J. (2012). Data mining:
concepts and techniques. Morgan Kaufmann, Ams-
terdam.
Helium (2019). An internet for machines.built and owned
by you.
Hevner, A. and Chatterjee, S. (2010). Design research in
information systems: theory and practice, volume 22.
Springer Science & Business Media.
Howden, C., Liu, L., Li, Z., Li, J., and Antonopoulos,
N. (2014). Virtual vignettes: the acquisition, analy-
sis, and presentation of social network data. Science
China Information Sciences, 57(3):1–20.
HumanAPI (2019). Get health data from everywhere.
Illumio (2019). Illumio.
Ishizuka, Y., Chen, W., and Paik, I. (2016). Workflow trans-
formation for real-time big data processing. In Big
Data (BigData Congress), 2016 IEEE International
Congress on, pages 315–318. IEEE.
Kantere, V. and Filatov, M. (2015). A workflow model
for adaptive analytics on big data. In Big Data (Big-
Data Congress), 2015 IEEE International Congress
on, pages 673–676. IEEE.
Larose, D. T. and Larose, C. D. (2015). Data mining and
predictive analytics. Wiley, Hoboken, NJ.
Lee, C. (2016). Guest editorial: Automated big data analy-
sis for social multimedia network environments. Mul-
timedia Tools and Applications, 75(20):12663–12667.
Liu, J., Li, J., Li, W., and Wu, J. (2016). Rethinking big
data: A review on the data quality and usage issues.
ISPRS Journal of Photogrammetry and Remote Sens-
ing, 115:134 – 142. Theme issue ’State-of-the-art in
photogrammetry, remote sensing and spatial informa-
tion science’.
Luis, T. (2017). Data mining with R: learning with case
studies. CRC Press, Taylor and Francis Group, Boca
Raton.
MariaDB.org (2019). Mariadb.org.
MemSQL (2019). Memsql is the no-limits database power-
ing modern applications and analytical systems.
MicroStrategy (2019). Business analytics & mobility solu-
tions.
MongoDB (2019). The most popular database for modern
apps.
Murthy, P., Bharadwaj, A., Subrahmanyam, P. A., Roy, A.,
and Rajan, S. (2014). Big data taxonomy.
Neo4J (2019). Neo4j graph platform – the leader in graph
databases.
Objectivity (2019). Infinitegraph - distributed graph
database.
OpenTSDB (2019). A distributed, scalable monitoring sys-
tem.
Oracle (2019). Oracle berkeley db.
Palazzo, C., Mariello, A., Fiore, S., D’Anca, A., Elia,
D., Williams, D. N., and Aloisio, G. (2015). A
workflow-enabled big data analytics software stack
for escience. In High Performance Computing & Sim-
ulation (HPCS), 2015 International Conference on,
pages 545–552. IEEE.
PTC (2019). Digital transformation solutions to unlock the
value of iiot.
Rani, B. K. and Babu, A. V. (2015). Scheduling of big data
application workflows in cloud and inter-cloud envi-
ronments. In 2015 IEEE International Conference on
Big Data (Big Data), pages 2862–2864. IEEE.
RecordedFuture (2019). Threat intelligence powered by
machine learning.
Redmond, A. (2013). SLA 2013 Annual Conference. SLA,
San Diego, CA.
Riak (2019). Enterprise nosql database.
Samsara (2019). Internet-connected sensors.
Sawant, N. and Shah, H. (2013). Big Data Application
Architecture Q & A: a Problem-Solution Approach.
Apress, Berkeley, CA.
Sayad, S. (2010). Model deployment.
SecurityScorecard (2019). Cyber security scores & risk
analysis.
SentinelOne (2019). Endpoint security software.
Sentry (2019). Error tracking software - javascript, python,
php, ruby, more.
Sift (2019). Digital trust & safety: Go beyond fraud pre-
vention with sift.
Signifyd (2019). Guaranteed fraud protection and charge-
back recovery.
SlamData (2019). The mra powered etl solution provider.
SparkCognition (2019). Sparkcognition.
Tsai, C.-F., Lin, W.-C., and Ke, S.-W. (2016). Big data
mining with parallel computing: A comparison of dis-
tributed and mapreduce methodologies. Journal of
Systems and Software, 122:83–92.
Turck, M. (2018). Great power, great responsibility: The
2018 big data & ai landscape.
Uptake (2019). Industrial ai and iot for global industry.
WebQDA (2019). webqda – qualitative data analysis soft-
ware.
Xu, L. D., He, W., and Li, S. (2014). Internet of things in
industries: A survey. IEEE Transactions on Industrial
Informatics, 10(4):2233–2243.
Towards a Taxonomy for Big Data Technological Ecosystem
305
