
Regional Module of Intelligent Transportation System: Algorithms and
Information Infrastructure
Anton Sysoev
a
and Elena Khabibullina
b
Department of Applied Mathematics, Lipetsk State Technical University, Moskovskaya str., 30, Lipetsk, Russia
Keywords:
Intelligent Transportation System, Transportation Corridor, Highway Capacity, Data Warehouse Model,
Relational Data Model, NoSQL Data Model.
Abstract:
Due to the increasing number of personal transportation vehicles and cargo transportation it is reasonable to
implement intelligent transportation systems based on adaptive algorithms to deliver the effective control of
traffic flows within the highspeed transportation corridors connecting different countries. The presented paper
proposed the concept of the regional intelligent transportation system module which could be extented into
regions taking into account its specific features. Presented approaches are considered on the data on real-time
traffic flow parameters collected from different heterogeneous data sources. The nature of the data and its
structure underlie the data warehouse model.
1 INTRODUCTION
1.1 Relevance and Motivation
Creating the regional module of intelligent transporta-
tion system and a great interest devoted to similar
projects could be explained by many reasons. But,
first of all, it is an ability to connect the heteroge-
neous transportation monitoring and control systems
together. This idea prevails in the road map of Au-
toNet market of Russian National Technological Ini-
tiative (NTI) (NTI, 2011).
NTI is the program to support perspective devel-
oping Russia economics sectors which can be the ba-
sis of the world’s economy in the next 20 years. The
collection of its road maps is the main document con-
taining a list of priority trends and tasks in different
spheres. They are also based on studying the sphere of
economy modernization and innovative development
and include the results analysis of each implementa-
tion step. According to the road maps the Russian
Government confirmed participation on 7 world econ-
omy’s markets, among which is the AutoNet market.
Road maps are regulatory instruments and plans
of action connected with creating new products, busi-
ness models and performing lots of tasks. For exam-
ple the regulatory legal framework, intelligent trans-
port and unmanned driving system development pro-
a
https://orcid.org/0000-0002-0866-1124
b
https://orcid.org/0000-0003-0542-9861
viding. The current project could be referred to Au-
toNet market, the main development ways of which
are unmanned vehicles and intelligent transportation
systems.
The organizations developing intelligent trans-
portation systems actively implement projects to fore-
cast traffic volumes and flow-control. They actively
work in Japan, America, European Union, Australia,
Brazil, China, Canada, Chile, Korea, Malaysia, New
Zealand, Singapore, Taiwan, the UK. In India, Thai-
land and some countries of South Africa such sci-
entific schools and organizations are just beginning
to develop the concept of smart roads ((Hasegawa,
2014), (ITS-America, 2019), (LTA and ITSS, 2014)).
Nowadays, the most advanced technologies in the
field of intelliget transportation control are designed
in Japan, the USA, Singapore and South Korea. The
main directions of developing intelligent systems in
these countries are connected vehicle technologies,
connected corridors, well-managed and resilient traf-
fic flows, Smart Roads and integration these technolo-
gies into Smart City Systems and Internet of Things.
Taking into account the Russian Federation ge-
ographical location the propoced intelligent trans-
portation system has to connect both European and
Asian transportation systems with its specifical fea-
tures (e.g., right or left driving and connected ques-
tions, normative documents and regulating laws, per-
sonal data protection, etc.).
Sysoev, A. and Khabibullina, E.
Regional Module of Intelligent Transportation System: Algorithms and Information Infrastructure.
DOI: 10.5220/0009414102450251
In Proceedings of the 6th International Conference on Vehicle Technology and Intelligent Transport Systems (VEHITS 2020), pages 245-251
ISBN: 978-989-758-419-0
Copyright
c
2020 by SCITEPRESS – Science and Technology Publications, Lda. All rights reser ved
245
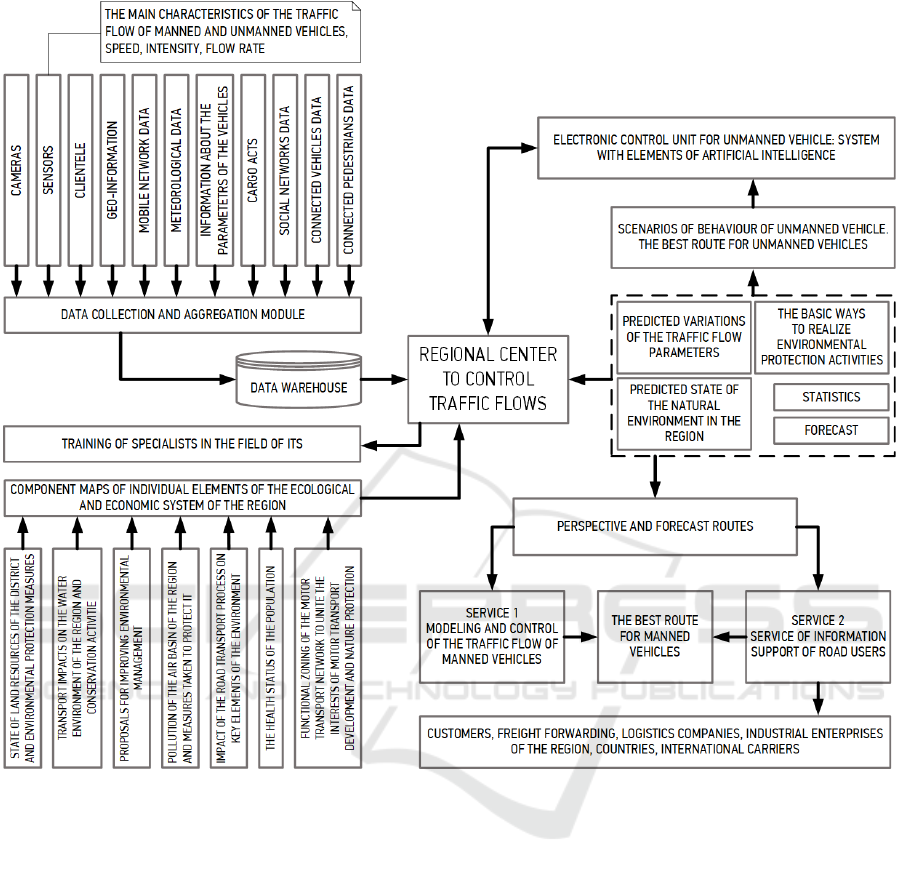
Figure 1: Conceptual Scheme of Regional Intelligent Transportation System Module.
1.2 Conceptual Scheme of Regional
Intelligent Transportation System
Module
Based on long-term studies in Lipetsk State Techni-
cal University it is proposed the following structural
scheme to organize the regional module for the intel-
ligent transportation and logistics system (cf. Figure
1).
Regional Center to Control Traffic Flows (Kor-
chagin et al., 2011) consisting of manned and un-
manned vehicles delivers following functions: col-
lecting information about traffic conditions and cargo
acts; processing, analyzing and storing big data; as
well as the training of specialists in the field of in-
telligent transportation systems. This center is an
academic, scientific-educational institution aimed at
solving transportation problems using the achieve-
ments on intelligent transportation control. The pro-
posed structure is a platform to implement regional
modules of the intelligent transportation and logistics
system of the Russian Federation.
Based on the detected traffic flow characteristics
deviations and predefined quality criteria, the control
system (which is a part of the regional control centre)
changes traffic signaling modes and / or variable traf-
fic signs (including adaptive control) to achieve the
optimal values of the observed criteria. Depending
on the task to be solved, it is possible to use vari-
ous system quality criteria (system security criteria,
just-in-time and other logistic principles) (Galkin and
Sysoev, 2019). It is assumed to use a system of traffic
controllers switching traffic signals and variable traf-
fic signs. In addition the necessary information for
road users has to be constantly placed on the real-time
VEHITS 2020 - 6th International Conference on Vehicle Technology and Intelligent Transport Systems
246

information boards.
The main goal of the current study is to present the
usage of the advanced algorithms to control traffic sit-
uation within the highspeed transportation corridors
and to construct the data warehouse model to collect
and to store aggregated from heterogeneous sources
data efficiently.
2 CONTROL OF TRAFFIC
SITUATION WITHIN THE
HIGHSPEED
TRANSPORTATION
CORRIDORS
2.1 Modeling Transportation Corridor
It is reasonable to consider a highspeed transporta-
tion corridor to be modeled as a freeway with a ramp
metering system controlling the access to the corri-
dor from all entry ramps. Depending on the traffic
volumes and other factors, the ramp metering sys-
tem can be either active or not. Therefore, activa-
tion parameters are defined and set for the corridor
based on its traffic characteristics and geometry, the
weather conditions, and other factors. For detecting
optimal metering rates from the global point of view,
it is proposed to use the solution of a mathematical
optimization problem, which determines the minimal
travel time (including delays on the entry ramps) for
traversing the whole analyzed transportation corridor
segment.
The segment of the highspeed transportation cor-
ridor could be divided into sections of two types. This
division is characterized by the location of the entry
ramps (cf. Figure 2).
(I) Sections of the first type consist of an exit ramp
and the following segment up to the next entry ramp.
The traffic volume in this case can be calculated as the
difference between the volume upstream of the exit
ramp and the volume of the exiting traffic.
(II) Sections of the second type, which start where
vehicles from the ramp enter the main roadway and
end at the next exit, are more important in terms of
optimization, because the traffic volume depends on
the calculated ramp metering parameters.
Sections of both types have a total travel time
which must be calculated in an on-line regime ac-
cording to the current traffic conditions. Delays in the
entry ramps, which are caused by the ramp metering
system, are referred to sections of type II.
To quantify the total travel time, the travel time
within the corridor and the delay on the entry ramps
have to be summed up. The volumes measured at the
entry ramps and detected within the corridor serve as
input data for the optimization model.
Total travel time could be found as
t =
L
v(q)
· q · ∆ for free traffic,
L
v
crit
· q · ∆ +t
loss
for congested traffic,
(1)
v(q) =
v
0
1 +
v
0
L
0
· (C
0
− q)
,
t
loss
(q, c) = A ·
q
c
− 0.9
B
,
where t is the total travel time (veh·h), L is the seg-
ment length (km), v(q) is the speed (km/h), q is the
traffic volume (veh/h), ∆ is the interval duration (h),
v
crit
is the critical speed at capacity (km/h), t
loss
is the
congestion-related travel time losses (veh·h), v
0
, L
0
,
C
0
, A, B are model parameters.
On approaches to entry ramps appears another
type of the delay which could be estimated as a traffic
delay on non-regulated (when ramp metering system
is turned off) or regulated (when the system is turned
on) intersection. Calculations of this delay times are
based on volume-to-capacity ratio. The freeway seg-
ment capacity was estimated based on the mathe-
matical remodeling approach [(Sysoev et al., 2019),
(Sysoev and Voronin, 2019)]. In this paper the fol-
lowing model from Highway Capacity Manual 2010
(TRB, 2010) was used:
d(q) =
0.5 · C ·
1 −
g
C
2
1 − min
1,
q
c
·
g
C
+ 900×
×T ·
q
c
− 1 +
s
q
c
− 1
2
+
8 · k · I ·
q
c
c · T
,
(2)
where d(q) is the average delay time (s), C is the
phase cycle time (s), g is the green time within the cy-
cle time (s), (always equal to a fixed time interval), q
is the traffic volume (veh/h), c is the capacity (veh/h),
T is the duration of analysis period (h), k is the in-
cremental delay factor that is dependent on controller
settings, I is the upstream filtering/metering adjust-
ment factor.
For each analyzed time interval, both travel time
components are calculated with the models (1) and
(2), respectively. In contrast to the classical stochas-
tic approach based on a Poisson distribution for the
arriving process and some stochastic distribution for
the explanation of the service time, the determinis-
tic (systematic) mechanism assumes using a constant
fixed arriving time for every request (vehicle) in a sys-
tem and constant times for the service process. The
Regional Module of Intelligent Transportation System: Algorithms and Information Infrastructure
247
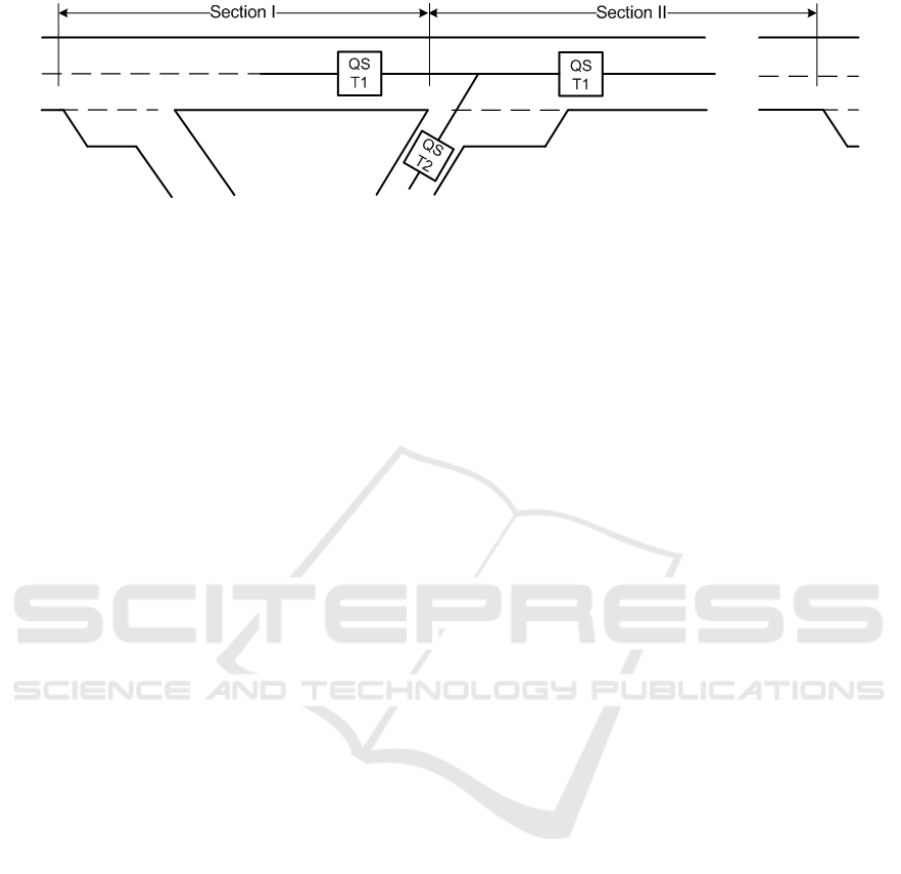
Figure 2: Queueing Systems as a Basis of Freeway Segment.
assumed deterministic queueing system is a D/D/1
queue with deterministic arrivals and deterministic
service times at 1 server.
Figure 2 also illustrates how deterministic queue-
ing systems are applied to model the different seg-
ment types of highway transportation corridor. The
following two types of queueing systems are defined.
QS T1: D/D/1 queueing system used to model
the traffic flow within the corridor, where main traf-
fic flow characteristics (traffic volume etc.) are taken
as input parameters.
QS T2: D/D/1 queueing system used to model the
traffic flow on the entry ramps. Delays on the entry
ramp arise because of a high volume within the corri-
dor and/or ramp metering. By varying the ramp me-
tering control parameters, it is possible to minimize
the service time.
The aim of formulating the problem is to find opti-
mal regulation parameters for the Type 2 queuing sys-
tems to provide a higher level of quality for the whole
freeway facility.
2.2 Finding Optimal Control
Parameters
The problem described below can be considered as a
non-linear multidimensional constrained global opti-
mization problem and formulated as:
min
x∈R
n
n
∑
j=1
(t
j
(x) + d
j
(x)) (3)
with constraints:
x
min
≤ x ≤ x
max
,
g(x) ≤ 0,
h(x) = 0,
(4)
where t
j
(x) is the total travel time within the segment
j (veh·h), d
j
(x) is the average delay time on the ap-
proach within the segment j (veh·h) , x is the vector of
optimal cycle times for the investigated part of free-
way (s), x
min
, x
max
are the minimum and maximum
limitations of the cycle times respectively (s), h(x),
g(x) are equality and inequality constraints functions
respectively.
Such formulation (3)–(4) is a general one and in
every particular case different additional equality and
inequality constraints functions could be taken into
account. To find the solution of the stated problem al-
gorithms of both types analytical and numerical may
be applied. The only limitation for using analytical
approach is non-differentiability of the function esti-
mating delay on approaches to entry ramps in case
of congestion. Before the volume-to-capacity ratio
equals 1, the problem could be solved with traditional
methods such as Lagrange multipliers approach.
It should be mentioned, that the propoced ap-
proach to find an optimal parameters to deliver the
minimum total travel time was implemented on A40
German Autobahn and has demonstrated results bet-
ter than existing local ramp-metering approaches (like
ALINEA algorithm, cf. (Sysoev et al., 2017)).
3 INFORMATION
INFRASTRUCTURE OF
INTELLIGENT
TRANSPORTATION SYSTEM
The solution of the tasks which are posed to the
regional intelligent transportation system module is
possible with a complex analysis of relevant data.
According to studies (Khabibullina et al., 2019b),
(Khabibullina et al., 2019a), (Khabibullina and Pogo-
daev, 2019) such information can be obtained from
sources with heterogeneous nature and format. The
presented organizational and technological model (cf.
Figure 3) allows collecting information from hetero-
geneous data sources, data pre-processing and dis-
tributed aggregation.
Data obtained from heterogeneous sources can be
divided into the following types according to the pos-
sible representation form:
• Well-structured data (e.g. knowledge base for ex-
pert system; information on high-speed corridors
VEHITS 2020 - 6th International Conference on Vehicle Technology and Intelligent Transport Systems
248
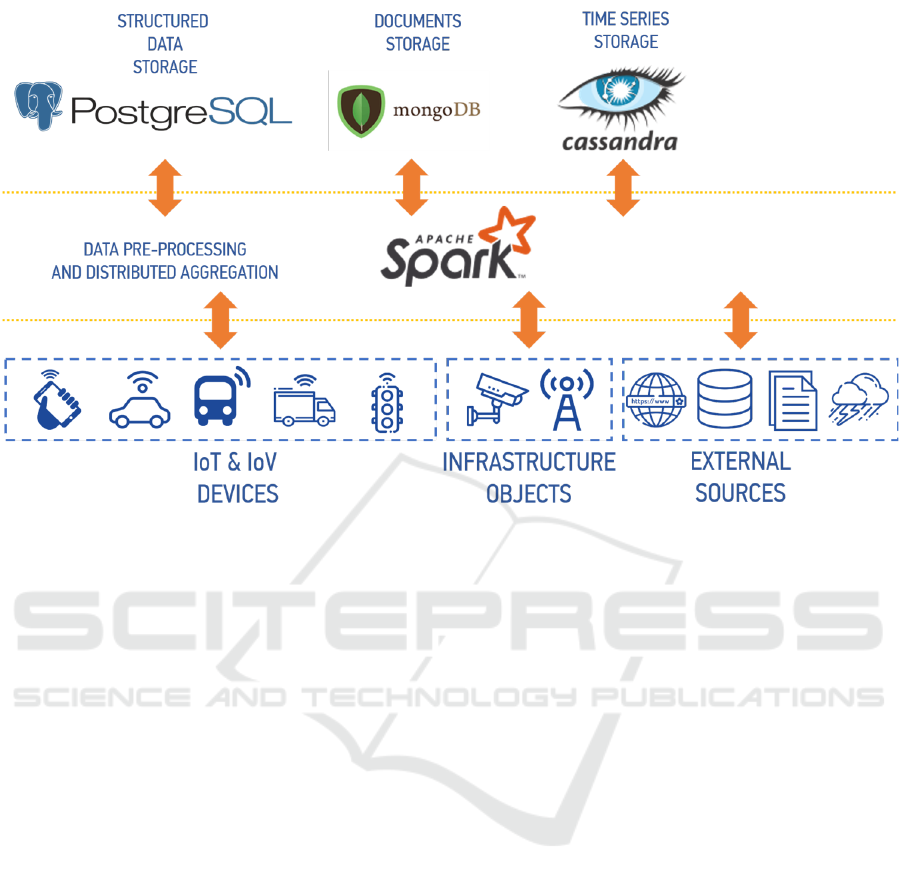
Figure 3: Organizational and Technological Model of Data Warehouse.
(area, grade, work zone layout, number of lanes
in one direction, lane widths, availability of ac-
celeration lane, speed limits); information on traf-
fic accidents; information on public transport traf-
fic patterns; catalogue of large companies in the
region; cargo transportation data in the region;
passively collected information (news, social me-
dia posts, information about major events that can
cause heavy traffic));
• Data in the form of time series (data collected
from road infrastructure sensors or received as a
result of processing of data from road cameras or
passively collected information, for example, av-
eraged speed of vehicles on lanes, percentage of
heavy vehicles, predicted freeway capacity; me-
teorological data; mobile devices data; connected
vehicles data);
• Data stored in the document form (data obtained
from CCTV cameras, unmanned vehicles cam-
eras, audio content from mobile devices, etc.).
It is proposed to use a data warehouse model com-
bining the following data models:
• The relational model for well-structured data;
• NoSQL model for storing and processing data in
documentary form (data for determining transport
flow parameters are analogue in origin and other
data from heterogeneous data sources, which are
more convenient to store and process efficiently in
the JSON-format);
• NoSQL model for storing and processing time
series (relational DBMS can be used for stor-
ing and processing such data, but specialized
databases provide scalability for working with
large amounts of data and provide special func-
tions for processing time series).
Apache Spark will be used to implement dis-
tributed pre-processing (filtering and aggregation) of
unstructured and semi-structured data coming from
heterogeneous sources in different formats. Post-
greSQL was chosen as a relational DBMS, MongoDB
allows storing data effectively in JSON-format doc-
uments obtained from heterogeneous data sources,
Cassandra was chosen as NoSQL DBMS to work with
data in time series format.
3.1 Relational Data Model Description
in ITS
The relational data model due to the specificity of data
sources is used mainly for the storage and analysis of
actual and reference data. Each source has its own
relational model (an example of a relational model for
storing and processing traffic accident information is
given in (Khabibullina and Pogodaev, 2019).
Regional Module of Intelligent Transportation System: Algorithms and Information Infrastructure
249

3.2 NoSQL Data Models Description in
ITS. Documents Storage
Data is stored and processed as documents which
are described in JSON format in a document-based
database. This type of database allows working with
data using the same document model that is used in
the regional intelligent transportation system module.
The flexible, semi-structured, hierarchical nature of
documents and document-based databases allow de-
velopment according to the needs of the system. The
proposed model allows flexible indexing, standard
queries and document collections analytics.
Such data can be described in the following terms:
• Location (coordinates system, latitude and longi-
tude) of the transmitting device or reported action;
• Time of data transmission or reported action;
• Data category (location-based mobile phone data,
GPS data, road cameras data);
• Data format (single value, matrix, vector, text, im-
age, etc.)
• Data representation (e.g. measurement unit).
• Semantics of the data (e.g. tracking vehicle or mo-
bile phone).
Thus, based on the above, the document database
model can be defined as follows.
{" de fin it i on s " : {
" E l eme nt " : {
" type ": " o bjec t " ,
" a dd it io n al Pr op e rt ie s " : f al se ,
" p rop ert ies " : {
" time ": {
" type ": " s trin g " ,
" fo rmat ": " date - tim e "
},
" l oca t ion ": {
" $ref ": "#/ d e fi n it ion s /
Lo c ati on "
},
" d at a _c ate go r y " : {
" type ": " s trin g "
},
" d ata _f o rm a t " : {
" type ": " s trin g "
},
" d at a_ r ep re sa nt a ti on ": {
" type ": " s trin g "
},
" d at a _s em a nt ic s " : {
" type ": " s trin g "
},
" f ile _pa t h " : {
" type ": " s trin g "
}
},
" r equ i red ": [
" d at a _c ate go r y " ,
" d ata _f o rm a t " ,
" d at a_ r ep re sa nt a ti on ",
" d at a _s em a nt ic s " ,
" f ile _pa t h " ,
" l oca t ion ",
" time "
],
" ti t le " : " El e men t "
},
" L oca t ion ": {
" type ": " o bjec t " ,
" a dd it io n al Pr op e rt ie s " : f al se ,
" p rop ert ies " : {
" c oo rd i na te s_ s ys te m " : {
" type ": " s trin g "
},
" c oor di n at e s " : {
" type ": " a rr ay " ,
" it e ms " : {
" type ": " n umbe r "
}
}
},
" r equ i red ": [
" c oor di n at e s " ,
" c oo rd i na te s_ s ys te m "
],
" ti t le " : " Lo cat i on "
}
}
}
3.3 NoSQL Data Models Description in
ITS. Time Series Storage
Using relational databases to store and analyze time
series in the knowledge domain with a pronounced
Big data problem is not possible ((Chowdhury et al.,
2017)). In general, the time series model for ITS can
be represented as Figure 4.
Figure 4: ITS Time Series Data Model in General.
VEHITS 2020 - 6th International Conference on Vehicle Technology and Intelligent Transport Systems
250

For easy understanding, it can be drawn an anal-
ogy with the terms of relational databases: a key space
corresponds to the concept database schema in a re-
lational model. This key space can contain multiple
column families, which corresponds to the concept of
a relational table. In turn, column families contain
columns, which are combined using the row key in
the row. A column consists of three parts: a column
name, a timestamp, and a value. The columns within
the record are ordered. Unlike a relational database,
there are no restrictions on the fact that records (and
in terms of database these are rows) contain columns
with the same names as in other records.
This generalized model description should be spe-
cialized for each type of data source by changing col-
umn names and reorganizing column families.
4 CONCLUSION
In this paper the complex study on the regional intel-
ligent transportation system module is presented. The
conceptual scheme and algorithms which are used to
control traffic flows in high-speed transport corridors
are described. To solve the module’s tasks it is nec-
essary to collect and aggregate information from het-
erogeneous data sources.
The information infrastructure of intelligent trans-
portation system is considered. It allows aggregation,
storage and receiving information from a data ware-
house effectively. The presented model is based on
the decomposition of the information data warehouse
model into data models corresponding to the degree
of data structuring and amount of data.
An important question on traffic safety has to be
implemented in the ITS regional module. In case of
car accidents the total travel time increases signifi-
cantly, that’s why there should be a developed sys-
tem to recognize accidents immediately and to man-
age road servises for eliminating consequences of ac-
cidents. Based on on-line video streams from high-
way corridors and approaches to them the pre-trained
reccurent neural network could identify accident with
a high accuracy and send to emergency services GPS
cam location to find out the fastest way to the scene
of the car accident.
ACKNOWLEDGEMENTS
The reported study was supported by the Russian Sci-
ence Foundation within the project 18-71-10034.
REFERENCES
Chowdhury, M., Apon, A., and Dey, K. (2017). Data Ana-
lytics for Intelligent Transportation Systems. Elsevier,
Amsterdam, 1st edition.
Galkin, A. and Sysoev, A. (2019). Formalizing crite-
ria of intelligent transportation and logistics systems
functioning. In Proceedings of the 2nd International
Congress on Transport Infrastructure and Systems in
a changing world (AIIT), in press.
Hasegawa, T. (2014). Intelligent transport system. URL:
http://www.iatss.or.jp/common/pdf/en/publication/
commemorativepublication/iatss40 theory 05.pdf.
ITS-America (2019). Its-america. the official website.
URL: https://www.itsa.org.
Khabibullina, E. and Pogodaev, A. (2019). Data warehouse
model of regional intelligent transportation system in
the concept of its-russia. In Proceedings of the 1st
International Conference on Control Systems, Mathe-
matical Modelling, Automation and Energy Efficiency
(SUMMA). IEEE Xplore.
Khabibullina, E., Sysoev, A., Kadasev, D., and Voronin, N.
(2019a). Data aggregation schemes to determine traf-
fic flow parameters in regional intelligent transporta-
tion systems. In Proceedings of the 2nd International
Congress on Transport Infrastructure and Systems in
a changing world (AIIT), in press.
Khabibullina, E., Sysoev, A., and Voronin, N. (2019b). Ag-
gregation of heterogeneous data for determination of
transportation flow parameters. Transport of the Rus-
sian Federation, 2(81).
Korchagin, V., Tursunov, A., and Rizaeva, Y. (2011).
Sistemnoe predstavlenie struktury adaptivnogo up-
ravleniya predpriyatiem transporta [systematic repre-
sentation of the structure of transportation company
control]. Vestnik Tadjikskogo tehnicheskogo univer-
siteta, 2.
LTA and ITSS (2014). Smart mobility 2030:
Its strategic plan for singapore. URL:
https://www.lta.gov.sg/content/dam/ltaweb/corp/
RoadsMotoring/files/SmartMobility2030.pdf.
NTI (2011). National technological initiative (NTI): Au-
tonet. URL: https://nti2035.ru/markets/autonet.
Sysoev, A., Anikienko, T., and Blyumin, S. (2019). High-
way capacity estimation: International regulation and
neurostructural remodeling approach. Periodica Poly-
technica Transportation Engineering.
Sysoev, A., Hohmann, S., and Geistefeldt, J. (2017). Dif-
ferential evolution approach to calculate optimal ramp
metering rates. International Journal for Traffic and
Transport Engineering (IJTTE), 7(1).
Sysoev, A. and Voronin, N. (2019). Approach to sensi-
tivity analysis of stochastic freeway capacity model
based on applying analysis of finite fluctuations. In
Proceedings of the 1st International Conference on
Control Systems, Mathematical Modelling, Automa-
tion and Energy Efficiency (SUMMA). IEEE Xplore.
TRB (2010). Highway capacity manual — HCM 2010.
URL: http://www.trb.org/Main/Blurbs/164718.aspx.
Regional Module of Intelligent Transportation System: Algorithms and Information Infrastructure
251
