
Hybrid Approach based on SARIMA and Artificial Neural Networks for
Knowledge Discovery Applied to Crime Rates Prediction
Felipe A. L. Soares
a
, Tiago B. Silveira
b
and Henrique C. Freitas
c
Graduate Program in Informatics, Pontif
´
ıcia Universidade Cat
´
olica de Minas Gerais (PUC Minas),
Belo Horizonte, MG, Brazil
Keywords:
Crime Rate Prediction, Mathematical Models, Artificial Neural Networks, SARIMA, Time Series, Knowledge
Discovery.
Abstract:
The fight against crime in Brazilian cities is an extremely important issue and has become a priority agenda
in public, statutory or municipal discussions. Even so, reducing cases of violence is a complex task in large
Brazilian cities, such as Rio de Janeiro and S
˜
ao Paulo, as these large cities have vast criminal points. Therefore,
this paper presents the steps followed in the process of knowledge discovery applied to prediction of crime
rate numbers in different regions of S
˜
ao Paulo city in order to better understand it and distribute the security
forces more efficiently. Then, a hybrid model composed of an Artificial Neural Network and the SARIMA
mathematical model was applied to databases related to different areas of the city. The average results showed
assertiveness rates of 83.12% and 76.78% and root mean square deviation of 1.75 and 2.16 for two different
tests.
1 INTRODUCTION
According to Lourenc¸o et al. (2016), the fight against
crime in Brazilian cities is an extremely important is-
sue and the increase in cases of violence in certain
regions worries the government authorities. The fight
against crime must take place effectively, applying the
available resources correctly.
With a direct impact on trade and industry in
general, high crime rates coupled with low effective-
ness of security forces are responsible for recurring
expenses and expenditures in these sectors. Among
these expenditures, private security investment ac-
counts for most of the costs, followed by theft loss.
According to Tobar (2015), there is an increase in
cases of violence in large cities and the theme has be-
come a priority agenda in public discussions, whether
statutory or municipal. However, reducing the num-
ber of cases of violence is a complex task in the large
Brazilian metropolises, such as Rio de Janeiro and
S
˜
ao Paulo, as they have vast criminal spots, which
makes the analysis of past occurrences complex.
The analysis and extraction of knowledge from
a
https://orcid.org/0000-0002-4141-060X
b
https://orcid.org/0000-0001-5378-2251
c
https://orcid.org/0000-0001-9722-1093
these data allows the best distribution of secu-
rity forces in order to effectively serve the popula-
tion, allowing a more assertive allocation of them.
According to He and Zheng (2009), the use of com-
putational resources is fundamental in the process of
knowledge discovery, helping decision making. How-
ever, these decisions are often made from feeling,
which ultimately reduces efficiency.
Given this context, it is necessary to determine
ways to make the allocation process of police re-
sources more efficient, replacing or combining hu-
man feeling with computational techniques, in order
to combat the high crime rates (J
´
unior et al., 2016).
Thus, the main contribution of this work is the
proposal of a hybrid approach for the most effi-
cient allocation of security resources, based on the
use of the knowledge discovery process suggested
by Fayyad et al. (1996). We used techniques for
predicting time series values, in order to predict the
amount of crime in different regions in the city of S
˜
ao
Paulo (Brazil).
The results were obtained from a hybrid approach,
combining the predictive results of the Seasonal
Autoregressive Integrated Moving Average Model
(SARIMA) and an Artificial Neural Network (ANN)
applied to databases composed of crimes grouped by
their geolocation. From this approach, it was possi-
Soares, F., Silveira, T. and Freitas, H.
Hybrid Approach based on SARIMA and Artificial Neural Networks for Knowledge Discovery Applied to Crime Rates Prediction.
DOI: 10.5220/0009412704070415
In Proceedings of the 22nd International Conference on Enterprise Information Systems (ICEIS 2020) - Volume 1, pages 407-415
ISBN: 978-989-758-423-7
Copyright
c
2020 by SCITEPRESS – Science and Technology Publications, Lda. All rights reserved
407

ble to obtain satisfactory results, reaching an average
of 76.68% assertiveness in the prediction of occur-
rence bulletins, thus presenting the efficiency in the
use of computational models applied to knowledge
discovery.
The remainder of this paper is organized
as follows: Section 2 presents related work
about knowledge discovery in crime-related areas.
Section 3 presents the methodology, tests and the
results obtained. Finally, Section 4 presents the con-
clusions and suggestions for future work.
2 RELATED WORK
Several papers seek to find ways to improve crime-
related decision-making performance. Among these,
Gerber (2014) and Wang et al. (2012) investigated
how the use of tweets on the social network Twitter
can help in prediction actions of crimes.
Gerber (2014) showed that, for 19 of the 25
types of crimes studied, Twitter data improves crime
prediction performance compared to standard ap-
proaches. The author used linguistic analysis specific
to Twitter and the statistical modeling of topics. The
work has implications specifically aimed at criminal
justice decision makers and those responsible for al-
locating resources for crime prevention.
Wang et al. (2012) studied how Twitter data can
help predict crimes. The model was used to predict
future hit and run crimes. The results indicated that
the approach surpasses a reference model that also
predicts this type of crime.
Silva et al. (2017) present an interactive system
for analyzing criminal data in the state of Rio
de Janeiro (Brazil), which provides graphical vi-
sualizations such as time series graph, projections,
dispersion graph and parallel coordinates graph,
based on data provided by the Institution Public Se-
curity. The system allows extracting important infor-
mation on government policies related to the area of
public security. In addition, the work also presents a
case study to evaluate the developed system.
Almanie et al. (2015) analyzed databases from
Denver and Los Angeles, both located in the United
States (USA), using the Decision Tree and Naive
Bayes classifiers to predict possible types of crimes.
Applied to the cross-validation strategy, Naive Bayes
achieved an accuracy of 51% and 54%, while the
Decision Tree was accurate to 42% and 43% for
both Denver and Los Angeles respectively. Iqbal
et al. (2013) applied the same algorithms to crime
databases from different US states to predict the cate-
gory of crimes. The results showed that, in this con-
text, the Decision Tree surpasses Naive Bayes having
an accuracy of 83.95%.
Wawrzyniak et al. (2018) developed techniques
for predictive modeling using ANN deep learning.
For this, the authors adopted databases from two re-
gions of Poland, separated by different regions, and
used the weekly seasonality of the database.
Cherian and Dawson (2015) used machine
learning and statistical techniques for San Francisco
crime classification and prediction problems. Among
the machine learning algorithms, Random Forest was
used, with a maximum precision of 31.84% for the
proposed prediction.
Within the context of crime prediction in Brazilian
cities, J
´
unior et al. (2016) performed the prediction
using time series approach analyzing the amount of
police occurrences in the city of Natal (Brazil), taking
into account strategic regions adopted by the police.
For this, a Autoregressive Integrated Moving Aver-
ages Model (ARIMA) was used, with the mean ab-
solute percentage error (MAPE) of 0.3420 in the
diagnoses.
Lourec¸o et al. (2016) developed a system
called Predictive Policing Support System (SiAPP)
for analyzing and predicting crime-related patterns
using machine learning. From automatic collections,
creation of logical rules and geographical visualiza-
tion of the discovered patterns, the results showed that
the predictions for the region of Niter
´
oi (Brazil) had
an accuracy greater than 83%.
Table 1 illustrates the differences between related
papers from the literature and our proposed work,
comparing the algorithms used in each study (Used
Algorithms). In addition, for the tests and executions
of the algorithms proposed in the works, databases
referring to different locations were used, and these
locations are also compared in this table (Locality).
The literature does not present hybrid approaches for
knowledge discovery, using mathematical models and
ANN, applied to the prediction of the occurrence of
crimes in a Brazilian city, which differs the proposed
work from other works in the literature.
3 METHODOLOGY AND
RESULTS
The database related to crimes in the city of S
˜
ao
Paulo (Brazil) from 2006 to 2016 can be found at
Kaggle
1
. This base was used in the development of
1
https://www.kaggle.com/inquisitivecrow/crime-data-
in-brazil. Accessed on July 4, 2019.
ICEIS 2020 - 22nd International Conference on Enterprise Information Systems
408
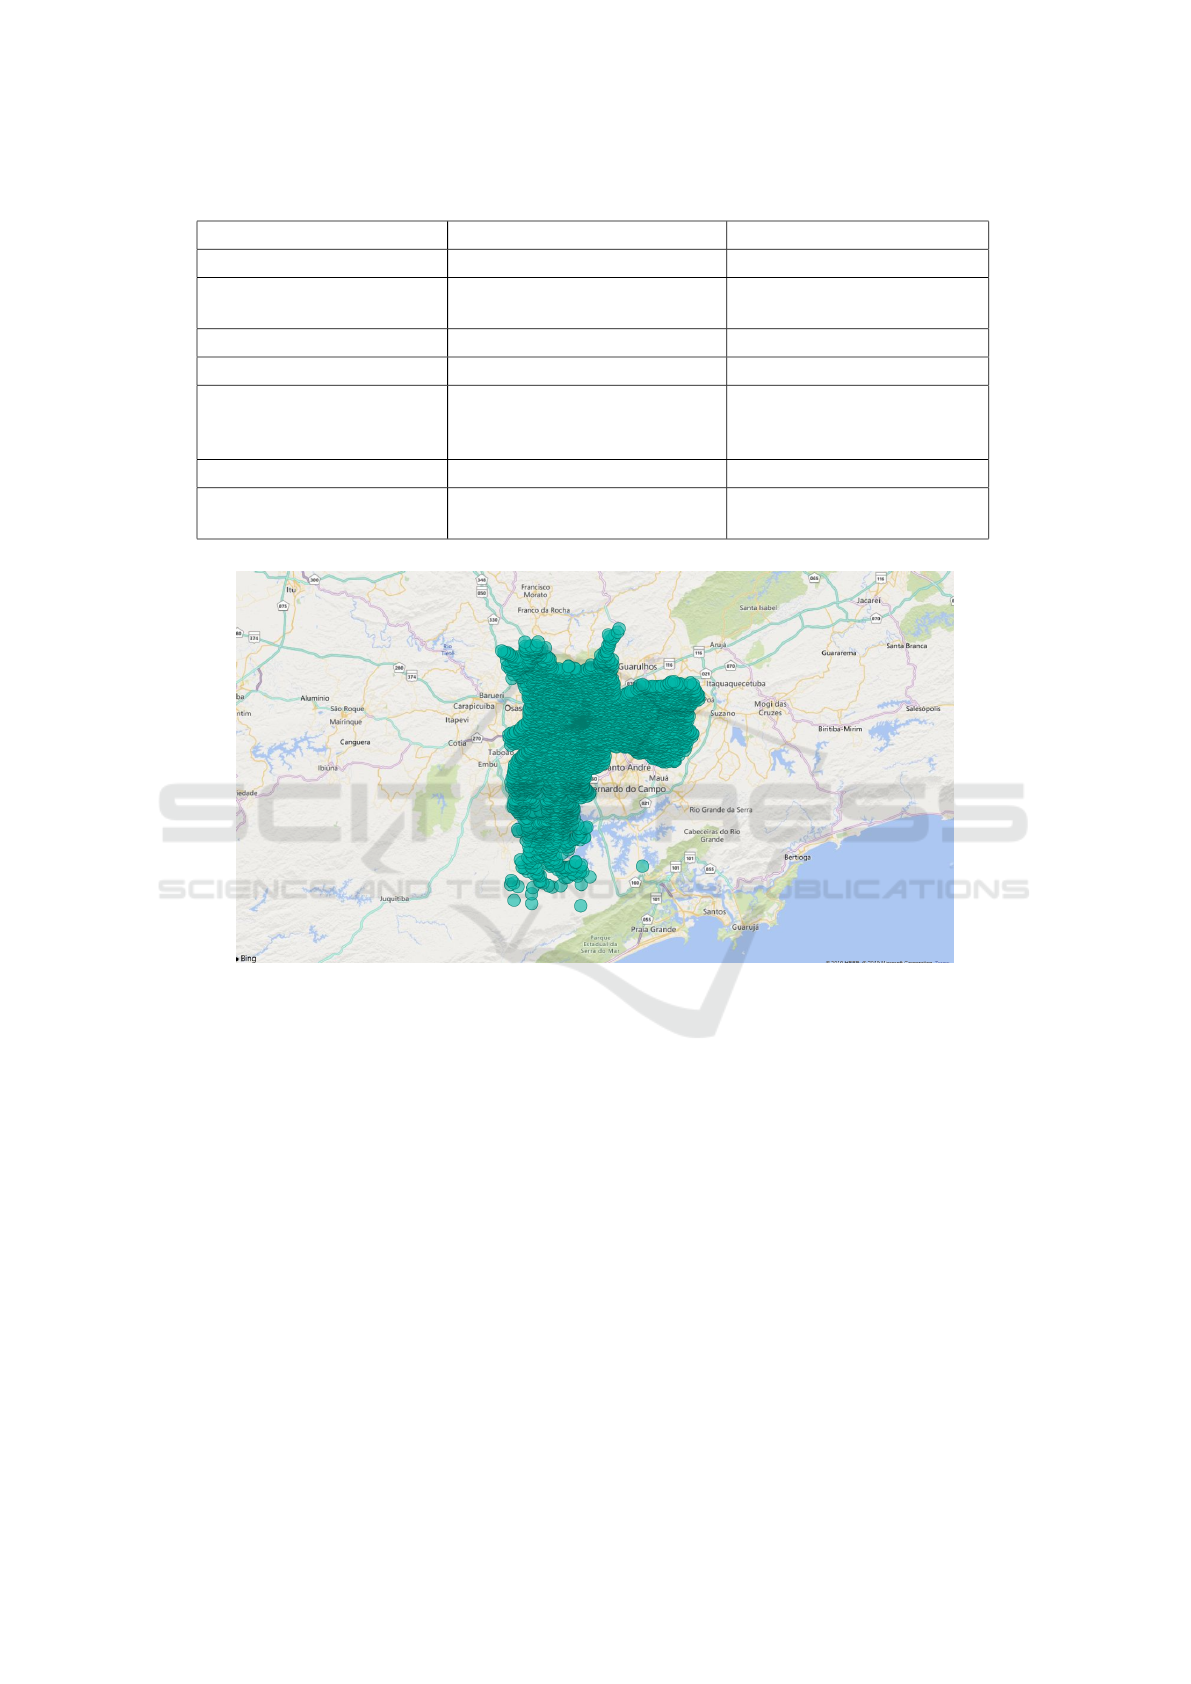
Table 1: Overview of related work.
Related Work Used Algorithms Locality
J
´
unior et al. (2016) Mathematical model ARIMA Natal (Brazil)
Almanie et al. (2015) Naive Bayes and Decision Tree Denver and Los Angeles
(USA)
Iqbal et al. (2013) Decision Tree and Naive Bayes Different US States
Cherian and Dawson (2015) Random Forest San Francisco (USA)
Lourec¸o et al. (2016) Logical-relational learning
through inductive logic pro-
gramming
Niter
´
oi (Brazil)
Wawrzyniak et al. (2018) ANN Poland Regions
Our Proposed Work Mathematical model SARIMA
and ANN
S
˜
ao Paulo (Brazil)
Figure 1: Crime locations in S
˜
ao Paulo.
the knowledge discovery process, and for that, it was
necessary to prepare and verify its consistency.
According to Fayyad et al. (1996), knowledge
discovery has five phases: the first is the selection
where the data is organized, the second, called pre-
processing, the data is analyzed and goes through an
adequacy. In the third, the data is stored in order to
facilitate the use of data mining techniques, which are
applied in the fourth phase, and, finally, the interpre-
tation and evaluation of the results is performed, veri-
fying if the generated information has validity for the
proposed problem.
Step 1 - Data Selection
First the data are analyzed in order to raise important
points to predict the amount of crimes in different lo-
cations in the city of S
˜
ao Paulo. This step is to verify
their structure, from which it is determined which
information is useful for the process of knowledge
discovery.
After these definitions, data on the location of the
crimes (latitude and longitude), as well as the date and
time of the occurrence were selected and stored on a
separate basis for the preprocessing step. Figures 1
and 2 show the locations with crime occurrences.
Step 2 - Preprocessing
The preprocessing step is responsible for analyzing
the data from the Selection step. In this part, re-
peated, missing and discrepant data are identified.
These data are processed in order to make them
useful or to determine their disposal. This process
is fundamental to make a homogeneous database,
making possible a better processing by the algo-
Hybrid Approach based on SARIMA and Artificial Neural Networks for Knowledge Discovery Applied to Crime Rates Prediction
409

Figure 2: Crime locations in S
˜
ao Paulo neighborhoods.
rithms, avoiding discrepancies and increasing the
assertiveness percentage.
In the case study, we analyzed all occurrences
with identification of the police station, year of the
occurrence report and number of the same occurrence
report (following the data documentation). Subse-
quently, all incomplete or repeated occurrences were
removed from the data.
For detecting outliers, fields containing latitude
and longitude were taken into account. From the anal-
ysis of these columns it was possible to determine oc-
currences whose coordinates represented discrepant
locations of the group, these data were treated as out-
liers, being removed from the database.
In order to determine the occurrence of crimes
in different areas of the city of S
˜
ao Paulo, it was
necessary to subdivide the database by geolocation.
Thus, the occurrences were subdivided into clusters
or quadrants, aiming to reduce the problem in smaller
groups. Thus, predictions can be made in isolated re-
gions such as neighborhoods, communities, and sur-
rounding specific regions such as parks, subway sta-
tions, event areas, and football stadiums, according to
the needs or definitions of the authorities responsible
for security matters.
The division was carried out in 15 different ranges
according to the length of the crime occurrences, and
each range has the same longitude spacing. Latitude
was not considered for the creation of these tracks.
Table 2 illustrates the minimum and maximum longi-
tude of each range used to show the technique.
It is worth mentioning that both the number of
ranges created and the technique used to perform
these divisions can and should be changed according
to the needs of those responsible for security matters.
Table 2: Longitude subdivision performed.
Data Min. Longitude Max. Longitude
C1 -46.82275
◦
-46.79229
◦
C2 -46.79229
◦
-46.76183
◦
C3 -46.76183
◦
-46.73137
◦
C4 -46.73137
◦
-46.70091
◦
C5 -46.70091
◦
-46.67045
◦
C6 -46.67045
◦
-46.63999
◦
C7 -46.63999
◦
-46.60953
◦
C8 -46.60953
◦
-46.57907
◦
C9 -46.57907
◦
-46.54861
◦
C10 -46.54861
◦
-46.51815
◦
C11 -46.51815
◦
-46.48769
◦
C12 -46.48769
◦
-46.45723
◦
C13 -46.45723
◦
-46.42677
◦
C14 -46.42677
◦
-46.39631
◦
C15 -46.39631
◦
-46.36584
◦
Figure 3 illustrates the subdivisions defined in Table
2, where different colors represent different clusters.
The participation of a domain expert is indicated
during the second step of the knowledge discovery
process to improve cluster division. The expert has
the role of determining the type of data grouping
from knowledge and feeling about the problem, thus
directing the analysis to specific regions, improving
the local allocation of security forces from a more ac-
curate estimate. the amount of resources to be allo-
cated in the predetermined groups.
Finally, as the last preprocessing step, the occur-
rences of each cluster are grouped according to date,
turning the base into a time series in the format shown
ICEIS 2020 - 22nd International Conference on Enterprise Information Systems
410

Figure 3: Data division into clusters.
in Table 3.
Table 3: Time series example.
Date Total occurrences
2016-12-01 99
2016-12-02 87
2016-12-03 92
2016-12-04 75
Therefore, the total occurrences represents the num-
ber of occurrences that happened on that specific day,
and for each day in the database there will be this cor-
responding quantity. It is worth mentioning that the
grouping can be performed in different time intervals
(such as day or multiple intervals per day) that should
preferably be defined by the domain specialist. The
result must always be a time series for the technique
presented in this work.
For better knowledge of the data belonging to the
clusters generated, statistical calculations were per-
formed on them. Table 4 illustrates these calculations
applied to the amount of crime in each database.
Step 3 - Data Storage
After the previous steps, filtered and preprocessed
information is stored in databases prepared for
applying data mining techniques. The database was
then subdivided into 15 smaller ones, representing
different locations in the city of S
˜
ao Paulo. However,
it is suggested the analysis of a domain expert to or-
ganize the data in order to meet the needs.
Table 4: Statistical calculations performed on databases.
Data Min. Max Mean Std.
C1 8 71 39.25 9.6
C2 18 120 67.06 14.19
C3 19 91 54.02 11.69
C4 10 55 33.69 8.45
C5 9 84 52.16 12.34
C6 19 108 72.63 15.91
C7 10 56 33.85 8.26
C8 12 70 39.52 9.69
C9 16 107 67.83 15.25
C10 10 97 51.8 11.91
C11 9 68 42.03 9.76
C12 6 48 22.86 6.78
C13 13 76 42.67 9.98
C14 9 57 31.69 7.96
C15 26 199 89.12 17.58
The stored data has information about the locality,
containing the latitude and longitude of the occur-
rence, as well as its date and time.
Step 4 - Data Mining Techniques
After the data preparation and storage steps, Step 4
consists of applying data mining techniques. The
techniques chosen to predict the amount of crime
in different regions of the city of S
˜
ao Paulo were:
mathematical model SARIMA and ANN.
According to Martinez et al. (2011), the SARIMA
Hybrid Approach based on SARIMA and Artificial Neural Networks for Knowledge Discovery Applied to Crime Rates Prediction
411

model is useful in situations where the database is a
set of time series that have seasonal periods that occur
with the same time intensity (either time, day, month
or year). Already ANN use methods that simulate the
problem solving ability of human brains in informa-
tion systems (Kraft et al., 2003). Both algorithms
have good applicability and assertiveness in future
prediction systems, and the union of the two methods
can assist in the prediction of both seasonal (using
SARIMA) and atypical (using ANN) situations.
For setting the SARIMA parameters, the
Autocorrelation (ACF) and Partial Autocorrelation
(PACF) Functions were used, thus defining the
best order and seasonal order parameters for each
grouping within the time base characteristics. The
ANN was implemented using a sequential model of
the Tensor Flow package with 1000 neurons in the
first layer and 100 in the second, using the total of
2000 epochs, inputting dates that change the seasonal
component of the series, such as holidays, recesses
and events in the city, generating a quantitative
output. Both algorithms were implemented in Python
and the ANN settings were defined from empirical
tests.
The databases were subjected to a seasonal de-
composition step. From the calculations performed at
this stage, a seasonal period of 7 days was determined
for the bases. This period was used in the SARIMA
model. From observations in the databases, it was
also possible to determine changes in the incidence
of occurrences on holidays, optional points and dates
that occurred special events (such as football games,
concerts and events), being called special events. This
information, along with the day, month, year, and day
of the week, was used as input to ANN.
Step 5 - Results Interpretation and
Evaluation
From the results obtained by the SARIMA method
and the ANN method, a model for the union of these
results was proposed. We used values found by ANN
on dates that differed from the linear component of
the series, (special events), and the results of the
SARIMA method for occurrences on normal days.
The use of this approach provided a gain in the
assertiveness of the proposed method, where it takes
into account dates whose seasonality is not effective.
To perform the tests and validate the results,
predictions were made for the events of November
2016 and December 2016 in all predetermined sub-
groups. The results were compared with the actual
values of the data.
The results interpretation and analysis is funda-
mental for the knowledge extraction process. For
this, two evaluation parameters were used: the
assertiveness of the algorithm and the Root Mean
Square Deviation (RMSD). Assertiveness is the
percentage that represents the proximity of the
prediction to the real value, and its formula is pre-
sented in Equation 1:
δ = (1 − |1 − P
i
/O
i
|) ∗ 100 (1)
where δ represents assertiveness, P
i
represents
predicted value and O
i
represents actual value. This
formula is derived from Equation 2 and it normalizes
the values within the range of 0% to 100%.
δ = (P
i
/O
i
) ∗ 100 (2)
According to Willmott (1982), RMSD is one of
the best general measures of model performance and
its error value is presented in the same dimensions as
the analyzed variable. The RMSD measure is given
by Equation 3:
RMSD =
s
1
n
n
∑
i=1
(P
i
− O
i
)
2
(3)
where P
i
is the predicted value, O
i
is the actual
observed value, and n is the amount of values
analyzed. The closer the RMSD result is to 0, the
greater the assertiveness of the algorithm.
Table 5 illustrates the assertiveness and RMSD
of the mathematical model SARIMA, ANN and
the union of the two models in each database
(representing each region of the city of S
˜
ao Paulo)
from the tests performed for the month of November.
The results were satisfactory, with the highest
assertiveness 86.83% (C15) and the best RMSD 0.81
(C12), and the average assertiveness of the 15 clusters
83.12% and the average of RMSD 1.75.
To prove the results found in the tests carried
out for the month of November, the same tests
were carried out for the month of December. Table
6 illustrates the assertiveness and RMSD of the
mathematical model SARIMA, ANN and the union
of the two models in each database of S
˜
ao Paulo
from the tests performed for the month of Decem-
ber. The results were satisfactory, with the highest
assertiveness 85.41% (C13) and the best RMSD 1.25
(C12), and the average assertiveness of the 15 clusters
76.68% and the average of RMSD 2.16.
The results using the union of the SARIMA
mathematical model with ANN (SARIMA+ANN)
showed (for almost all cases with exceptions in only
two of them) better results, both in the assertiveness
and in the RMSD compared to the results using only
the mathematical model SARIMA or only ANN.
ICEIS 2020 - 22nd International Conference on Enterprise Information Systems
412

Table 5: Assertiveness and RMSD results for Test 1 - November 2016.
Data δ RMSD δ RMSD δ RMSD
SARIMA SARIMA ANN ANN SARIMA +ANN SARIMA +ANN
C1 82.46% 1.41 80.23% 1.78 83.80% 1.31
C2 83.63% 2.86 83.86% 3.07 85.53% 2.66
C3 83.12% 2.07 76.17% 2.63 82.50% 2.13
C4 77.97% 1.41 74.88% 1.58 79.13% 1.32
C5 84.65% 1.79 83.02% 1.97 86.00% 1.64
C6 84.92% 2.43 84.36% 2.54 85.79% 2.39
C7 78.30% 1.56 73.70% 1.91 79.02% 1.54
C8 81.45% 1.63 74.76% 2.08 82.29% 1.60
C9 82.05% 2.51 77.70% 3.04 82.87% 2.52
C10 79.86% 2.03 81.06% 2.05 83.28% 1.71
C11 81.19% 1.63 82.50% 1.69 83.32% 1.47
C12 79.33% 0.88 64.51% 1.79 81.66% 0.81
C13 81.70% 1.54 71.54% 2.29 82.66% 1.44
C14 81.01% 1.29 70.10% 2.00 82.11% 1.25
C15 85.10% 2.80 69.31% 5.46 86.83% 2.50
Mean 81.78% 1.86 76.51% 2.39 83.12% 1.75
Table 6: Assertiveness and RMSD results for Test 2 - December 2016.
Data δ RMSD δ RMSD δ RMSD
SARIMA SARIMA ANN ANN SARIMA +ANN SARIMA +ANN
C1 70.18% 1.96 75.71% 1.58 75.31% 1.67
C2 76.34% 2.79 76.67% 2.43 81.75% 2.47
C3 76.16% 2.06 67.74% 2.92 80.10% 1.98
C4 68.81% 1.69 65.07% 1.94 73.27% 1.61
C5 69.43% 2.78 61.54% 3.36 70.75% 2.65
C6
74.27% 3.45 70.80% 3.70 77.78% 3.33
C7 77.04% 1.35 70.25% 1.73 79.50% 1.37
C8 71.87% 1.75 66.32% 2.17 73.67% 1.81
C9 68.88% 3.46 67.66% 3.62 74.02% 3.18
C10 71.08% 2.36 63.83% 3.10 74.13% 2.30
C11 65.10% 2.25 64.15% 2.37 69.49% 2.13
C12 70.53% 1.26 62.78% 1.49 73.90% 1.25
C13 80.96% 1.59 79.24% 1.73 85.41% 1.49
C14 76.53% 1.29 74.64% 1.46 79.45% 1.30
C15 77.39% 4.02 74.70% 4.24 81.62% 3.83
Mean 72.97% 2.27 69.41% 2.52 76.68% 2.16
The results found by the model for the tests
performed in December were compared with the
prediction results using an approach based on the
Random Forest algorithm configured with 1000
trees, in which this configuration was defined from
empirical tests. According to Breiman (2001), this
algorithm combines several decision trees to perform
the prediction.
Therefore, the comparison allows us to visualize
the gain of our proposed approach related to the al-
gorithms used in other works. (Almanie et al., 2015),
(Iqbal et al., 2013), (Cherian and Dawson, 2015).
Hybrid Approach based on SARIMA and Artificial Neural Networks for Knowledge Discovery Applied to Crime Rates Prediction
413

Table 7: Comparison between Random Forest (RF) and our proposed approach (SARIMA+ANN).
Data δ RMSD δ RMSD
RF RF SARIMA +ANN SARIMA +ANN
C1 63.29% 12.16 75.31% 1.67
C2 65.04% 20.83 81.75% 2.47
C3 76.43% 11.99 80.10% 1.98
C4 64.24% 9.43 73.27% 1.61
C5 55.67% 17.24 70.75% 2.65
C6 68.98% 20.01 77.78% 3.33
C7 77.03% 8.61 79.50% 1.37
C8 71.33% 10.61 73.67% 1.81
C9 63.19% 19.75 74.02% 3.18
C10 60.94% 57.11 74.13% 2.30
C11 57.11% 13.61 69.49% 2.13
C12 62.84% 7.74 73.90% 1.25
C13 78.01% 9.99 85.41% 1.49
C14 72.65% 8.15 79.45% 1.30
C15 71.46% 22.99 81.62% 3.83
Mean 67.21% 13.88 76.68% 2.16
Table 7 illustrates the comparison of the assertiveness
(δ) and RMSD results using Random Forest (RF) and
the proposed approach (SARIMA+ANN), showing
that the proposed approach has higher assertiveness
and lower RMSD in the results of all clusters, show-
ing that it is more efficient.
The algorithms results can assist in the police
forces distribution within the defined regions. Thus,
clusters in which the predictive outcome indicated a
higher number of crimes should receive greater at-
tention from security forces in relation to clusters
whose predicted number of crimes was lower. Thus,
prediction can define how many future crimes will
be in each given region, advancing police actions,
reducing idleness, and thereby helping to prevent
crime.
4 CONCLUSIONS
Proposing strategies to reduce crime rates has be-
come a priority in public discussions, as reducing
violence is a complex task in the large Brazilian
metropolises. Within this scenario, the knowledge
discovery process is a powerful decision-making tool,
providing techniques to solve the problem of correct
resource allocation, which in this context reflects the
distribution of security forces as appropriately as pos-
sible.
This way, our work used stages of the knowledge
discovery process, applying Mathematical Models
and Artificial Neural Networks in order to obtain
predictions to make the resource allocation process
more assertive. The proposal consists of a hybrid
approach, combining predictive results from the
SARIMA Mathematical Model and results achieved
by an Artificial Neural Network, to predict the num-
ber of future crime occurrences in different regions of
the city of S
˜
ao Paulo.
Tests and results showed that the found patterns
were satisfactory for the proposed predictions,
obtaining average hit rates of 83.12% and 76.78%
and RMSD of 1.75 and 2.16 for the two tests per-
formed. The presented technique has the potential to
reduce the percentage of crimes in the analyzed areas,
enabling a method that seeks to improve the distri-
bution of police forces to serve the population more
effectively.
For further tests, it is suggested to divide the re-
gions alongside a specialist in the field of public se-
curity, in order to predict the amount of crimes in
strategic regions to combat them.
ACKNOWLEDGEMENTS
The present work was carried out with the support of
the Coordenac¸
˜
ao de Aperfeic¸oamento de Pessoal de
N
´
ıvel Superior - Brazil (CAPES) - Financing Code
001. The authors thank CNPq, FAPEMIG, PUC Mi-
ICEIS 2020 - 22nd International Conference on Enterprise Information Systems
414

nas and REVEX for the partial support in the execu-
tion of this work.
REFERENCES
Almanie, T., Mirza, R., and Lor, E. (2015). Crime
prediction based on crime types and using spatial and
temporal criminal hotspots. CoRR, abs/1508.02050.
Breiman, L. (2001). Random forests. Machine Learning,
45(1):5–32.
Cherian, J. and Dawson, M. (2015). Robocop: Crime classi-
fication and prediction in san francisco. Forest, 15:70–
69.
Fayyad, U., Piatetsky-Shapiro, G., and Smyth, P.
(1996). From data mining to knowledge discovery in
databases. AI magazine, 17(3):37.
Gerber, M. S. (2014). Predicting crime using twitter and
kernel density estimation. Decision Support Systems,
61:115 – 125.
He, T. and Zheng, S. (2009). Time series analysis and
forcast based on active learning artificial neural net-
work. In 2009 Second International Symposium
on Knowledge Acquisition and Modeling, volume 1,
pages 84–87.
Iqbal, R., Murad, M. A. A., Mustapha, A., Panahy, P. H. S.,
and Khanahmadliravi, N. (2013). An experimental
study of classification algorithms for crime prediction.
Indian Journal of Science and Technology, 6(3).
J
´
unior, A. D. d. A., Martins, A. d. M., Verdier, R., and
Cacho, N. A. A. (2016). Predic¸
˜
ao de ocorr
ˆ
encias
policiais em natal: Uma abordagem em an
´
alise de
s
´
eries temporais. Workshop sobre cidades inteligentes
– WCID 2016.
Kraft, M. R., Desouza, K. C., and Androwich, I. (2003).
Data mining in healthcare information systems: case
study of a veterans’ administration spinal cord injury
population. In 36th Annual Hawaii International Con-
ference on System Sciences, 2003. Proceedings of the,
pages 9 pp.–.
Lourenc¸o, V., Mann, P., Paes, A., and de Oliveira, D.
(2016). Siapp: Um sistema para an
´
alise de ocorr
ˆ
encias
de crimes baseado em aprendizado l
´
ogico-relacional.
In Anais do XII Simp
´
osio Brasileiro de Sistemas de
Informac¸
˜
ao, pages 168–175, Porto Alegre, RS, Brasil.
SBC.
Martinez, E. Z., Silva, E. A. S. S., and Fabbro, A. L. D.
(2011). A SARIMA forecasting model to predict the
number of cases of dengue in Campinas, State of S
˜
ao
Paulo, Brazil. Revista da Sociedade Brasileira de
Medicina Tropical, 44:436 – 440.
Silva, L. J. S., Gonz
´
alez, S. F., Almeida, C. F. P., Barbosa,
S. D. J., and Lopes, H. (2017). Crimevis: An inter-
active visualization system for analyzing crime data
in the state of rio de janeiro. In Proceedings of the
19th International Conference on Enterprise Informa-
tion Systems - Volume 1: ICEIS,, pages 193–200. IN-
STICC, SciTePress.
Tobar, F. S. (2015). Tend
ˆ
encias criminais sul-americanas
em perspectiva comparada. In Revista Brasileira de
Seguranc¸a P
´
ublica, volume 9, pages 88–109, S
˜
ao
Paulo, SP, Brasil.
Wang, X., Gerber, M. S., and Brown, D. E. (2012). Au-
tomatic crime prediction using events extracted from
twitter posts. In Yang, S. J., Greenberg, A. M., and
Endsley, M., editors, Social Computing, Behavioral
- Cultural Modeling and Prediction, pages 231–238,
Berlin, Heidelberg. Springer Berlin Heidelberg.
Wawrzyniak, Z. M., Jankowski, S., Szczechla, E.,
Szyma
´
nski, Z., Pytlak, R., Michalak, P., and Borowik,
G. (2018). Data-driven models in machine learning
for crime prediction. In 2018 26th International Con-
ference on Systems Engineering (ICSEng), pages 1–8.
Willmott, C. J. (1982). Some comments on the evaluation
of model performance. Bulletin of the American Me-
teorological Society, 63(11):1309–1313.
Hybrid Approach based on SARIMA and Artificial Neural Networks for Knowledge Discovery Applied to Crime Rates Prediction
415
