
Predicting the Tear Strength of Woven Fabrics Via Automated Machine
Learning: An Application of the CRISP-DM Methodology
Rui Ribeiro
1,2 a
, Andr
´
e Pilastri
1 b
, Carla Moura
3
, Filipe Rodrigues
4
, Rita Rocha
4
and Paulo Cortez
2 c
1
EPMQ - IT Engineering Maturity and Quality Lab, CCG ZGDV Institute, Guimar
˜
aes, Portugal
2
ALGORITMI Centre, Dep. Information Systems, University of Minho, Guimar
˜
aes, Portugal
3
Riopele, Pousada de Saramagos, Portugal
4
CITEVE - Centro Tecnol
´
ogico das Ind
´
ustrias T
ˆ
extil e do Vestu
´
ario de Portugal, Famalic
˜
ao, Portugal
Keywords:
Fabrics, Tear Strength, Industry 4.0, Regression, Automated Machine Learning.
Abstract:
Textile and clothing is an important industry that is currently being transformed by the adoption of the In-
dustry 4.0 concept. In this paper, we use the CRoss-Industry Standard Process for Data Mining (CRISP-DM)
methodology to model the textile testing process. Real-world data were collected from a Portuguese textile
company. Predicting the outcome of a given textile test is beneficial to the company because it can reduce
the number of physical samples that are needed to be produced when designing new fabrics. In particular, we
target two important textile regression tasks: the tear strength in warp and weft directions. To better focus on
feature engineering and data transformations, we adopt an Automated Machine Learning (AutoML) during the
modeling stage of the CRISP-DM. Several iterations of the CRISP-DM methodology were employed, using
different data preprocessing procedures (e.g., removal of outliers). The best predictive models were achieved
after 2 (for warp) and 3 (for weft) CRISP-DM iterations.
1 INTRODUCTION
The textile and clothing industry is one of the largest
industrial sectors in the world (Shishoo, 2012). How-
ever, the textile market is highly competitive and there
is a pressure to improve production processes and re-
duce costs. Under this context, this industry can be
enhanced by adopting the Industry 4.0 concept, which
assumes the digitalization of the productive processes
(e.g., digital sensors with connectivity capabilities)
and a stronger usage of Information Technology (Lasi
et al., 2014).
In order to create the final textile product, the raw
materials undergo a series of processes, where fibers
are combined into yarns and the combination of these
yarns creates a fabric, which receives a series of treat-
ments, creating the final product that is delivered to
costumers. During this procedure, a large amount of
data is created and stored, such as the properties of
each yarn (e.g., color, thickness), the configuration
a
https://orcid.org/0000-0001-8078-4148
b
https://orcid.org/0000-0002-4380-3220
c
https://orcid.org/0000-0002-7991-2090
of each machine used in the creation process (e.g.,
spinning) (Mozafary and Payvandy, 2014) and the re-
sults of the fabric quality tests. All these data can be
processed by Data Mining (DM) and Machine Learn-
ing (ML) methods, allowing the discovery of valuable
knowledge in order to improve the textile manufactur-
ing process (Yildirim et al., 2018).
This paper presents an implementation of the
CRoss-Industry Standard Process for DM (CRISP-
DM) methodology (Wirth and Hipp, 2000), based
on Automated ML (AutoML), to predict the results
of tear strength test (warp and weft directions) on
fabrics. The data were collected from a Portuguese
textile company, aiming to reduce the number of at-
tempts required to produce a fabric.
2 BACKGROUND
2.1 Fabric Testing
Every time a textile company creates a new woven
fabric, it will typically execute a series a tests. These
548
Ribeiro, R., Pilastri, A., Moura, C., Rodrigues, F., Rocha, R. and Cortez, P.
Predicting the Tear Strength of Woven Fabrics Via Automated Machine Learning: An Application of the CRISP-DM Methodology.
DOI: 10.5220/0009411205480555
In Proceedings of the 22nd International Conference on Enterprise Information Systems (ICEIS 2020) - Volume 1, pages 548-555
ISBN: 978-989-758-423-7
Copyright
c
2020 by SCITEPRESS – Science and Technology Publications, Lda. All rights reserved
tests have a crucial role in evaluating the product qual-
ity (Hu, 2008). The International Organization for
Standardization (ISO) has launched several standards
related to fabric testing for a whole series of tests that
examine the physical, mechanical and chemical prop-
erties of fabrics. Some tests can be made to test two
different aspects, such as the tensile strength in warp
and weft direction (Dimitrovski et al., 2004) or one
aspect, such as pilling (Beltran et al., 2006).
Each time a new fabric is created, the tests are
made using a sample that the company must produce.
The sample is then analyzed and several results are
possible: the sample can pass all the tests and met
the requirements, thus the fabric is read for massive
production; the sample did not met the client require-
ments, so the developer must start again the fabric de-
sign and change some of the characteristics; or the
fabric did not pass the standard tests and it must be
verified if the flaw is in conception phase or in the pro-
duction phase. This process can be repeated several
times until all the requirements are made, resulting
in additional time and costs. It should be noted that
the loom that manufactures the fabric sample needs
to produce a minimum of several meters of a fabric in
each design attempt. Thus, the dematerialization of
this process, by means of a DM predictive modeling,
can potentially reduce the number of physical fabric
sample productions, saving time and costs.
2.2 CRISP-DM and AutoML
The CRISP-DM is a open analytic process stan-
dard for increasing the success of DM projects.
The methodology is based on a hierarchical process
model, described at four levels of abstraction: phase,
generic task, specialized task, and process instance
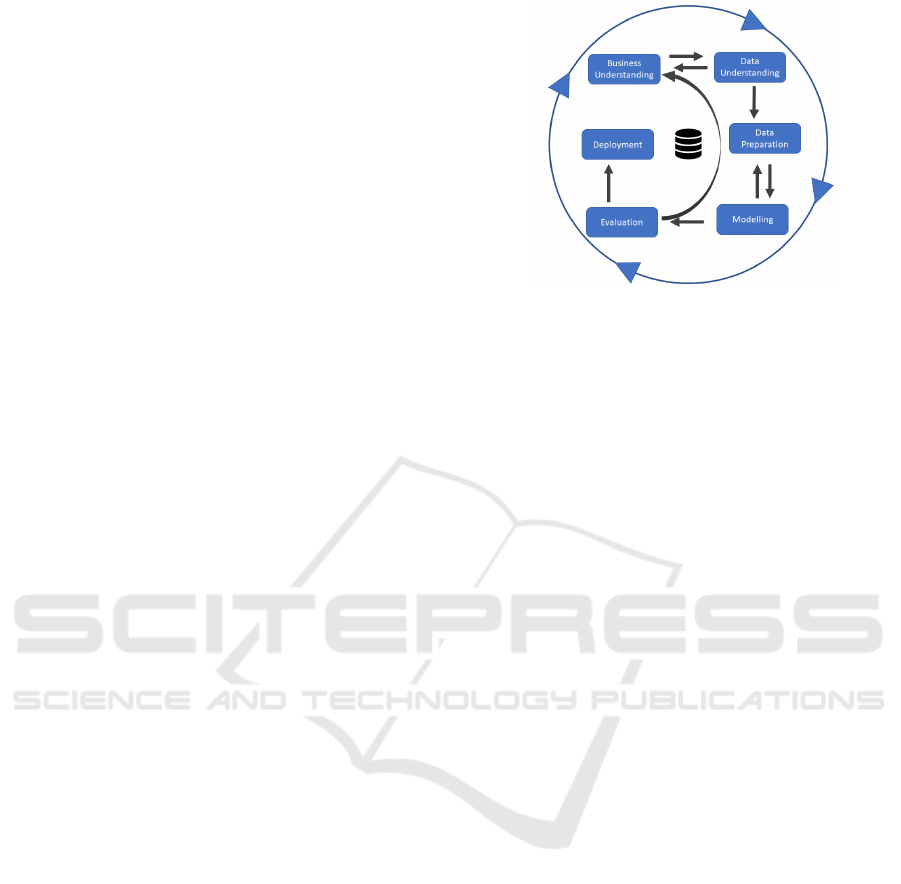
(Wirth and Hipp, 2000). Overall, CRISP-DM pro-
vides an overview to the life cycle of a data mining
project, with iterations of several phase sequences,
as shown in Figure 1. The iterative execution of the
methodology also assumes an interaction between the
business experts and the DM analysts.
During the Modeling phase of CRISP-DM, Ma-
chine Learning (ML) algorithms are often used to ex-
tract valuable knowledge from the data. Due to the
relevance of ML, several algorithms have been pro-
posed is the last decades, each one presenting its ad-
vantages. Examples of popular regression algorithms
include (Witten et al., 2016): Regression Trees, Lin-
ear Regression, Generalized Linear Models, Support
Vector Machines, Ensembles (including Boosting and
Random Forest) and Neural Networks.
In practice, the ML model creation process tends
to involve a highly iterative exploratory process. In
Figure 1: Phases of the CRISP-DM Model, Adapted from
(Wirth and Hipp, 2000).
this sense, an effective ML modeling process requires
solid knowledge and understanding of the different
types of ML algorithms and their hyperparameter ad-
justment (Maher and Sakr, 2019). In effect, the selec-
tion of the best ML algorithm is often performed us-
ing a trial-and-error procedure, which can be guided
by the analyst expert knowledge or heuristics (Gibert
et al., 2018). Such iterative and explorative nature of
the modeling process is commonly tedious and time-
consuming. Moreover, the quality of the ML results is
also dependent of data engineering aspects (e.g., fea-
ture selection, outlier detection) that are typically per-
formed on the Data Understanding and Data Prepara-
tion CRISP-DM stages (Gibert et al., 2016).
In this work, we use Automated Machine Learn-
ing (AutoML) (Feurer et al., 2015) during the Mod-
eling stage of CRISP-DM. AutoML systems were
specifically developed to automate this challenging
and time-consuming process (Le et al., 2019). There-
fore, AutoML allows the DM analysts to focus their
effort in applying their expertise in other important
components, such as feature and data engineering,
model validation and deployment.
2.3 Data Mining Applied to Fabrics
Textile fabric manufacturing generates large amounts
of data. DM techniques started being used in textile
engineering during recent years, aiming to solve the
difficulties of classical statistics in modeling complex
data relationships. Most DM applications to the tex-
tile industry involve classification tasks, such as qual-
ity control (e.g., textile image inspection) (Yildirim
et al., 2018). The application of DM to test areas is
more scarce, including the prediction of tear strength.
The tear strength is usually a measure of the force
(tensile stress) required to propagate a tear and is of-
ten used to give a direct assessment of the service-
ability of the fabric (Teli et al., 2008). Tear strength
Predicting the Tear Strength of Woven Fabrics Via Automated Machine Learning: An Application of the CRISP-DM Methodology
549

can be tested in both warp and weft directions and it
is considered one of the most important performance
attributes of woven textiles (Malik et al., 2011). Most
of the tear strength prediction studies employ linear
models, which are rather rigid and thus fail when non-
linear relationships exist among the data attributes. In
(Kotb, 2009), linear regression models were used to
predict the fabric tearing force based on 9 identified
input features, concluding that tearing force is largely
affected by the type and number of weft yarns, weft
density, ground structure, and ground yarns, while the
shape of the pile and the change in pile designation
have minor effects. In another study, the linear regres-
sion was also used to predict the fabric tear strength in
warp and weft direction for woven wool fabrics, ob-
taining a Pearson correlation between the actual and
the predicted strength for warp and weft of 0.976 and
0.975, respectively (Malik et al., 2011). The same lin-
ear regression model was used in (Eltayib et al., 2016)
to predict the relationship between fabric tear strength
and other independent variables, such as yarn ten-
sile strength, yarn count and fabric linear density. In
(Zeydan, 2010), a flexible nonlinear model, based on
an Evolutionary Artificial Neural Network, was pro-
posed to predict the tensile strength in a woven fabric,
outperforming a linear regression model.
In this paper, we use recent data, collected by a
Portuguese textile company, aiming to predict the tear
strength test, at both warp and weft directions, of fab-
rics. Within our knowledge, this is the first textile
industry study that employed an AutoML procedure,
which automatically tested five families of flexible
regression algorithms during the Modeling stage of
CRISP-DM. Such an automatic selection of the best
ML method allowed us to perform more quickly dif-
ferent CRISP-DM iterations (described in Sections
3.2, 3.3 and 3.4), after obtaining feedback from the
textile company and aiming to explore different data
and feature engineering approaches.
3 MATERIALS AND METHODS
In this paper, we use recent data, collected by a Por-
tuguese textile company, aiming to predict the tear
strength test, at both warp and weft directions, of fab-
rics. This Portuguese textile company creates and
produces fabrics for fashion and clothing collections
from diverse customers. The current fabric design is
based on the designer experience and intuition and
several trial-and-error fabric sample production ex-
periments. When designing new fabrics, in order to
meet the requirements of the client, the company pro-
duces several small sample attempts. In each attempt,
several laboratory tests are used to verify if the fabric
complies with quality goals. If this sample is not ap-
proved, the design process must be repeated, which is
translated into more time and costs for the company.
The fabric design process generates data that is related
to the several components of the fabric, as well as the
quality test results.
Within our knowledge, this is the first textile in-
dustry study that employed an AutoML procedure,
which automatically tested five families of flexible
regression algorithms during the Modeling stage of
CRISP-DM. Such an automatic selection of the best
ML method allowed us to perform more quickly dif-
ferent CRISP-DM iterations (described in Sections
3.2, 3.3 and 3.4), after obtaining feedback from the
textile company and aiming to explore different data
and feature engineering approaches.
3.1 Computational Environment
All executed experiments were conducted in two dif-
ferent open source computational environments: the
R statistical tool and its rminer package, that facil-
itates the use of DM techniques ML result analysis
(Cortez, 2010); and H2O, which implements an easy
to use AutoML algorithm (Landry et al., 2018). The
AutoML was configured to automatically select the
regression model and its hyperparameters based on
the best Mean Absolute Error (MAE) over a valida-
tion set, using a 10-fold cross-validation that is ap-
plied over the whole training data. A total of five
different regression families were automatically com-
pared by the AutoML. These include three individ-
ual base learners, namely Generalized Linear Models
(GLM), Gradient Boosting Machines (GBM) and dis-
tributed Random Forests (XRF), and two stacking en-
sembles, one using all trained models (Stacking All)
and other using just the best model per ML base algo-
rithm (Stacking Best).
3.2 First CRISP-DM Iteration
In this iteration, we performed the first five phases of
the CRISP-DM, Business Understanding to Evalua-
tion, aiming to predict the two fabric tear strength tar-
gets (warp and weft).
3.2.1 Business Understanding
The textile company expressed the need to reduce the
number of attempts that were necessary to produce a
fabric sample. The two fabric tear strength numeric
attributes (warp and weft directions) were also iden-
tified as relevant prediction targets, thus setting two
ICEIS 2020 - 22nd International Conference on Enterprise Information Systems
550

regression tasks. We also selected the computational
tools (R and H2O), as detailed in Section 3.1.
3.2.2 Data Understanding
First, we analyzed the textile company two main fab-
ric data sources: the Enterprise Resource Planning
(ERP), which included the 88,653 fabric main data
records, and the laboratory testing database, which
contained the fabric quality tests performed between
February 2012 to March 2019. After merging the two
data sources, the resulting dataset had 12,088 exam-
ples for the warp test and 12,143 for weft. Table 1
summarizes the initial set of input attributes, as sug-
gested by the textile company. Most attributes are nu-
meric and the exceptions are the type of fabric and
yarn code. The last 5 rows are related with yarn at-
tributes. We note that the each fabric can include sev-
eral types of yarns, which is a relevant issue that is
handled in Section 3.2.3. Figure 2 shows the box plot
distribution of the fabric weft and warp tear strength.
Figure 2: Box Plot of the Test Targets Used in First CRISP-
DM Iteration.
3.2.3 Data Preparation
A Data Warehouse system was implemented, in
which an Extraction, Transform, Load (ETL) pro-
cess was used to merge the ERP and laboratory test
databases and preprocessing some data records. The
preprocessing included the removal of fabric records
with missing components (e.g., with not registered
yarns). Also, in some cases it was detected that the
same fabric had different quality test values, related
with repeated tests conducted at different fabric pro-
duction stages. In order to have a single test value
per fabric, the distinct test values for the same fabric
were averaged. The resulting preprocessed data in-
cluded 8,453 observations for the warp test and 8,423
examples for the weft tear strength.
Each fabric can include several types of yarns. In
this work, we propose a novel input combination of
features in which we include the sequence of all pos-
sible yarns (up to 9 in our dataset), for both warp
and weft. Since each yarn is represented by 5 fea-
tures (Table 1), the regression models are fed with
12+9×5×2 (warp and weft)=102 input variables. A
zero padding (i.e., addition of zero values to missing
elements) was performed on all fabrics that had less
than 18 yarn codes. Finally, before feeding the data to
the ML algorithms, the numeric input attributes were
standardized to a zero mean and one standard devi-
ation, while the nominal variables were transformed
using the one-hot binary encoding, which sets one bi-
nary variable per possible level.
3.2.4 Modeling
To evaluate the models, an external holdout split was
executed, in which the data was randomly divided into
training (75%) and test (25%) data. The quality of the
predictions was measured using (Cortez, 2010; Wit-
ten et al., 2016): the Mean Absolute Error (MAE),
Adjusted R2 (Adj. R2) and classification Tolerance.
For MAE, the lower the values, the better are the pre-
dictions. Regarding Adj. R2 and Tolerance, higher
values indicate better predictions. Adj. R2 is often
used in multiple linear regression and it ranges from
0 to 1. The Tolerance value is based on the REC anal-
ysis and it measures the percentage of correctly clas-
sified examples when assuming a fixed absolute er-
ror tolerance (Bi and Bennett, 2003). In this paper,
three tolerance values were set: 5%, 10% and 20%.
We note that the percentage of error tolerance is com-
puted by considering the range of the true values.
Using only training data, the AutoML procedure
was applied, as described in Section 3.1. Figure 3
shows the REC curves and respective MAE values,
computed using validation data, for the best five ML
algorithms that were obtained when using the internal
10-fold procedure for the warp and weft tear strength
predictions. The REC curve shows the error tolerance
on the x-axis versus the percentage of correctly pre-
dicted points within the tolerance on the y-axis. In all
AutoML experiments conducted in this study, and for
both targets, the selected ML algorithm was a stacked
ensemble that used all trained models (Stacking All).
3.2.5 Evaluation
The obtained test set predictions are shown in Fig-
ure 4, in terms of the predicted (y-axis) versus real (x-
axis) values. The plots show an interesting initial fit,
with most points being close to the perfect prediction
(the red diagonal line), although there are high errors,
particularly when the real target values increase. This
behavior alerted the textile company experts for the
need to discard outliers, which was addressed in the
second CRISP-DM iteration.
Predicting the Tear Strength of Woven Fabrics Via Automated Machine Learning: An Application of the CRISP-DM Methodology
551
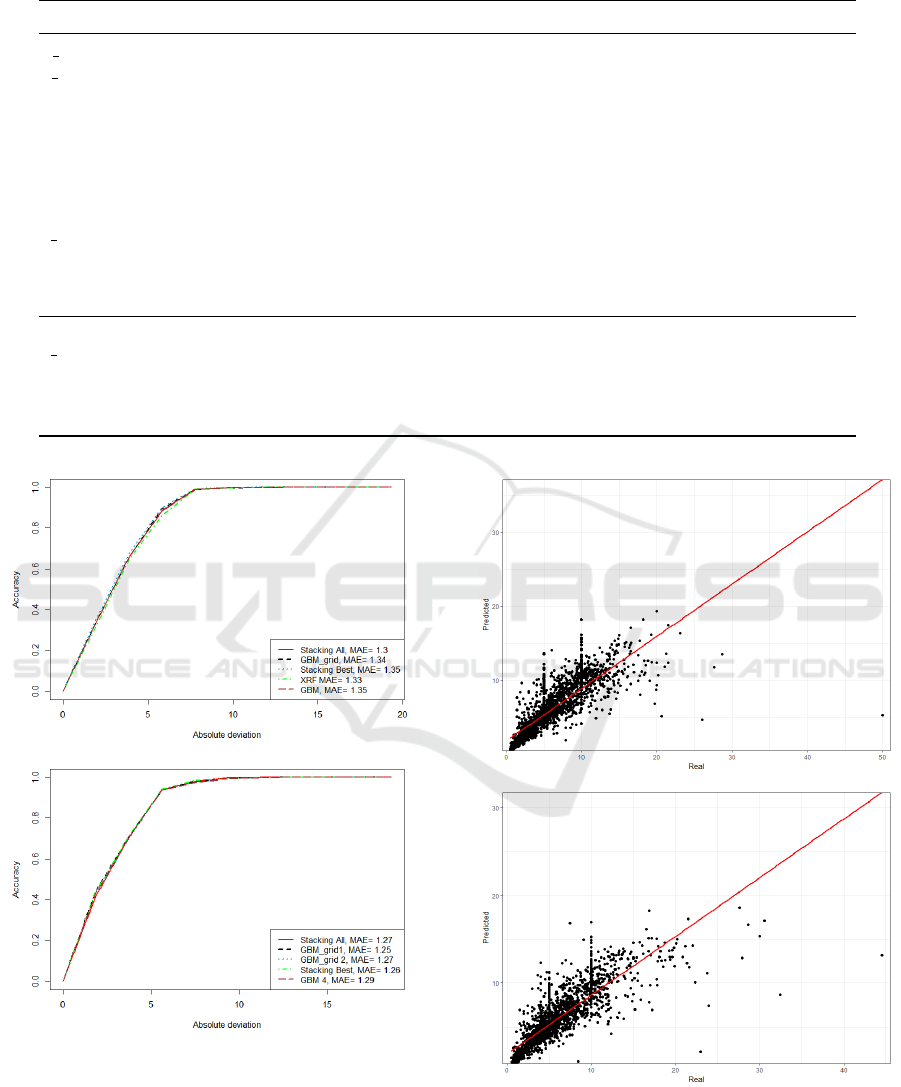
Table 1: List of Input Attributes Used for Regression.
Name Description (data type) Min. Max. Average
T cm Number of finished threads per centimeter (numeric) 18 1,321 115.60
P cm Number of finished picks per centimeter (numeric) 7 510 88.87
weight/m
2
Weight (in grams) per square meter (numeric) 22 1,690 241.70
finished width Width in centimeters (numeric) 90 168 140.00
weave design Weave pattern of the fabric (nominal with 21 levels) - - -
reed width Width of the reed in centimeters (numeric) 30 242 188.80
denting Number of the reed dents per centimeter (numeric) 0 252 126.80
ends/dent Number of yarns per dent (numeric) 0 88 2.30
n picks Number of picks on loom per centimeter (numeric) 0 81 16.50
weft code Identification code of the weft (nominal with 6,883 levels) - - -
warp code Identification code of the warp (nominal with 5,353 levels) - - -
warp total ends Total number of threads on the warp (numeric) 477 21,858 6,950.00
yarn code Identification code of the yarn (nominal with 11,020 levels) - - -
n folds Number of single yarns twisted (numeric) 1 12 1.60
yarn count Mass per unit length of the yarn 2 268 47.70
yarn usage If the yarn is used in warp or weft (binary) - - -
yarn repetitions Number of yarn repetitions in warp or weft 1 8 1.42
Figure 3: AutoML Validation REC Curves for the Warp
(Top) and Weft (Bottom) Tear Strengths.
3.3 Second CRISP-DM Iteration
In order to improve the previous results, a new itera-
tion of CRISP-DM was defined. During a new Busi-
Figure 4: Regression Scatter Plot for the First CRISP-DM
Iteration Warp (Top) and Weft (Bottom) Tear Strength Pre-
dictions.
ness Understanding phase execution, the textile com-
pany provided a list business normal ranges for the
ICEIS 2020 - 22nd International Conference on Enterprise Information Systems
552

tear strength values. Thus, all test values that were
inferior to 0.4 and superior to 25 were discarded in a
new Data Preprocessing stage, since these tests were
considered outliers (e.g., related with special uncom-
mon military fabrics). The resulting dataset included
8,431 observations for the warp shear strength target
and 8,399 examples for weft one. Figure 5 presents
the box plot values of the two analyzed targets. The
Modeling and Evaluation phases were then executed,
similarly to what is detailed in Section 3.2. When the
predictive results (presented in Section 4) were shown
to the textile company, they were considered more
satisfactory. However, the textile experts suggested
a new CRISP-DM iteration, which would test the im-
pact of using the overall composition of the fabric as
an useful and extra input element.
Figure 5: Box Plot of the Test Targets Used in Second
CRISP-DM Iteration.
3.4 Third CRISP-DM Iteration
In the third CRISP-DM iteration, we tested if the fi-
nal composition of the fabric (e.g., overall percent-
age of cotton and polyester), as an extra input feature,
could improve the predictions. During a new Data
Understanding stage, we collected the final compo-
sition attribute. The attribute, which contained 1,164
distinct levels, was treated as nominal, being thus pre-
processed using the one-hot transform. The remain-
ing CRISP-DM iteration was executed similarly to
the second CRISP-DM iteration (e.g., with outlier re-
moval), except that the predictive models used a total
of 103 input variables (and not 102).
4 RESULTS
Table 2 presents the overall predictive results for the
test data (25%) and the three CRISP-DM iterations.
For comparison purposes, we also tested a baseline
method that is equivalent to the first CRISP-DM it-
eration except that it uses the classical multiple lin-
ear regression model, as implemented in the rminer
R package (Cortez, 2010). In all three CRISP-DM
iterations, and as previously explained, the AutoML
selected model was the ensemble that included all
searched AutoML models (Stacking All).
The analysis of the tear strength warp results
shows an improvement from the first to second
CRISP-DM iteration but not from the second to the
third one. In effect, the best predictive results (for
all regression metrics) were achieved during the sec-
ond CRISP-DM iteration, showing that outlier re-
moval is beneficial when predicting the warp test, al-
though there is no gain in including the final fabric
composition as an input variable. Regarding the tear
strength weft, the results confirms the progress of the
CRISP-DM iterations, where each iteration resulted
in a lower MAE value. Also, the Adj. R
2
values im-
proved in a similar way. Thus, the best prediction re-
sults were obtained in the third iteration, which also
corresponds to the best classification Tolerance for all
5%, 10% and 20% values. This confirms that remov-
ing outliers and using the final fabric composition is
valuable for improving the weft quality predictions.
As for the baseline results, they are clearly worst
when compared to the AutoML method and for both
prediction goals, confirming that the regression tasks
are nonlinear. The MAE differences are higher when
comparing the linear method with the AutoML re-
sults for the first CRISP-DM iteration than when com-
paring different AutoML CRISP-DM iterations (e.g.,
the differences are 0.65, 0.08 and 0.02 for the weft
test), which clearly backs the AutoML as an interest-
ing modeling method.
To complement this analysis, Figure 6 plots the
REC curves for the predictive models from Table 2.
The plots include also the Normalized Regression Er-
ror Characteristic (NAREC) value for each curve (the
higher, the better). The REC curves confirm the best
performance of the third CRISP-DM iteration model
for tear weft and second CRISP-DM iteration model
for tear warp. The quality of the best model pre-
dictions can be visualized in Figure 7. The regres-
sion scatter plots show that the predictions are more
closer to the real values when compared with the scat-
ter plots of the first CRISP-DM iteration (Figure 4).
A high quality regression was achieved for the warp
tear strength prediction (top of Figure 7). These re-
gression results were shown to the textile company
experts, which provided a very positive feedback. In
effect, the best predictive models are already being
incorporated into a prototype tool, which includes a
friendly dashboard that will be soon integrated with
the textile production information system.
Predicting the Tear Strength of Woven Fabrics Via Automated Machine Learning: An Application of the CRISP-DM Methodology
553
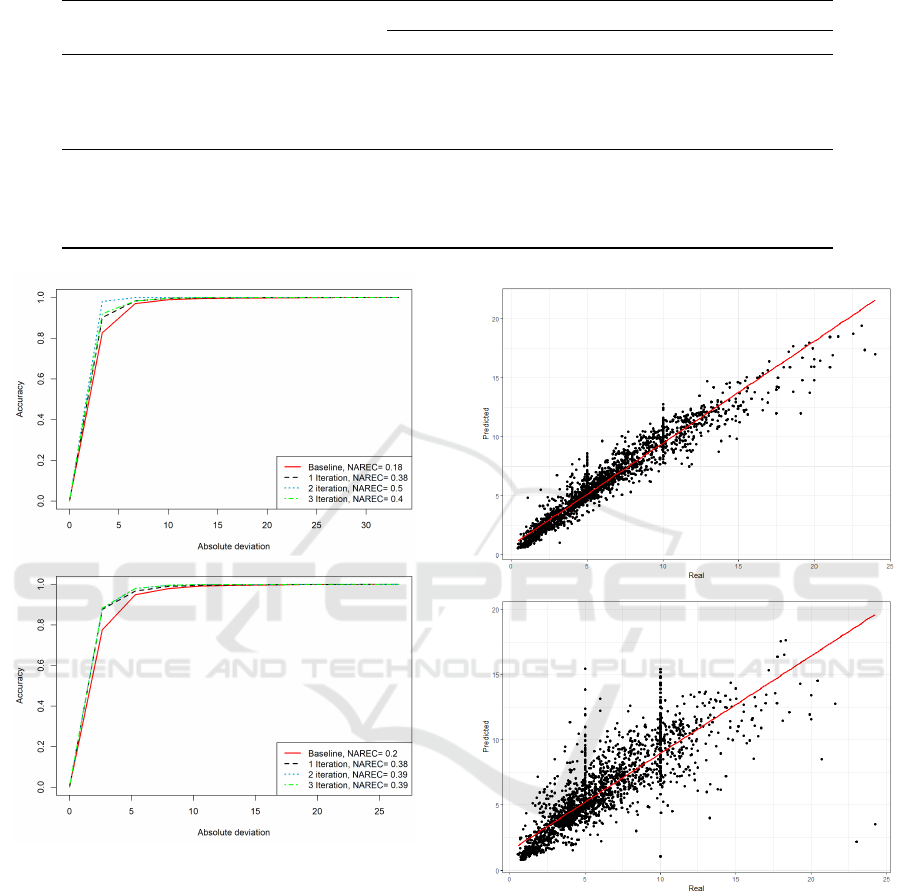
Table 2: Overall Predictive Results for the Test Data (Best Values in Bold).
Target Regression Metrics
Test Iteration Interval MAE Tol. 5% Tol. 10% Tol. 20% Adj. R
2
Tear warp
Baseline [0.52,50.00] 2.06 2% 4% 7% 0.44
1
st
[0.52,50.00] 1.30 6% 12% 23% 0.68
2
nd
[0.44,24.00] 0.70 8% 16% 29% 0.92
3
rd
[0.44,24.00] 1.20 6% 14% 23% 0.75
Tear weft
Baseline [0.50,44.52] 1.92 2% 4% 8% 0.49
1
st
[0.50,44.52] 1.27 5% 12% 20% 0.69
2
nd
[0.56,24.25] 1.18 5% 11% 22% 0.71
3
rd
[0.56,24.25] 1.16 6% 12% 21% 0.72
Figure 6: REC Curves for the Warp (Top) and Weft (Bot-
tom) Tear Strength Prediction Models.
5 CONCLUSIONS
In this paper, a DM approach guided by the CRISP-
DM methodology was used to predict the results of
fabric tear strength tests in warp and weft directions.
A total of three CRISP-DM iterations were executed,
aiming to explore distinct data preprocessing oper-
ations (e.g., outlier removal, inclusion of additional
inputs) for the two regression tasks. The data were
collected from a Portuguese textile company and it
included an initial database of thousands of fabric
records from 2012 to 2019. A Data Warehouse was
Figure 7: Regression Scatter Plot of Best Models for the
Warp (Top) and Weft (Bottom) Tear Strength Predictions.
created, allowing to clean and merge these records
with the laboratory test data, resulting in a warp and
weft test datasets with around 8,400 examples. Dur-
ing the Modeling stage of CRISP-DM, an AutoML
was adopted, automatically tuning and selecting the
best ML model for a particular dataset. The Au-
toML tool always selected a stacking ensemble that
included all tested ML models and that obtained much
better regression results when compared with a linear
regression baseline model.
The best warp tear strength predictions were
ICEIS 2020 - 22nd International Conference on Enterprise Information Systems
554

achieved at the second CRISP-DM iteration, which
involved outlier removal, while the best weft test re-
sults were obtained at the third CRISP-DM iteration,
which included the final fabric composition as an ex-
tra input feature. The best predictive results were an-
alyzed as valuable by the textile company experts. In
future work, we intend to apply a similar approach
in the prediction of other fabric quality tests, such as
pilling. Moreover, we intend to apply the best predic-
tion models in a real textile environment, aiming to
reduce the number of fabric sample creation attempts.
ACKNOWLEDGMENTS
This work was carried out within the project “Tex-
Boost: less Commodities more Specialities” ref-
erence POCI-01-0247-FEDER-024523, co-funded
by Fundo Europeu de Desenvolvimento Regional
(FEDER), through Portugal 2020 (P2020).
REFERENCES
Beltran, R., Wang, L., and Wang, X. (2006). Predicting the
pilling tendency of wool knits. The Journal of The
Textile Institute, 97(2):129–136.
Bi, J. and Bennett, K. P. (2003). Regression error char-
acteristic curves. In Proceedings of the 20th inter-
national conference on machine learning (ICML-03),
pages 43–50.
Cortez, P. (2010). Data mining with neural networks and
support vector machines using the r/rminer tool. In In-
dustrial Conference on Data Mining, pages 572–583.
Springer.
Dimitrovski, K., Gabrijel
ˇ
ci
´
c, H., Kova
ˇ
cevi
´
c, S., and
Nikoli
´
c, M. (2004). The influence of weft yarn char-
acteristics on tensile strength of woven fabrics in warp
direction. In Magic World of Textiles.
Eltayib, H. E., Ali, A. H., and Ishag, I. A. (2016). The
prediction of tear strength of plain weave fabric us-
ing linear regression models. International Journal of
Advanced Engineering Research and Science, 3(11).
Feurer, M., Klein, A., Eggensperger, K., Springenberg, J.,
Blum, M., and Hutter, F. (2015). Efficient and robust
automated machine learning. In Advances in neural
information processing systems, pages 2962–2970.
Gibert, K., Izquierdo, J., S
`
anchez-Marr
`
e, M., Hamilton,
S. H., Rodr
´
ıguez-Roda, I., and Holmes, G. (2018).
Which method to use? an assessment of data mining
methods in environmental data science. Environmen-
tal modelling & software, 110:3–27.
Gibert, K., S
`
anchez-Marr
`
e, M., and Izquierdo, J. (2016). A
survey on pre-processing techniques: Relevant issues
in the context of environmental data mining. AI Com-
munications, 29(6):627–663.
Hu, J. (2008). Fabric testing. Elsevier.
Kotb, N. (2009). Engineering of tearing strength for pile
fabrics. Journal of Textile and Apparel, Technology
and Management, 6(1).
Landry, M., Bartz, A., Aiello, S., Eckstrand, E., Fu, A., and
Aboyoun, P. (2018). Machine Learning with R and
H2O: Seventh Edition. Technical Report September.
Lasi, H., Fettke, P., Kemper, H.-G., Feld, T., and Hoffmann,
M. (2014). Industry 4.0. Business & information sys-
tems engineering, 6(4):239–242.
Le, T. T., Fu, W., and Moore, J. H. (2019). Scaling
tree-based automated machine learning to biomedical
big data with a feature set selector. Bioinformatics.
btz470.
Maher, M. M. M. Z. A. and Sakr, S. (2019). SmartML:
A Meta Learning-Based Framework for Automated
Selection and Hyperparameter Tuning for Machine
Learning Algorithms. In EDBT: 22nd International
Conference on Extending Database Technology, Lis-
bon, Portugal.
Malik, Z. A., Malik, M. H., Hussain, T., and Arain, F. A.
(2011). Development of models to predict tensile
strength of cotton woven fabrics. Journal of engi-
neered fibers and fabrics, 6(4):155892501100600407.
Mozafary, V. and Payvandy, P. (2014). Application of
data mining technique in predicting worsted spun
yarn quality. The Journal of The Textile Institute,
105(1):100–108.
Shishoo, R. (2012). The global textile and clothing indus-
try: technological advances and future challenges. El-
sevier.
Teli, M., Khare, A., and Chakrabarti, R. (2008). Depen-
dence of yarn and fabric strength on the structural pa-
rameters. AUTEX Research Journal, 8(3):63–67.
Wirth, R. and Hipp, J. (2000). Crisp-dm: Towards a stan-
dard process model for data mining. In Proceedings of
the 4th international conference on the practical ap-
plications of knowledge discovery and data mining,
pages 29–39. Citeseer.
Witten, I. H., Frank, E., Hall, M. A., and Pal, C. J. (2016).
Data Mining: Practical machine learning tools and
techniques. Morgan Kaufmann.
Yildirim, P., Birant, D., and Alpyildiz, T. (2018). Data min-
ing and machine learning in textile industry. Wiley In-
terdisciplinary Reviews: Data Mining and Knowledge
Discovery, 8(1).
Zeydan, M. (2010). Prediction of fabric tensile strength by
modelling the woven fabric. Woven Fabric Engineer-
ing, page 155.
Predicting the Tear Strength of Woven Fabrics Via Automated Machine Learning: An Application of the CRISP-DM Methodology
555
