
A Real-time Temperature Anomaly Detection Method for IoT Data
Wei Liu
1,2 a
, Hongyi Jiang
1 b
, Dandan Che
1,2
, Lifei Chen
1,3
and Qingshan Jiang
1
1
Shenzhen Institutes of Advanced Technology, Chinese Academy of Sciences, Shenzhen, P.R. China
2
Shenzhen School of Advanced Technology, University of Chinese Academy of Sciences, Shenzhen, P.R. China
3
Digital Fujian IoT Laboratory of Environmental Monitoring, Fujian Normal University, Fuzhou, P.R. China
Keywords:
IoT, Real-time Data, Anomaly Detection, Smoothed Z-Score Algorithm, Dynamic Threshold.
Abstract:
Temperature control plays a vital part in medical supply management, of which effective monitoring and
anomaly detection ensure that the medication storage is maintained properly to meet health and safety
requirements. In this paper, an unsupervised temperature anomaly detection method, called DTAD (Dynamic
Threshold Anomaly Detection), is proposed to detect anomalies in real-time temperature time series. The
DTAD sets dynamic thresholds based on the Smoothed Z-Score Algorithm, rather than set fixed thresholds
of a temperature range by experience. The comparative evaluation is performed on the DTAD and four other
commonly employed methods, the results of which shows that the DTAD reaches a higher accuracy and a
better time efficiency. The DTAD is fully automated and can be used in developing a real-time IoT temperature
anomaly detection system for medical equipment.
1 INTRODUCTION
With the rapid development of Internet of Things
(IoT) technology, various IoT applications emerge
in different industries including agriculture, logistics,
manufacturing, healthcare, finance, education, etc
(Li and Chen, 2014). Among them, healthcare is
closely related to the physical and mental well-being
of people, and thus is an issue of utmost concern to the
society. Under the stress of the aging populations and
the greater prevalence of chronic diseases, healthcare
stakeholders have been continuously striving to find
a solution for the increasing healthcare demand gap
(Due
˜
nas et al., 2016). Fortunately, technological
advances in areas including biotechnology, pharma-
ceuticals, information technology, the development
of medical equipment, and more have all made
significant contributions to the construction of the
smart healthcare system, improving the health of
people all around the world.
Information technologies, including IoT, mobile
Internet, cloud computing, big data, 5G, micro-
electronics, and artificial intelligence, together with
modern biotechnology constitute the cornerstone of
smart healthcare (Clauson et al., 2018). The scenarios
a
https://orcid.org/0000-0002-5165-8051
b
https://orcid.org/0000-0003-0655-0532
of smart healthcare include medical nursing, medical
equipment management, medical supplies manage-
ment, telemedicine and medical incident management
(Liang, 2012a).
Medical supplies are core assets for healthcare
facilities (B
´
elanger et al., 2018). It is of vital im-
portance that healthcare organizations manage their
assets to keep their expenditures under control as well
as ensure the quality of healthcare delivery. Storage
temperature management, as an indispensable part
of the medical supply management, contributes to
the maintenance of the normal storage conditions
of medication, as medication storage requires strict
temperature control requirements in order to maintain
product potency (Makui et al., 2019). Tempera-
ture management of medical supplies calls for an
integrated and systematic process to monitor, alert
and remedy, and any failure of which may result
in economic losses or even medical malpractices
(Ukil et al., 2016). Under that demand, a real-time
IoT temperature monitoring and anomaly detection
system with a high accuracy and a good time
efficiency can be a solution.
To explore an anomaly detection method suitable
for medication storage temperature data, we acquired
real temperature data sets of 100 refrigerators
sensors placed in different medical refrigerators
in biomedicine laboratories from November, 2018
112
Liu, W., Jiang, H., Che, D., Chen, L. and Jiang, Q.
A Real-time Temperature Anomaly Detection Method for IoT Data.
DOI: 10.5220/0009410001120118
In Proceedings of the 5th International Conference on Internet of Things, Big Data and Security (IoTBDS 2020), pages 112-118
ISBN: 978-989-758-426-8
Copyright
c
2020 by SCITEPRESS – Science and Technology Publications, Lda. All rights reserved

to December, 2019 (more than 6,000,000 records
in total). We evaluate the performances of the
commonly emoployed anomaly detection methods on
the data sets but they all show comparatively low
accuracy and poor time efficiency (see Comparative
Evaluation in section 4.2 for details).
Hence, to improve the quality and efficiency of
the temperature management of medication storage,
a temperature anomaly detection method based on
adaptive dynamic threshold and Smoothed Z-Score
Algorithm is proposed to detect anomalies IoT
refrigerator time series data. This method takes the
stationarity and periodicity of the temperature time
series into consideration, and thus develops a more
accurate detection approach. Moreover, this paper
compares the effectiveness indicator of this method
and several commonly employed anomaly detection
methods to prove its validity.
2 RELATED WORK
Due to the large variety of scenarios and demands,
there are numerous models developed to detect
anomalies, each has its own characteristics and
applications. Traditionally for temperature anomaly
detection, the most commonly adopted method
is Delphin method of fixed threshold: once the
temperature goes beyond the fixed thresholds, it will
be identified as an anomaly (Munir et al., 2019).
However, as the thresholds are set at fixed levels, this
methold can not detect anomalies at their beginning
periods, which leads to poor timeliness.
Statistical models are also commonly employed
to detect anomalies. Boxplot is a simple statistical
method which defines its outlier as a data point
that is located outside the whiskers of the boxplot
(Shevlyakov et al., 2013). Another popular statistical
method, Local Outlier Factor (LOF), is an unsuper-
vised density-based method which detects the outliers
by measuring the local deviation of a given data
point with respect to its k-nearest-neighbors (k-NN)
(Lei et al., 2018). However, the basic assumption
of LOF is that the data is distributed in a spherical
way around the instance (Goldstein, 2014), which is
not the case for IoT temperature data. Classification
method such as k-NN is also used to detect anomaly
points by classifying data based on similarities in
distance metrics. However, k-NN is a supervised
learning algorithm and the effectiveness of k-NN
highly depends on the choice of k (Liu et al., 2017).
Anomaly detection models also exist based on
machine learning. Isolation Forest is an unsupervised
model-based algorithm which identifies the point
anomaly by separating/isolating it from the rest of
the instances. The way of isolation is recursively
generating partitions on the sample by randomly
selecting a feature and then randomly selecting a split
value between the maximum and minimum values of
that selected feature (Puggini and Mcloone, 2018).
However, Isolation Forest is only sensitive to global
outliers, and is weak in dealing with local outliers,
which may decrease its effectiveness in anomaly
detection for temperature time series.
The main restriction of the above mentioned
methods on refrigerator temperature time series data
is that they neglect the gradual variation process
of the temperature anomaly points, which results in
lower accuracy and worse timeliness. To address this
problem, we try to include the temperature variation
tendencies revealed by the history data in the anomaly
detection process, and the method we propose will be
presented in the next section.
3 A DYNAMIC ANOMALY
DETECTION METHOD
There are mainly two phases of our Dynamic
Threshold Anomaly Detection (DTAD) Method: a)
conduct Augmented Dickey-Fuller Test to verify the
stationary of the IoT temperature data acquired; b)
conduct anomaly detection using Smoothed Z-Score
Algorithm. The flow chart of the Dynamic Threshold
Anomaly Detection Method is shown in Figure 1.
Figure 1: Flow Chart of Dynamic Threshold Anomoaly
Detection Method.
3.1 Data Pre-processing
There are three parts of data pre-processing and the
detailed explanations are stated below.
3.1.1 Stationary Test
Temperature sensor data is time series. It’s generally
assumed that the characteristics of the time series
reflected in the historical data still exist in the
future, which describes the stationary quality of
the time series: the invariance under translation in
time. Considering this requirement of time series,
A Real-time Temperature Anomaly Detection Method for IoT Data
113

the stationary test was conducted before anomaly
detection.
Stationary time series satisfies the following
conditions: a) the mean is a constant, independent
of time; b) the variance is a constant, independent of
time; c) the covariance between the values at any two
time points, depends only on the difference between
the two times, and not on the location of the points
along the time axis.
Here, Augmented Dickey-Fuller Test (ADF Test)
is adopted to test the stationary of our time
series(Mushtaq, 2011). The purpose of the ADF
Test is to test whether a time series variable is non-
stationary and possesses a unit root (a stochastic
trend): if yes, then the time series is not stationary;
otherwise, it is stationary.
3.1.2 Data Type Identification
Medical refridgerators can be catagorized into two
calsses, inverter or conventional refrigerator, each
generating different type of data. Inverter refrigerator
can adjust its inside temperature according to the
temperature detected and keep it at a constant
level, but conventional refrigerator does not have the
function. As a result, the temperature data of inverter
refrigerator is periodic, while that of conventional
refrigerator is not. Hence, the first step in anomaly
detection is to identify the models of the refrigerators
and categorize them into inverter refrigerator or
conventional refrigerator.
Considering the periodicity of the inverter refrig-
erator data, it is necessary to decycle the time series
before the next step. For the purpose, the moving
average model is used (Liang, 2012b):
F
t+1
=
1
n
t
∑
i=t−n+1
x
i
(1)
where F
t+1
denotes the temperature value at time t +1
after smoothing, x
i
represents the temperature value at
time i, and n is the number of values to be averaged.
3.1.3 Time Series Initialization
Time Series initialization aims to allow anomalies to
be accurately detected even when they appear in the
beginning periods of the time series. The DTAD
is predicting future temperature values based on a
certain period (which is defined as the lag and will
be further explained in the next section) of historical
data, and it assumes that there is no anomaly in this
period so the predicted values are normal temperature
values. Hence, we create a short series manually
where there is no anomaly in the series and insert it
ahead of the original time series.
The time series initialization is based on the
Algorithm 1. The time series initialization will
transform the original time series (T S) into the new
initialized time series (IT S). There are two phases
of the time series initialization: a) examine the
temperature data values, select the m numbers which
appears most in yesterday’s series, and repeat each
number for n times (so there will be totally m × n
numbers); b) randomly assort the m × n numbers into
a series, position the series right in front of the actual
temperature data series, splice the two series together
into a new initialized series.
Algorithm 1: Time Series Initialization.
Input:
Original Time Series (T S), m, n
Output:
Initialized Time Series (IT S)
1: CountTS ⇐ count the occurances of each
temperature value
2: SortedTS ⇐ sort CountTS in descending order
3: for i = 1 to m do
4: for j = 1 to n do
5: IT S[m × n] = SortedTS[m];
6: end for
7: end for
8: IT S ⇐ ramdomly shuffle IT S
9: return IT S;
Note that m × n equals to the lag of the mean
and variance to ensure that they reflect a lag period
without anomaly. Through series initialization, it is
assured that there is no anomaly in the lag period,
the mean and variance are not be affected, and the
following detection will not be influenced.
3.2 Smoothed Z-Score Algorithm
The core concepts of Smoothed Z-Score Algorithm
are as follows(Moore et al., 2011) : a) use the
historical data in the lag to predict the next value, and
if the actual value exceeds a certain threshold range
of the predicted value, it will be considered as an
outlier, or a point anomaly; b) smooth the outlier in
order to eliminate the effects to the following anomaly
detections.
The Smoothed Z-Score Algorithm is outlined in
Figure 2. The first step is to set a lag and calculate
the mean of the historical data in the lag to predict
the next value (Lima et al., 2019). Then adjust
the data range that would be considered acceptable
through the soft-threshold setting. The soft-threshold
is the number of standard deviations from the moving
mean above which the algorithm will classify a new
IoTBDS 2020 - 5th International Conference on Internet of Things, Big Data and Security
114
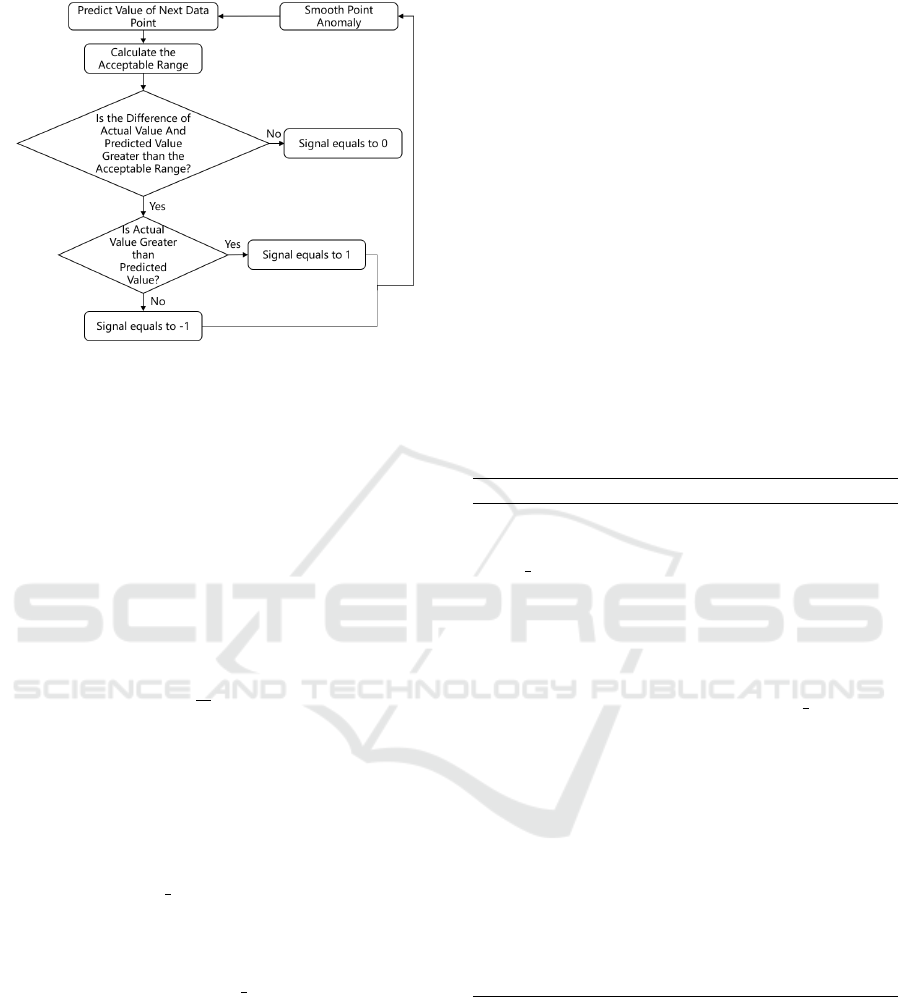
Figure 2: Outline of the Smoothed Z-score Algorithm.
datapoint as being an anomaly. The soft-threshold
is problem-dependent, and is therefore value that
must be tuned according to the characteristics of
different data sets and the algorithm sensitivity that
will be considered proper (Perkins and Heber, 2018).
Afterwards, calculate the difference of the actual
value and the predicted value. If the difference
exceeds the range, the point would be considered as
an outlier, or a point anomaly; otherwise, it is normal.
The detailed process description is stated below:
Step1: Predict the value of point
i+1
, the next point of
point
i
, according to the set lag:
p
0
i+1
=
1
N
i
∑
l=i−N+1
p
l
(2)
where p
0
i+1
is the predicted value of the point
i+1
, p
l
is the actual value of point
l
, i = 1, 2, ..., N, N is the
number of data in the lag.
Step2: Calculate the data range that would be
considered acceptable (range), according to the
variance of the historical data in the lag (σ
2
lag
) and
the soft-threshold (S threshold), which is the number
of standard deviations from the moving mean above
which the algorithm will classify a new datapoint as
being an anomaly (Dons et al., 2019).
range = σ
2
lag
× S threshold (3)
Step3: Calculate the difference of the actual value
and the predicted value (di f f
i+1
) of point
i+1
:
di f f
i+1
= p
i+1
− p
0
i+1
(4)
where p
i+1
is the actual value of the p
0
i+1
.
Step4: According to the range in step2, calculate the
anomaly detection result (signal
i+1
) for point
i+1
:
signal
i+1
=
−1 if di f f
i+1
< 0
0 if 0≤ di f f
i+1
≤ range
1 if di f f
i+1
> range
(5)
If signal
i+1
equals to 0, which means that the
difference is less than the range, then point
i+1
is an
outlier, or a point anomaly. When point
i+1
has been
identified as an outlier, compare the difference with
0. If the difference is greater than 0, which means the
actual value is greater than the predicted value, then it
is an outlier of higher temperature; if the difference is
smaller than 0, which means the actual value is lower
than the predicted value, then it is an outlier of lower
temperature.
Step5: If signal
i+1
does not equals to 0 in step4,
smooth p
i+1
by setting it equal to the value of the
previous point point
i
:
p
A
i+1
= p
i
(6)
where p
A
i+1
means that point
i+1
is an outlier, p
i
is the
actual value of point
i
.
Based on the above mentioned steps, the
Smoothed Z-score Algorithm is outlined into Algo-
rithm 2.
Algorithm 2: Smoothed Z-score Algorithm.
Input:
Initialized Time Series (IT S), lag, soft-threshold
(S threshold)
Output:
Anomaly Detection Result (signal)
1: for i = lag to t do
2: PIT S
i+1
⇐ mean(IT S
i+1−lag
,...,IT S
i
)
3: sigmalag
i
⇐ std(IT S
i+1−lag
,...,IT S
i
)
4: if absolute(IT S
i+1
−PIT S
i+1
) > S threshold ∗
sigmalag
i
then
5: if IT S
i+1
> PIT S
i+1
then
6: signal
i+1
⇐ +1
7: else
8: signal
i+1
⇐ −1
9: end if
10: IT S
i+1
⇐ IT S
i
/∗smooth ∗/
11: else
12: signal
i+1
⇐ 0
13: end if
14: end for
15: return signal;
4 DATA ANALYSIS
We collected real temperature data of 100 refrigera-
tors sensors placed in biomedicine laboratories over
a time range of 1 year and 2 months, and among
which, we picked 3-week data (September 26, 2019
to October 16, 2019) of 18 different refrigerators
sensors (10 invertor refrigerators and 8 conventional
A Real-time Temperature Anomaly Detection Method for IoT Data
115

refrigerators) to evaluate the performance of DTAD.
The temperature data was collected every 10 minutes,
each time series contains 3,024 instances, so the
dataset contains 54,432 records in total. We labeled
the data and compared the anomaly detection results
of the DTAD method with the labeled data. Detailed
description of the evaluation process is provided in
this section.
4.1 Method Evaluation
Here, considering the periodicity reflected in invertor
refrigerator data, we list the results of invertor
refrigerator data and conventional refrigerator data
separately. The tables display the statistics for
actual anomalies and anomalies detected, as well as
the accuracy for DTAD. The results are shown in
Table 1 and Table 2, where NR is the number of
real anomaly points, AR is abnormal rate, ND is
the number of anomaly points detected, ACC is the
accuracy. Accuracy (ACC) is adopted here to evaluate
the effectiveness of this method. Accuracy is the ratio
of points detected correctly (including anomaly points
which were detected as abnormal, and normal points
which were not detected as abnormal) to the total
number of points.
AR =
NR
NP
(7)
where NR is the number of real anomaly points, NP
is the total number of points.
ACC =
NDC
NP
(8)
where NDC is the number of points detected
correctly, NP is the total number of points.
Table 1: Results of Periodic Invertor Refrigerator Data.
Sensor ID NR AR ND ACC
Sensor1 448 0.1481 413 0.9812
Sensor2 153 0.0506 148 0.9692
Sensor3 46 0.0152 48 0.9940
Sensor4 24 0.0079 26 0.9884
Sensor5 39 0.0129 52 0.9884
Sensor6 0 0 0 1
Sensor7 51 0.0169 40 0.9950
Sensor8 133 0.0440 101 0.9709
Sensor9 344 0.1138 291 0.9722
Sensor10 0 0 0 1
Table 1 and 2 show that the accuracies of DTAD
for different sensors are all above 97%, and do
not show any tendency of increase or decrease
as the number of anomalies goes up. It proves
Table 2: Results of Non-periodic Conventional Refrigera-
tors Data.
Sensor ID NR AR ND ACC
Sensor11 0 0 0 1
Sensor12 0 0 0 1
Sensor13 0 0 0 1
Sensor14 25 0.0083 20 0.9884
Sensor15 6 0.0020 13 0.9924
Sensor16 0 0 0 1
Sensor17 0 0 0 1
Sensor18 2 0.0007 3 0.9983
that DTAD has high accuracy, or in other words,
excellent performance in detecting anomaly points for
temperature time series data.
4.2 Comparative Evaluation
Different models are employed here to verify
their effectiveness in detecting anomaly points for
temperature times series. The comparative methods
are Fixed Threshold method, 3sigma method, Boxplot
method (Shevlyakov et al., 2013) and Isolated Forest
method (Liu et al., 2009).
Precision (P), Recall (R) and F1-score (F1) are
adopted here to evaluate the effectiveness of the five
methods (Bishop, 2006). Precision is defined as the
number of anomaly points detected correctly divided
by the number of anomaly points detected. Recall
is defined as the number of anomaly points detected
correctly divided the number of actual anomaly
points. Precision and recall are a pair of contradictory
indicators. For most cases, if the precision is high,
the recall is low; if the precision is high, the recall
is low. In anomaly detection, if you want a higher
Precision, the data range that would be considered
abnormal needs to be narrowed down, so there will
be fewer anomaly points detected and usually fewer
anomaly points detected correctly, which results in
a lower Recall. However, in cases where we want
to find an optimal blend of precision and recall we
can combine the two metrics using what is called F1-
score.
P =
NDC
ND
(9)
where NDC is the number of anomaly points detected
correctly, ND is the number of anomaly points
detected.
R =
NDC
NR
(10)
where NDC is the number of anomaly points detected
correctly, NR is the number of real anomaly points.
IoTBDS 2020 - 5th International Conference on Internet of Things, Big Data and Security
116
F1 =
2 × P × R
P + R
(11)
where P is the precision, R is the recall.
Table 3: Comparative Evaluation Results for Different
Anomaly Detection Methods.
ACC P R F1
Fixed
Threshold
0.9728 0.9208 0.9297 0.9252
3sigma 0.9173 1 0.2828 0.4409
Boxplot 0.9788 0.9869 0.8788 0.9297
Isolation
Forest
0.9292 0.8274 0.6133 0.7044
DTAD 0.9910 0.9432 0.9390 0.9411
Table 3 shows that among the five methods,
DTAD has the highest accuracy (0.9910) and
F1(0.9411), followed by Boxplot (Shevlyakov et al.,
2013) (P:0.9788 and F1:0.9297) and Fixed Threshold
(P:0.9728 and F1:0.9252). Isolation Forest (Puggini
and Mcloone, 2018) and 3sigma (Goldstein, 2014) do
not perform well with temperature time series, with
accuracies of 0.9292 and 0.9173 respectively and F1
of 0.7044 and 0.4409 respectively.
Besides accuracy, the time efficiency of different
methods should also be taken into consideration when
evaluating these methods. Here, we take the average
time cost for the five methods to run a sensor’s data to
measure their time efficiency.
Table 4: Time Cost for Different Anomaly Detection
Methods.
Models Time(second)
Fixed Threshold 9.7713
3sigma 9.5046
Boxplot 9.0531
Isolation Forest 10.1892
DTAD 8.9544
In terms of time efficiency, the DTAD takes the
shortest time and is the fastest of the five methods.
Isolation forest takes the longest time, probably
because it is a method of integrating multiple weak
models with high time complexity.
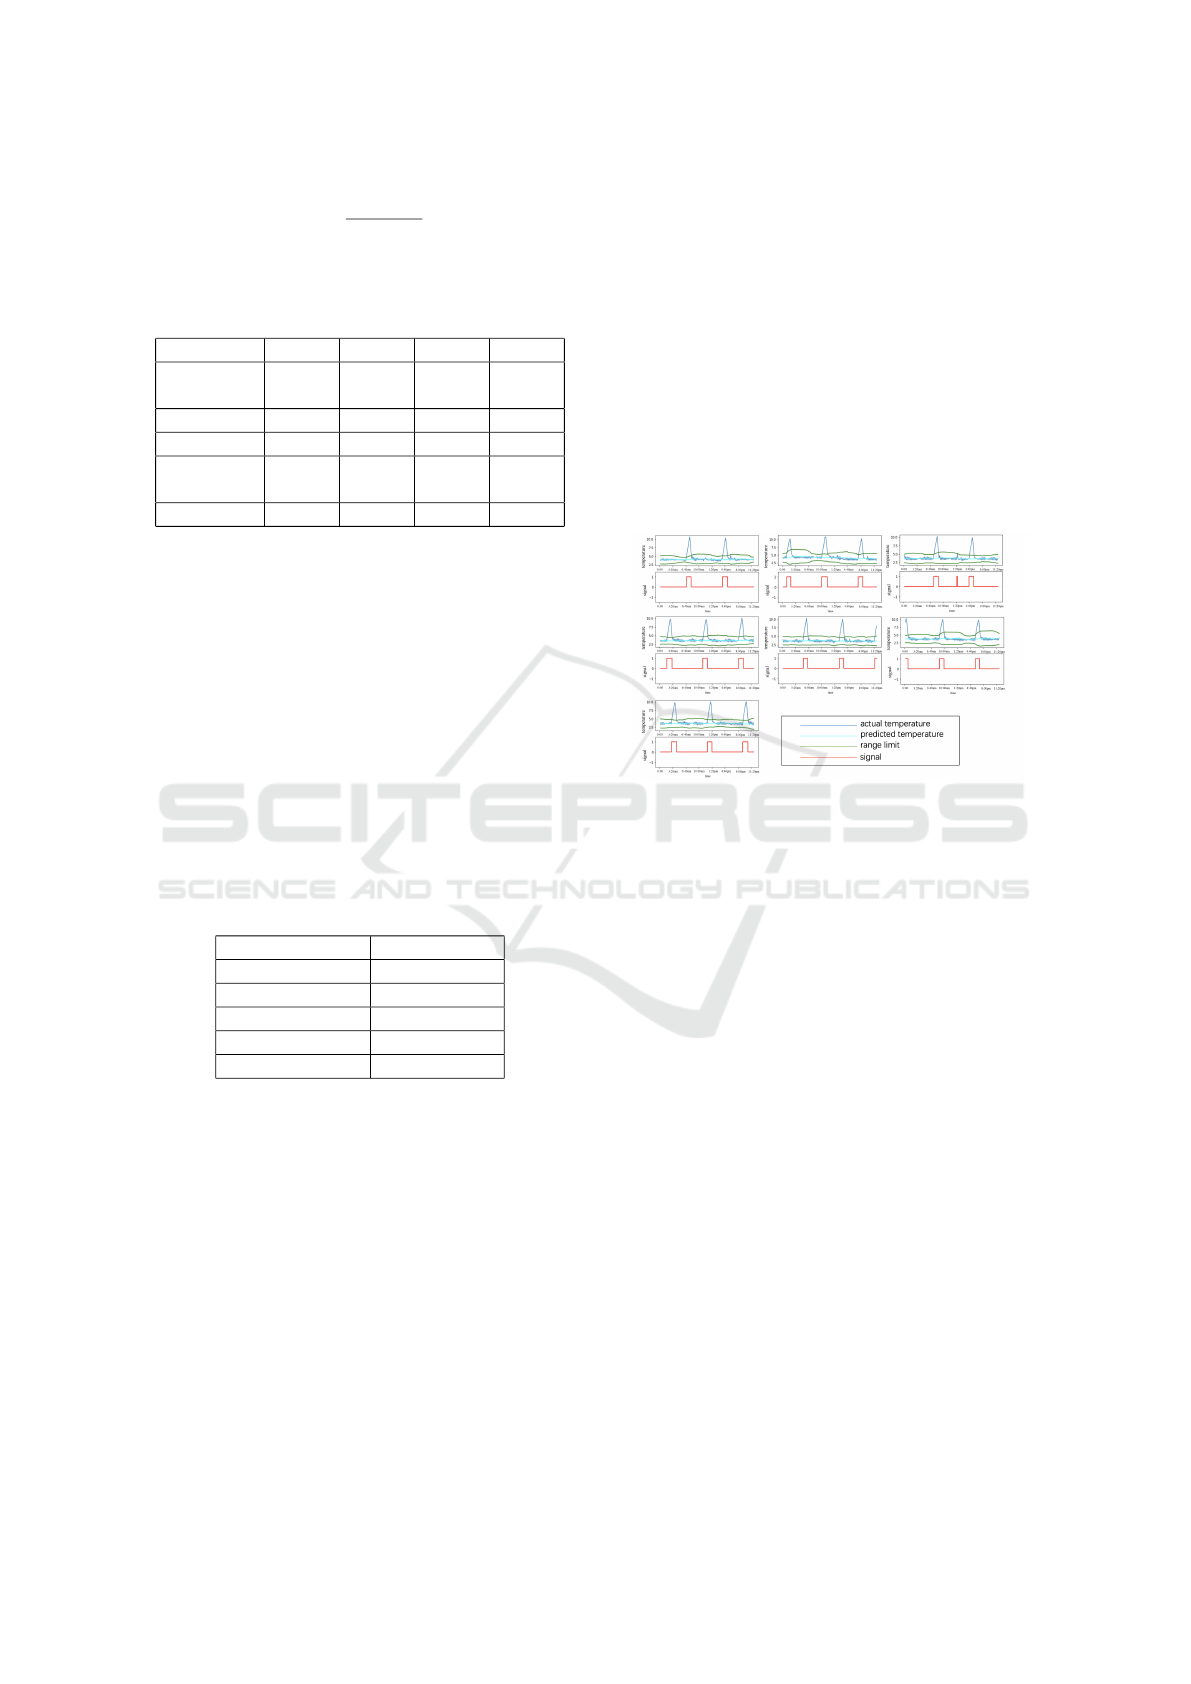
4.3 Detection Results of Single Sensor
The above sections verify the effectiveness of the
DTAD by calculating evaluation indexes for it as
well as other commonly-employed anomaly detection
methods. To further proof its validity, we compare
the anomaly detection results (signals) with the
observable anomalies in the actual temperature data
visually. We select one-week data (September 30,
2019 to October 6, 2019) of Sensor1, plot the actual
temperature data and the signals calculated using
the DTAD in the same coordinate, and compare the
peaks on the same time axis. In Figure 3, the blue
lines represent the actual temperature data, the cyan
lines represent the predicted temperature, the green
lines represent the acceptable temperature range limit
(upper and lower), and the red lines represent the
signal. Figure 3 shows that the peaks in the actual
temperature are in good agreement with the signals
detected using the DTAD both for their occurrences
and durations. It is also shown in this figure that the
DTAD is acute as it can detect peaks that are visually
smaller.
Figure 3: The DTAD Detection Results of Sensor1 From
September 30 to October 6, 2019.
5 CONCLUSION
In this paper, we propose an unsupervised anomaly
detection method based on dynamic threshold for
temperature time series data. The commonly
employed methods for anomaly detection neglect
the gradual variation process of the anomaly points,
which leads to comparatively lower accuracy and
timeliness. To address the problem, this paper, for the
first time, introduces Smoothed Z-score Algorithm
in the field of temperature anomaly detection. The
proposed DTAD method adjusts the acceptable
temperature range through the data-driven adaptive
thresholds which take the temperature variation
pattern of the historical data into consideration. The
proposed method also includes series initialization to
eliminate the influences of the anomalies for future
detection. We evaluate this method on real world
temperature datasets of 3-week IoT data and provide
the comparative evaluation of 4 other commonly
employed maly detection methods. Experiments
show that DTAD outperforms the other methods in
both accuracy and time efficiency.
DTAD can be used in developing a fully
A Real-time Temperature Anomaly Detection Method for IoT Data
117

automated real-time monitoring anomaly detection
system for IoT temperature data. One avenue of
further study is to extend the detection to non-
stationary time series data. Another effort will be
oriented to the improvement of DTAD’s applications
on a wider range of datasets in the real-world context.
ACKNOWLEDGEMENTS
This work is supported by the Joint Engineering
Research Center for Health Big Data Intelligent Anal-
ysis Technology and the SIAT-Zongheng Intelligence
Techniques Lab. The work of L. Chen is supported
by the National Natural Science Foundation of China
under Grant No. 61672157.
REFERENCES
B
´
elanger, V., Beaulieu, M., Landry, S., and Morales, P.
(2018). Where to locate medical supplies in nursing
units: An exploratory study. In Supply Chain Forum:
An International Journal, volume 19, pages 81–89.
Taylor & Francis.
Bishop, C. M. (2006). Pattern Recognition and Machine
Learning (Information Science and Statistics).
Ceyssens, F., C. M. B. e. (2019). Chronic neural recording
with probes of subcellular cross-section using 0.06
mm dissolving microneedles as insertion device.
Sensors and Actuators B: Chemical, 284:369–376.
Clauson, K. A., Breeden, E. A., Davidson, C., and Mackey,
T. K. (2018). Leveraging blockchain technology
to enhance supply chain management in healthcare.
Blockchain in healthcare today.
Dons, E., Laeremans, M., Orjuela, J. P., Avila-Palencia, I.,
de Nazelle, A., Nieuwenhuijsen, M., Van Poppel, M.,
Carrasco-Turigas, et al. (2019). Transport most likely
to cause air pollution peak exposures in everyday
life: Evidence from over 2000 days of personal
monitoring. Atmospheric environment, 213:424–432.
Due
˜
nas, M., Ojeda, B., Salazar, A., Mico, J. A., and Failde,
I. (2016). A review of chronic pain impact on patients,
their social environment and the health care system.
Journal of pain research, 9:457.
Goldstein, M. (2014). Anomaly Detection in Large
Datasets. Phd-thesis, University of Kaiserslautern,
M
¨
unchen, Germany.
Lei, Z., Yong, C., and Liao, S. (2018). Algorithm
optimization of anomaly detection based on data
mining. In 2018 10th International Conference on
Measuring Technology and Mechatronics Automation
(ICMTMA).
Li, W. and Chen, R. (2014). Intelligent medical system
based on the internet of things and strategy research
of its construction. LASERNAL, 35(5):56–59.
Liang, R. (2012a). Application of internet of things in the
construction of intelligent medical system. Computer
knowledge and technology, 8(2):303–306.
Liang, R. (2012b). Research on prediction method of
api based on the enhanced moving average method.
Computer knowledge and technology, 8(2):303–306.
Lima, B. M. R., Ramos, L. C. S., de Oliveira, T. E. A.,
da Fonseca, V. P., and Petriu, E. M. (2019). Heart
rate detection using a multimodal tactile sensor and
a z-score based peak detection algorithm. CMBES
Proceedings, 42.
Liu, F. K., Deng, C. Y., Wang, X. R., and Wang, X. Y.
(2017). Outlier detection of smart grid big data
based on improved fast search and find density peaks
clustering algorithm. Electric Power Information and
Communication Technology.
Liu, F. T., Kai, M. T., and Zhou, Z. H. (2009). Isolation
forest. In Data Mining, 2008. ICDM ’08. Eighth IEEE
International Conference on.
Makui, A., Ashouri, F., and Barzinpour, F. (2019).
Assignment of injuries and medical supplies in urban
crisis management. Journal of Applied Research on
Industrial Engineering, 6(3):232–250.
Moore, J., Goffin, P., Meyer, M., Lundrigan, P., Patwari,
N., Sward, K., and Wiese, J. (2011). Managing in-
home environments through sensing, annotating, and
visualizing air quality data. Proceedings of the ACM
on Interactive, Mobile, Wearable and Ubiquitous
Technologies, 2(3):1–28.
Munir, M., Siddiqui, S. A., Dengel, A., and Ahmed, S.
(2019). Deepant: A deep learning approach for
unsupervised anomaly detection in time series. IEEE
Access.
Mushtaq, R. (2011). Augmented dickey fuller test.
Perkins, P. and Heber, S. (2018). Identification of ribosome
pause sites using a z-score based peak detection
algorithm. In 2018 IEEE 8th International Conference
on Computational Advances in Bio and Medical
Sciences (ICCABS), pages 1–6. IEEE.
Puggini, L. and Mcloone, S. (2018). An enhanced variable
selection and isolation forest based methodology
for anomaly detection with oes data. Engineering
Applications of Artificial Intelligence, 67:126–135.
Shevlyakov, G. L., Andrea, K., Choudur, L., Smirnov,
P. O., and Vassilieva, N. (2013). Robust versions of
the tukey boxplot with their application to detection
of outliers. In IEEE International Conference on
Acoustics, Speech, and Signal Processing.
Ukil, A., Bandyoapdhyay, S., Puri, C., and Pal, A.
(2016). Iot healthcare analytics: The importance of
anomaly detection. In 2016 IEEE 30th International
Conference on Advanced Information Networking and
Applications (AINA), pages 994–997. IEEE.
IoTBDS 2020 - 5th International Conference on Internet of Things, Big Data and Security
118
